2025 Season Recap

We will look back and see what KU’s roster and team actually did in 2025 compared to projections. Here is the Season Preview.

Dajuan Harris Projections: 75% Mins, -0.20o, +1.18d, +0.98 PPGAB, +1.86 Per100, 2.48 WAR

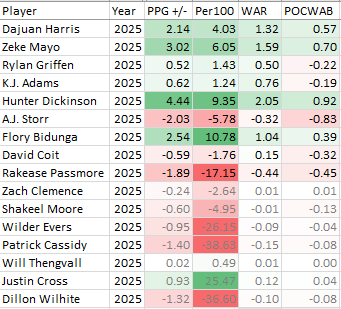
Dajuan Harris YE Actuals: 77.8% Mins, +0.68o, +1.56d, +2.24 PPGAB, +4.01 Per100, 3.55 WAR

Harris outperformed his projections and graded out as KU’s second-best player across the three major value metrics (though he was very close to the 3rd and 4th best players). A polarizing player throughout his time at Kansas, we take the position that he was seriously undervalued as a senior. His defense and ability to generate offense through his assists (while maintaining low turnover marks) boosted the team’s chances.

Further analysis would suggest that Harris was a role player and that his limitations hurt the team more when he wasn’t playing alongside elite wing scorers (i.e. the last two seasons of his Kansas career). But Juan did improve throughout his time at KU, with the largest jump taking place from his sophomore to junior year. Harris will finish his career with the 30th best WAR and 59th best PAB of all 194 players since 1993, marks that might hold up quite well over the next few years given the lack of continuity in today’s game.

Juan’s clutchness was something that critics could rightly point to as a hole in his game. We analyze that although he played well against the better opponents on the roster (+1.99 POCWAB), he made some bad plays in big moments (-0.31 WPA) including a disastrous turnover late in his final collegiate game. In all, the problems with the 2025 team stemmed beyond Harris, and fans who complained mostly about him ignored the fact he was the best (or second-best) member of the 2025 backcourt and would have played serious minutes even if KU had added an elite lead guard.

Hunter Dickinson Projections: 75% Mins, +3.00o, +1.09d, +4.09 PPGAB, +7.80 Per100, 5.67 WAR

Hunter Dickinson YE Actuals: 74.6% Mins, +2.82o, +1.76d, +4.58 PPGAB, +8.85 Per100, 5.80 WAR

Hunter’s marks landed quite close to his projections, with him overperforming on the defensive side of things. Dickinson was always an underrated defender thanks to his rebounding ability and solid interior defense (more often than not), but when he was bad on this end, he was bad. It seems like he wasn’t utilized well, too often hedging up high and struggling to recover on ball-reversal, yet KU was still the 11th-best defense at the end of the year.

Still, Dickinson was KU’s most productive offensive player and had better-than-team-average efficiency marks despite being used so much. He was likely asked to do too much running the offense, again due to KU’s wings never becoming what they needed to be. Hunter’s clutchness graded out positively, he had a POCWAB of +3.95 and WPA of +0.98, but this ignores he saved his worst game of the year for the NCAA Tournament. His career will be remembered for him not scoring in that second-half, giving up too many easy baskets to the opposing big, and a terrible live-ball turnover that turned cut KU’s lead from 3 points to 1.

In only two seasons, Hunt generated the 22nd-most WAR and 20th-most PAB, placing him among the likes of Scot Pollard, Thomas Robinson, Brandon Rush, and Udoka Azubuike. Dickinson was never good enough to fully rely upon to carry a team, but he was also much better for Kansas than his critics admit. Had he played with a deeper backcourt or alongside KU-level wings while at Kansas, his production would have been in service of more wins instead of disappointing losses.

K.J. Adams Projections: 75% Mins, +0.50o, +2.01d, +2.51 PPGAB, +4.78 Per100, 4.05 WAR

K.J. Adams YE Actuals: 67.7% Mins, -0.11o, +2.28d, +2.16 PPGAB, +4.19 Per100, 3.17 WAR

K.J. was KU’s best players over the last 8 games, averaging a PPGAB of +5.72 while producing 7 positive games. Losing him to injury in the last four minutes of the NCAA Tournament game was also a likely factor in KU’s defeat (and would have devastated the team’s chances at a deep run even if they held on).

It wasn’t always a good season for Adams, as the senior struggled for much of the first few months. His low moment was being benched at home against West Virginia and then returning to the game only to blow a crucial layup attempt inside a minute resulting in a surprising loss. Adams was only a +0.50 player during a 9-game stretch in December and January. He then sat out 3 games due to injury, returning to provide solid defense in a home win against Central Florida and then play up-and-down ball until the final 8 games of the season.

Adams’ best game of the year was against Texas Tech. Around this time he started to pick up his scoring with more efficient shooting, finishing with dunks and mid-range floaters and jumpers. Adams’ defense remained solid throughout the year, though he left value on the table due to low rebounding marks.

The final reaction to K.J. was decidedly mixed, with fans chanting for Flory to replace him during turbulent moments. But by season’s end, the consensus was that KU needed K.J.’s hustle and defense. Adams’ value is another “IQ test” which showed the fans knew much less than Self did when it came to who to play. KU’s defense was better with Adams and eventually K.J. started finishing at the rate he needed to.

The Big 3

Per game, the Harris, Adams, Dickinson trio generated 8.73 points against bubble collectively (and this was despite Harris and Adams missing four combined games due to injury). These three played about half the minutes, so if KU would have gotten that same combined contribution from the rest of the roster, it would have graded out as elite (1-seed territory).

Not only was the fan consensus about the big 3 misguided, it was wrong in the worst way possible. Harris and Adams, despite being role players being stretched beyond their limitations at time, provided very solid value for the Jayhawks as seniors.

Further confirmation of this comes from on/off numbers, which show each member of the big 3 as well above the team average…Harris was +11.1 out of 100 possessions, Adams +9.6, and Dickinson +14.1.

A.J. Storr Projections: 65% Mins, +1.10o, +0.52d, +1.62 PPGAB, +3.57 Per100, 2.94 WAR

A.J. Storr YE Actuals: 38.9% Mins, -0.73o, -0.63d, -1.36 PPGAB, -5.04 Per100, -0.58 WAR

It is shocking to say the least that A.J. Storr had as bad of a season as he did. There were questions coming into the season about his defense and overall “fit” on the roster, but the plain truth is that good players eventually add value regardless of the system they are in. Storr was so far below bubble-level that we cannot attribute it to his teammates not getting him involved or him being poorly utilized by the coaches. The bulk of the problem was Storr himself.

When someone has a bad season his clutchness metrics will also be bad, and Storr’s -1.11 POCWAB and -1.85 WPA directly affected the team’s chances of a better season (and seed). Storr’s worst game was against Houston at home when he was tasked with playing a small-ball four and got schooled by the bigger Houston frontline players. This is yet another area where fan sentiment was completely divorced from reality. KU was always better playing a 2-big lineup and when they tried to “go small” it led to poor results. Additionally, needing to play “modern basketball” by going to a four-out system was strongly rebutted in 2025 as all four number one seeds and Final Four teams played big lineups with Florida, Houston, and Auburn each playing two true bigs (only Duke played a versatile 4-man who could handle the ball and truly generate his own shot from the outside, the unicorn and presumptive number one overall pick in Cooper Flagg). Needless to say, for Storr to be a value-adding player he needed to use his quickness to get around slower players and his size to score over smaller ones. He did neither.

It would be remiss to ignore that Storr did have a great NCAA Tournament game, grading out as KU’s most valuable player and showing the talent KU thought they would get all season. It’s tempting to want him to return to see if he could do that all season, but the wiser decision would be to move on. Storr’s floor was very low, and KU thrives with guys who play hard and add value elsewhere even when their shots aren’t falling.

Zeke Mayo Projections: 65% Mins, +1.30o, +0.43d, +1.73 PPGAB, +3.81 Per100, 3.06 WAR

Zeke Mayo YE Actuals: 78.4% Mins, +1.51o, +0.59d, +2.09 PPGAB, +3.84 Per100, 3.48 WAR

Zeke Mayo’s homecoming worked well for KU. Mayo shot the ball well (42.2% from 3), particularly at home though not on the road (but he did hit shots at neutral sites as well). Zeke outdid our projections for him, showing that unlike others he could play within Self’s system and generate value despite “leveling up” to high-major hoops.

Zeke had five games where he was KU’s best (second-most behind Dickinson) and like K.J. Adams was playing his best ball during the closing stretch (+3.45 PPGAB player over the last 8). But despite showing solid play in POCWAB (+1.98), Zeke’s clutchness was really a problem. He had a -1.89 WPA and numerous poor moments late in games that ended in KU losses. Defensively he rebounded well but would give up too many open 3’s by sagging off shooters.

For the season, Mayo played the most minutes of any KU player and his reliability was something that the team needed. Compared to other one-year players in recent seasons, Mayo’s WAR puts him between Joel Embiid and Gradey Dick. His PAB is sandwiched between Malik Newman and Kelly Oubre. Mayo showed he could play at this level.

Rylan Griffen Projections: 60% Mins, +0.25o, +0.15d, +0.40 PPGAB, +0.95 Per100, 1.59 WAR

Rylan Griffen YE Actuals: 48.5% Mins, -1.01o, +0.24d, -0.77 PPGAB, -2.21 Per100, 0.20 WAR

Griffen’s season was probably the second-most disappointing. It certainly wasn’t as bad as Storr’s, but it was still a letdown. Griffen didn’t make shots like he was supposed to. A 39.2% 3-point shooter the season prior, he was 33.6% while at Kansas and made only 2 of his final 16 threes. He was also limited, with his shot creation not being great and his defense being just okay. Rylan needed to make shots to be effective.

Looking at clutchness metrics, Griffen had a -0.90 POCWAB and -1.53 WPA. His clutchest moments were the big shots he hit against Houston and Duke. But he missed too many shots and wasn’t a great defender.

Shakeel Moore Projections: 30% Mins, -0.25o, +0.21d, -0.04 PPGAB, -0.17 Per100, 0.55 WAR

Shakeel Moore YE Actuals: 20.2% Mins, -0.80o, -0.10d, -0.90 PPGAB, -3.78 Per100, -0.13 WAR

Shak Moore didn’t become a critical part of the rotation until he surprisingly started against UCF in early January. Moore would go on to have a number of solid games while KU was in its best stretch of games, helping KU go 5-1 during that part of the season. In fact, Moore is the only Jayhawk outside of the “big 3” to have positive on/off metrics.

Nevertheless, Moore’s play started to deteriorate and this coincided with his recurring foot injury. Shak never could get fully healthy and was only able to play a few minutes in the NCAA Tournament.

Moore’s numbers aren’t what we projected nor are they what a KU-level guard should be, but we suggest this was due more to injury than poor acclimation to Kansas. Shak showed he could contribute when healthy.

David Coit Projections: 11% Mins, +0.25o, -0.11d, +0.14 PPGAB, +1.76 Per100, 0.36 WAR

David Coit YE Actuals: 38.3% Mins, -0.49o, -0.10d, -0.59 PPGAB, -2.20 Per100, 0.16 WAR

The projections missed regarding Coit’s minutes. We just didn’t see where they would come from, not anticipating the poor play of Storr and Griffen or sustained injury to Moore. Additionally, it looked for a time that Zeke could fill in as a back-up point guard, and that never really panned out. So, there were more minutes for Diggy than first thought.

Coit showed he could knock down shots, but he definitely struggled to score over length or draw fouls and get to the line. Therefore, while his 3-point shooting was a very solid 38.7%, his TS of 53.5% was under what it was in prior seasons. He also struggled to add assist value.

In total, Coit’s effort and competitiveness were a welcome sight. His clutchness scores (-0.73 POCWAB and -0.95 WPA) are in keeping with his below-bubble value. You’d have hoped he could have adjusted better to the higher level of competition, but at the end of the day his play was never going to make or break the season.

Flory Bidunga Projections: 15% Mins, -0.25o, +0.34d, +0.09 PPGAB, +0.87 Per100, 0.39 WAR

Flory Bidunga YE Actuals: 40.3% Mins, +0.34o, +0.54d, +0.88 PPGAB, +3.12 Per100, 1.59 WAR

It was clear immediately that Flory was going to play more than projected as he was clearly a preferable option to Zach Clemence. Additionally, KU attempting to play “small” never truly worked out. KU was also able to play him alongside Hunter Dickinson, something that wasn’t anticipated back in October.

As far as player value is concerned, Flory exceeded all expectations, particularly early on. Through 20 games, Flo was a +3.08 PPGAB player (second on the team) with Per100 value rivaling Hunter Dickinson. For whatever reason, he couldn’t maintain this value and really struggled late (-2.87 PPGAB over the last 8). In this sense he was the inverse-Adams. When K.J. was struggling, Flory was playing well. When Adams started to come around late in the season, it felt like it was at the expense of Flory. Now both did play well together the final 10 minutes in the team’s win against Duke, which was of course without Hunter Dickinson.

This may be the best time to speak of KU’s front-court. We’ve spoke of KU’s “big 3” but what about KU’s 3 bigs? Including Clemence’s limited minutes, KU’s frontcourt produced +7.38 points of value per game (the backcourt was at +0.14 per game). KU had a competitive and valuable front line.

As far as the eye test goes, Bidunga’s elite athleticism and potential is exciting. He showed he could produce highlight dunks, elite defensive plays, and versatility thanks to his ability to run and move laterally. He still needs to develop post moves and some strength to be a truly great Kansas big man. Flory’s clutchness was not too shabby. He had a +0.37 POCWAB due to poor moments late in the year, but his WPA was +1.06 and second overall (behind Adams). When he played in big moments, he didn’t shirk away from them and performed admirably.

Rakease Passmore Projections: 14% Mins, -0.25o, -0.03d, -0.28 PPGAB, -2.87 Per100, -0.01 WAR

Rakease Passmore YE Actuals: 8.4% Mins, -0.93o, -0.40d, -1.33 PPGAB, -15.38 Per100, -0.70 WAR

Passmore never got things going. He played in each of KU’s first 9 games (including against UNC, Michigan State, Duke, Creighton, and Missouri) but by this time it was clear he wasn’t ready. While he had the athleticism, his skill level was severely lacking. Frankly I wonder what the staff saw in him.

His Per100 numbers were the worst of any non-walk-on in quite some time if not ever. While he was never supposed to be an important piece to the roster, he gave the team less than nothing in 2025.

Zach Clemence Projections: 10% Mins, -0.15o, -0.10d, -0.25 PPGAB, -3.64 Per100, -0.06 WAR

Zach Clemence YE Actuals: 3.1% Mins, -0.29o, +0.05d, -0.24 PPGAB, -2.63 Per100, 0.00 WAR

Clemence was lost due to injury, and in the brief moments he played he showed some signs of hustle and athleticism but also really struggled to score. Given KU’s solid frontline, he was never going to be someone who played a lot this past season.

Assuming he leaves KU, Clemence never developed into the type of shooter the staff raved about. He went 10-42 from 3 during his time at Kansas, with one of those being a critical 3 that helped KU avoid a home upset during the 2022 season. He is also famous for a 3 he missed, badly, against Wisconsin in 2023 that resulted in a putback buzzer-beater layup by Bobby Pettiford. Speaking of Pettiford, both he and Clemence came in together in the same recruiting class and it looks like neither will finish up at KU or will have anywhere near the collegiate career they were projected to have.

Final Thoughts

The 2025 season was a major disappointment, even more so than the season prior, as it was widely believed that KU had added the right pieces. The AP voters had them at #1 after all.

While fans will no doubt look back and blame some combination of the big 3, what’s truer is that Self and company did awful in the portal. Zeke provided some value, but aside from that the other four pieces they brought in were all below-bubble level. With Coit + Griffen + Moore + Storr playing 29.2% of the collective minutes, this really hurt. The four value-adding starters and Flory just weren’t good enough to overcome such negative play from their teammates.

Additionally, clutchness played a factor far more in 2025 than it did in prior years. More often than not, Kansas is clutch and wins more close games than they should, but at the very least they win their fair share. In 2025, this was not the case. As a team KU lost 3.58 games more than the computers expected them to, costing them at least two spots on the seed line and an easier First Round (and potential Second Round) opponent. This lack of clutch play was evident in the team’s Round of 64 loss as well.

Grading the Committee – 2025 Edition

For last season’s write-up, see here.

The 2025 bracket is out. The Kansas Jayhawks earned a 7-seed, fitting in where most bracketologists had them. Most KU fans are fine with this seed as they believe the Hawks didn’t have a good enough season to deserve to be any higher.

Fans of other teams are not so happy, and there is some controversy about the inclusion of North Carolina in the field (and exclusion of West Virginia).

The committee has the difficult task of selecting 37 at-large teams and seeding 68 teams in a way that is fair and impartial. They have to sort through dozens of resumes in a relatively short period of time and, in the words of one bracketologist, often compare apples to oranges. Teams each have different schedules, records, and strengths that make them difficult to compare. How much importance should be placed on metrics? How much emphasis should be placed on results against the very best (Q1A games) or avoiding big upsets? How should SOS be incorporated?

These questions are all worthy of debate, but what we feel is most important is that, whatever the committee decides is the proper way to weight the data on the team sheets, it is consistent across the field of teams it analyzes. In other words, if the committee is very concerned with a team’s results in Quad 1 games it can’t overlook when a team performed poorly in this area. Or, if metrics are important, they should be applied the same across the board. Rewarding one team for having great computer metrics but not another isn’t fair.

For the 2025 season, we broke down the team sheet into four broad categories which were then quantified so teams could be ranked in each category. We then applied weights to these categories so as to best capture how the committee emphasized the categories. These categories, and corresponding weights, are:

  • Schedule Strength – 2.0%
  • Overall Winning Percentage – 2.2%
  • W-L Results in Quadrants – 40.1%
  • Computer Metrics – 55.7%

More detail on how these weights were arrived at (and other assumptions) will be provided at the end.

In applying the weights this way, we get the closest correlation between how a mathematical model would rank the teams and the final S-curve itself. What we are doing is testing the committee’s consistency.

Last season, the closest correlation we got was an R2 of 0.8793. For 2025, this jumped to 0.9498. Now, this could partially be due to us doing better at applying the formula for finding the proper category weights (the process is a trial-and-error one to find the closest tie between the committee’s S-curve and our own), but suffice to say the committee did better overall in 2025 than it did in 2024.

Still, the 2025 bracket wasn’t without flaws or controversy. We’ll go through the teams most affected.

Memphis

The Tigers were AAC Champs both in the regular season and conference tournament, finishing the season at 29-5 overall and earning a 5-seed. This wouldn’t seem all that surprising, except that the Tigers played the 90th best overall SOS, had 2 Quad 3 losses, and an average computer metric of 37.1. These poor marks tended to bring other teams down (see Drake or UC San Diego), but not Memphis. While the committee had Memphis as the 20th best team on the S-curve, we had them at #31, a difference of 11 spots and the difference between a 5-seed and an 8-seed.

West Virginia

The Mountaineers were the committee’s first team out of the field, ranking #47 on the S-curve. We had them at #36, which would have not only included them in the Big Dance it would have given them the final 9-seed and would have bypassed them from Dayton. They were included in all 111 final brackets on Bracket Matrix. Their exclusion was the biggest shock of the night.

West Virginia didn’t have a single bad loss and finished 10-13 in Q1+Q2 games…which one would think was good enough to make the field. The committee did claim that they dinged WV for not having their best player, but Tucker DeVries was absent for all but 8 games of the season and the Mountaineers had big wins against Iowa State and Kansas without him.

Three Other Under-seeded Teams

Michigan, the Big Ten Tournament champions, was 17 on the S-Curve (5-seed) but had an argument to be #11 and a 3-seed. The Wolverines being placed so low was yet more proof that the committee fails to properly account for conference championship games (particularly those played on Selection Sunday).

Louisville, the ACC Tournament runners-up, is an 8-seed and at #29 on the S-curve. We have them as #23 on the ranking system (6-seed). The Cardinals do get to play in Lexington, however, but their spot in the field is suspiciously poor given their resume. Flipping Louisville with Memphis on the S-curve would substantially improve the consistency of the committee’s ranking.

Utah State is in the field as a 10-seed (#40 on S-curve) but should be a bit higher (#34 in our ranking). No bad losses and won the only Q1A game it played. From a position-in-the-bracket aspect, this may actually be better for the Aggies as the 10-line misses out on playing a 1-seed until the Elite 8 at earliest.

Let’s Talk North Carolina

The Tar Heels made it into March Madness as the last team in the field and will play in Dayton against San Diego State. Their inclusion was derided for a few reasons. One, their 1-12 record in Q1 games was seen as evidence that they are not good enough to beat tournament-quality teams. Two, the committee chair this year was UNC’s athletic director. While by rule he does have to leave the room when his team is being discussed, it’s tough to deny that he still has influence on the process overall. Three, people see this as evidence that name brand matters in selection, and there isn’t any names bigger in college basketball than North Carolina.

As far as committee consistency goes, UNC was our 50th ranked team (46th on the official S-curve). This put them behind not only West Virginia, but also non-Tourney Indiana and Ohio State. It’s really tough to defend UNC’s place in the field if we are being consistent.1

While UNC’s 1-12 record against Q1 opponents is often mentioned, what gets overlooked is its Q3 loss to Stanford in January. Bad losses have held teams out in the past, and this season we found that the committee applied weights to them as well…just not for North Carolina2.

Xavier – Surprisingly Strong

Xavier was another bubble team with poor Q1 results that made it into the field…going 1-9 in Q1 games. The Musketeers got in at #42 (still an 11-seed play-in team). We had them at #46, which is a bit below the committee but still in the field. Xavier was a surprise, but they weren’t necessarily a poor inclusion.

Should be In, Should be Out

West Virginia for North Carolina for reasons already stated. Other than that, the committee didn’t really snub or rescue anyone else (though it did over and under-seed certain teams as we’ve discussed).

Bracket Matrix

There were 225 Final brackets listed on Bracket Matrix, and I’m assuming that these were all published before the field was announced. Using the average ranking and number of brackets a team made it into, simple regression analysis was done to compare the Bracket Matrix ranking (effectively what the consensus S-curve was) to the NCAA’s actual S-curve. This was a correlation of 0.9595. This is slightly more-closely correlated than what we could get our ranking to show.

For that reason, we have no reason to suggest that Bracket Matrix isn’t the best predictor of what the field will end up looking like. Still, for future seasons we will use the team sheet data as an independent predictor of a team’s seed.

The next correlation we ran was between the Bracket Matrix consensus ranking and our own…this was at 0.9741. So, even not fully knowing what the committee would value as the most important criteria, the consensus ranking was more consistent with the ranking than the committee itself.

Some have suggested that the committee, currently made up of athletic directors and conference commissioners, should be replaced with full time bracketologists, with many even wondering how the committee is allowed to have such conflicts of interest.

This struck me as ironic. Historically, the NCAA Tournament selection committee has always been made up of AD’s and conference commissioners, as the institutions and conferences just are what make up the NCAA. As someone has to make decisions as how to best field a tournament, naturally it was determined that a number of members from a variety of schools (both big and small) and conferences (geographically distinct) would be the fairest way.

Back then there were no “bracketologists” nor any advanced metrics that could determine with more precision and accuracy what the “fairest” ranking would look like. The committee tried its best and the tournament was played with little controversy.

It is the popularity of the Tournament and its importance which made making the Field so important, and eventually Joe Lunardi made the discovery that college basketball fans were extremely interested in knowing what the Field might look like before Selection Sunday, becoming the first ever “bracketologist” and starting the trend which has grown to where it is today3.

That’s what’s ironic. A bracketologist is not intended to be someone who selects or ranks the field, he is rather someone who predicts how the committee will select and rank the field. If we remove the committee and replace it with a group of bracketologists, what we would be doing is actually picking a field on how a group of people think a hypothetical committee would pick a field…essentially replacing a substance for an ethereal idea, an object for its shadow. Yet, at least this season, such an exercise would produce a more-consistent bracket.

The S-Curve and Matchups and Conspiracy Theories

The biggest thing the committee does is set the S-curve. In order to get to 68 teams, the committee takes 31 automatic qualifiers and the best 37 at-larges and then ranks them, 1 to 68, to produce a field. The next step, placing the teams in appropriate seeds and match-ups is a relatively quick process. But it is the first aspect that the committee is most concerned with. It doesn’t want to include a team that doesn’t belong or grossly over or under rate someone.

Fans, on the other hand, tend to look at the process the other way. A fairly large portion thinks the committee sets matchups to create storylines, often attributing financial motivation to their decisions. But this just isn’t how the committee operates. The matchups are often an afterthought and are set up normally based on geographic reasons or other bracketing principles, such as conference affiliation. For instance, UConn, an 8-seed, couldn’t have played Creighton, a 9-seed, as both are in the Big East and have played each other multiple times this season. So a bracket that had them in different regionals was the one they made. (Similarly 8-seed Mississippi State had to play 9-seed Creighton or Baylor as the other 9’s are SEC teams).

But one area where the committee does need to focus on matchups, certainly in the eyes of many coaches, is proximity to a pod or regional site for worse-seeded teams. 8-seed Louisville gets to play down the road in Lexington, where should it make it to the Round of 32, would likely face 1-seed Auburn. Wouldn’t it benefit Auburn to play another 8/9 pairing, or at least move the regional somewhere else (such as Wichita)? Maryland fans are upset their 4-seed Terps have to go out to Seattle (where they face a Western team in 13-seed Grand Canyon). Wisconsin is a 3-seed and goes to Denver to face 14-seed Montana and potential 6-seed BYU. Such disadvantages persist for better-seeded teams across tournaments. This is partly due to the NCAA wanting to reduce travel costs and burdens (a noble goal), but if it harms the better seed, how fair is it?

Conclusion

The committee likely did better selecting and seeding the field in 2025 than it did in 2024, but it still wasn’t without flaws. The biggest error was Memphis being a 5-seed when the weighted ranking method concluded they should have been an 8. There was only one real snub/false inclusion this year, with West Virginia being left out for North Carolina.

The consensus bracket on Bracket Matrix was more consistent than the committee itself even using the committee’s implied preferences, and even with a committee that can seem schizophrenic, the final consensus on BM was very predictive of what the field actually was.

  1. Ironically, North Carolina’s ranking in the purest-resume metric, WAB, had them in the field and at a safer #42. So there is justification for North Carolina being included. The problem is that one can make this argument with most bubble teams, simply find the best part of the team’s resume and highlight that. The point is that if the committee shows it considers all aspects of the team sheet (it does) and if we think the committee should be consistent in how it applies this data (we should), then UNC should be out of the field. ↩︎
  2. If we removed UNC’s bad loss to Stanford, this would have bumped the Heels from #50 in our ranking to #46…matching the committee. So, by effectively ignored this Q3 loss, the committee put UNC in the tournament. ↩︎
  3. https://en.wikipedia.org/wiki/Bracketology ↩︎

The Un-Clutch 2025 Jayhawks

Kansas dropped its third home game of the season on Saturday, falling to 19-10 on the season. Of these 10 losses, the team can look back on most of the games and count a number of times it squandered away chances to close out strong and win the game. We will look back at how KU has done down the stretch in its tight games.

DateOpponentTime LeftScoreEnd Result
November 8, 2024vs. North Carolina8:3079-78W, 92-89
November 12, 2024vs. Michigan State8:5052-52W, 77-69
November 26, 2024vs. Duke9:4059-59W, 75-72
December 8, 2024@ Missouri2:2063-65L, 67-76
December 31, 2024vs. West Virginia6:0048-50L, 61-62
January 11, 2025@ Cincinnati7:0038-37W, 54-40
January 25, 2025vs. Houston10:0048-48L, 86-92 2OT
January 28, 2025vs. UCF9:0066-67W, 91-87
February 1, 2025@ Baylor5:0063-61L, 70-81
February 15, 2025@ Utah4:3060-60L, 67-74
March 1, 2025vs. Texas Tech8:2061-60L, 73-78

The above 11 games for Kansas are games in which these two conditions apply:

  • KU is either ahead or behind by 2 points or fewer (or tied).
  • There is fewer than 10 minutes but more than 2 minutes to go in the 2nd half.

While these conditions filter a set of games, we also avoided cherry-picking KU’s best chance of winning, as that would unjustly bias the results. We want to know how KU does “down the stretch” in games it has a realistic chance of either winning or losing. KU has won many games comfortably but has also lost four games in which it never was within reasonable striking distance over the last 10 minutes of play.

At 5-6, KU’s been a bit worse down the stretch than its opponents, but at first glance this doesn’t look terrible. Wins early against Michigan State and Duke are basically the only thing holding its resume together at the moment. But looking more closely at the numbers makes this mediocre record appear much worse. Here are some reasons why.

  • KU was favored in all of the games except Duke. Right off the bat KU should be shooting for something like 8-3 in these games.
  • Many of these losses occurred when KU was in the midst of a comeback run and had momentum. Other teams have responded better to “game pressure.”
  • As the home team, KU is 2-3 in these games. Winning close road games is usually tougher than close home ones, and this team is not taking advantage of Allen Fieldhouse. If it can’t win these games at the Phog, how can it win these games in neutral arenas?
  • KU’s losses have been in a variety of ways…blow late leads with over 99% win probability (Houston), blowing huge leads (Baylor), fighting back and letting a team with its back on the ropes get second chances to counter (West Virginia, Utah, Missouri, Texas Tech), losing by poor shooting (West Virginia), losing by allowing the other team tons of good looks (Texas Tech) losing by getting beat on the glass (Utah), etc. Basically, KU has proven it can lose in about any way there is to lose despite playing well enough (for 80% + of the game) to win these games. If it can lose in about any way possible, this is felt among the team and can trigger further meltdowns.
  • As the season goes on the team has gotten worse in close games. It started out 3-0 in such contests but has lost 7 of its last 9 since.

Clutchness as a forecastable factor is an oft-debated idea in sports, but it can be defined as performing well in high-leverage situations. The closer and later the game is to the finish, the more important each possession becomes. A missed shot with your team down 2 and 1 minute to play is far more weighty than a missed shot with your team down 2 and 39 minutes to play1.

Using the charting system, which assigns comparative value to the player making the determining play of each possession (both offense and defense), we can assign a Win Probability Added % (WPA) to each play, accumulate these plays, and get a clutchness metric for each player on the team.

WPA can be taken from one of three sources (at least): Bart Torvik, ESPN, and KenPom. Each of these websites publishes the chances of winning at each stage of the game. We match these probabilities to the players and get cumulative WPA’s for each game, and in turn for the season.

PlayerCumulative WPA
TEAM – KANSAS JAYHAWKS 2025-2.868
Dajuan Harris-0.286
Zeke Mayo-1.988
Rylan Griffen-1.203
K.J. Adams+0.944
Hunter Dickinson+1.370
A.J. Storr-1.566
Flory Bidunga+1.205
David Coit-0.614
Rakease Passmore-0.227
Zach Clemence+0.126
Shakeel Moore-0.452
Coach Self Technical Fouls-0.178

Given the odds of winning at each tip-off, Kansas as a team has underperformed by nearly 3 wins on the season. This is the biggest indicator that KU hasn’t played well in the clutch. If KU were 22-7 going into the second Houston game it wouldn’t be doing anything special, just winning at the rate a team of its caliber is expected to win, but overall it would be close to where a typical Bill Self-led Jayhawk team is at this point of the season.

Individually, KU is getting clutch play from its interior trio of Dickinson, Bidunga, and Adams. Hunter has been fairly consistent all year, though he does have let down games from time-to-time. Flory was playing elite basketball during the first three months of the season or so but really struggled in February. However, K.J. Adams has had a few excellent games recently to boost his WPA. In fact, Adams’ performance against Texas Tech added a season-high 0.556 wins. KU truly squandered an all-time game from the senior forward.

After this, there is some fall-off. Dajuan Harris is hovering around zero but can’t get over the hump. His defensive lapse and turnover late against Texas Tech cost the Jayhawks a lot of WPA (others also missed shots and didn’t make plays). Combined with other instances (poor defense in Baylor’s comeback, missed FT’s against Houston), it’s been a disappointing year in the clutch for Juan. But he hasn’t been the worst, in fact far from it.

Diggy Coit, Rakease Passmore, and Shak Moore are negative-clutch players but also not the main guys in the game during clutch moments. Passmore has been relegated to the bench and Moore is injured. Coit has played the most in big moments and has had some good games (West Virginia) alongside others where he misses big shots and gets exploited on defense due to his size. But none of these players have been the main problems.

KU’s three biggest transfers–Zeke Mayo, Rylan Griffen, and A.J. Storr–are combining for -4.757 WPA. This is dreadful and the biggest factor as to why KU’s underachieving. It isn’t the “Big 3” returnees, it’s the new guys. Mayo basically lost the Houston game for Kansas (through missed defensive assignments and live-ball turnovers) and he hasn’t been good in other big spots either. Like Mayo, Griffen tends to give up hugely important baskets and his offense hasn’t been consistent enough to make up for these lapses. A.J. Storr is unique in that he’s been bad all-around. Not even needing to play in that many late-game moments, Storr’s poor performance in the first half and other non-clutch moments have hurt the team’s win probabilities throughout the season.

Note that walk-ons haven’t played in any high-leverage situations…they’ve only entered games which have effectively been decided. Self’s technical fouls have cost the team nearly 1/5 of a win. His T at Utah gave up 2 points in what became a close game down the wire, although one might argue it inspired the subsequent comeback.

Concluding Thoughts

The glass half-full approach to this would be that KU is still good enough talent wise to beat good teams and that if it gets the right draw, upsets, etc. in March it could still make a deep run. However, if clutchness is a real factor, then this team seems destined to lose in the cruelest way come the NCAA Tournament.

Update #1 – After Houston Game #2

KU fought hard but fell short of victory in a 59-65 defeat to Houston in the 30th game of the season. KU only had a 12.4% chance of winning at tip, so this loss won’t hurt the team’s clutchness factor that much. Still, it was another game where KU was within a possession of the lead either way in the last 10 minutes yet lost. KU is now 5-7 in such games.

On the season, KU has lost 2.99 games more than expected…in other words the computers think KU should be 22-8 instead of 19-11. Hopefully this “reversion” will occur in the NCAA Tournament and KU can be a “good team that is under-seeded” and take advantage.

PlayerCumulative WPA
TEAM – KU 2025-2.992
Dajuan Harris-0.282
Zeke Mayo-2.092
Rylan Griffen-1.312
K.J. Adams+1.065
Hunter Dickinson+1.408
A.J. Storr-1.599
Flory Bidunga+1.227
David Coit-0.629
Rakease Passmore-0.275
Zach Clemence+0.126
Shakeel Moore-0.452
Bill Self Technical Fouls-0.178

Update #2 – Season’s End

KU had a few more close games to end the season, defeating Arizona on senior night and UCF in the Big 12 Tournament before losing to Arizona (Big 12 Quarterfinals) and Arkansas (First Round of NCAA’s).

PlayerCumulative WPA
TEAM – KANSAS 2025-3.580
Dajuan Harris-0.312
Zeke Mayo-1.890
Rylan Griffen-1.531
K.J. Adams+1.684
Hunter Dickinson+0.983
A.J. Storr-1.850
Flory Bidunga+1.063
David Coit-0.950
Rakease Passmore-0.275
Zach Clemence+0.126
Shakeel Moore-0.450
Self Technicals-0.178

A terrible close to the season saw Hunter Dickinson’s WPA drop to below +1.00. He still finished with positive WPA, but in the biggest game of the season, he had his worst effort. On the flip side, K.J. Adams posted 8 consecutive positive-WPA games to earn the team honors as the clutchest player on the year. When he went down with KU up 3 late in the NCAA Tournament game, his team melted without him on the floor. Dajuan Harris had negative WPA as well, though not as bad as the newcomers. Though as with Hunter, his mistakes down the stretch in the NCAA Tournament game were more costly.

KU finished 21-13 but “should” have won 24 to 25 games in that span. The lack of clutch play and player development hurt this team’s chances at making a deep run.

  1. Hunter Dickinson’s missed FG attempts with KU down 3 and about a minute left against Tech took KU’s WPA down 11.9%. A miss in the first half only cost KU 2.3% WPA. ↩︎

Value Splits Tell Different Stories Than the Consensus

The above X post was chosen as a fairly representative reflection of KU fans’ thoughts on the state of the 2025 team (as well as the two prior seasons). Although the sentiment is put in different ways, whenever Kansas has struggled or failed to achieve a certain level of success in recent seasons, a large swath of the fanbase has been quick to criticize or blame Dajuan Harris and/or K.J. Adams.

Frankly Jayhawk Takeover’s post is mild compared to others. His criticism is a bit more indirect as well, putting the blame more on Self than Harris/Adams, whom he doesn’t even name. But while he’s entitled to his opinion, his sentiment couldn’t be more wrong. Both Harris and Adams have been key pieces over the last few seasons. Adams was the third-best Jayhawk (marginally below McCullar and Dickinson) in 2024 and Harris has been KU’s third-best player (or second-best if looking at total value given his durability) in 2025. Both were also value-adding starters on a 2023 team which earned a 1-seed despite almost no quality depth.

Sometimes KU’s three main returnees (Harris, Adams, and Dickinson) are derided online as the “big 3,” with the sentiment being that as long as these guys are in Lawrence, KU cannot have success, or that Self is unjustifiably relying on their contributions while not playing others who could do better. While lumping in different players and treating them as equally important to team success isn’t normally justified, since fans often look at certain players this way, we felt it insightful to do so utilizing value metrics as we compare groups of players to each other.

Thus begins our look into player value splits. These splits will tell a much different narrative than the one commonly assumed by the vocal majority of Jayhawk fans. Each split first divides the roster into different groups so we can blindly compare value metrics. This should strip the bias, “eye test,” etc. and get a purely objective look at value estimates.

Note: The value metrics presented below are through 24 games in KU’s 2025 season.

Split # 1

Group 143.5% minutes played+8.57 cumulative PPGAB
Group 245.7% minutes played-0.27 cumulative PPGAB
Group 39.9% minutes played+1.25 cumulative PPGAB

Which of these groups looks to be the best? Group 1 accounts for nearly half of minutes played, yet generates 8.57 points of value above a bubble-team. Group 2 plays a bit more but is essentially a bubble-team, losing 0.27 points to this benchmark. Group 3 has a limited impact in terms of minutes but is adding a bit of value.

If we looked at the team in this way, no one would be criticizing Group 1 as a collective, but Group 2 would face a ton of heat for holding the team back. One cannot say that the players who make up Group 2 aren’t getting enough playing time as a whole, either. Group 2 has played slightly more minutes than Group 1.

Group Reveal:

  • Group 1 – Returning Veterans (Harris, Adams, Dickinson, Clemence)
  • Group 2 – Incoming Transfers (Mayo, Griffen, Storr, Coit, Moore)
  • Group 3 – True Freshmen (Bidunga, Passmore)

Since Clemence hasn’t played much this season due to his backup role and injury, Group 1 is for all intents and purposes the “Big 3.” To spell this out further, the “Big 3” are collectively adding over 8.5 points to KU’s skill level when compared to a bubble-team1. The incoming transfers have been reduced to a collective bubble-level output. It’s tough to see how anyone with eyes would blame the returnees as a group (or even individually) more than those incoming transfers who’ve struggled. For Group 3, we see a freshman having an excellent season (Bidunga) and one having a terrible one (Passmore). Freshmen are usually judged less-harshly, as they don’t have the same experience as returnees. Yet KU is getting more from Bidunga than any of the five veteran newcomers.

Split # 2

Group 162.6% minutes played+1.28 cumulative PPGAB
Group 236.5% minutes played+8.27 cumulative PPGAB

Once again, we see a clear favorite emerge. Group 1 is slightly ahead of bubble-level value, but it is Group 2 which is producing the bulk of the value for the 2025 Kansas Jayhawks.

Group 1 is the perimeter players, the guards and wings. It includes Harris, Mayo, Griffen, Storr, Coit, Passmore, and Moore. Group 2 is the interior players, that is Adams, Dickinson, Bidunga, and Clemence.

This split is stark, yet how often do we hear praise lauded on the posts specifically or specific criticism about the backcourt collective? It’s just odd how certain narratives take root while others are not discussed. Now, it wouldn’t be right to be overly critical of Zeke Mayo (who has been solid) just because he’s in the backcourt, but as far as narratives go, that’s exactly what the harsher critics of Harris, Adams, or Dickinson are doing.

Split #3

Player 174.1% minutes+9.55 PP100AB
Player 240.6% minutes+7.90 PP100AB
Player 375.4% minutes+4.84 PP100AB
Player 477.9% minutes+3.53 PP100AB
Player 563.4% minutes+2.85 PP100AB
Player 646.7% minutes+0.45 PP100AB
Player 737.5% minutes-1.98 PP100AB
Player 84.3% minutes-2.57 PP100AB
Player 941.1% minutes-3.63 PP100AB
Player 1025.4% minutes-4.40 PP100AB
Player 118.8% minutes-15.90 PP100AB

These players could be ascertained by simply looking at the minutes played distribution, but without names attached, one would normally want to play those at the top more than those at the bottom. For instance, Player 2 seems like he should be playing more. From there, the minutes distribution looks reasonable, with Players 9 and 10 looking like they haven’t earned a spot in the rotation at the moment. In addition, one would assume that the ire from the fanbase would be due to the play of Players toward the bottom half (starting around player 6 or 7 and on down) while praising those toward the top. Let’s look at the same list, with names included this time.

Hunter Dickinson74.1% minutes+9.55 PP100AB
Flory Bidunga40.6% minutes+7.90 PP100AB
Dajuan Harris75.4% minutes+4.84 PP100AB
Zeke Mayo77.9% minutes+3.53 PP100AB
K.J. Adams63.4% minutes+2.85 PP100AB
Rylan Griffen46.7% minutes+0.45 PP100AB
David Coit37.5% minutes-1.98 PP100AB
Zach Clemence4.3% minutes-2.57 PP100AB
A.J. Storr41.1% minutes-3.63 PP100AB
Shakeel Moore25.4% minutes-4.40 PP100AB
Rakease Passmore8.8% minutes-15.90 PP100AB

Let’s reexamine the list now that we have names listed. The top five players include each of the “Big 3,” with Hunter Dickinson grading out as KU’s best overall player and Dajuan Harris besting everyone on roster who plays on the perimeter. Even Adams, who has struggled to finish this season, is comfortably adding above-bubble value.

Conversely, Bidunga has earned more minutes than he’s gotten this season. We’ll discuss his role later, and the role of the bigs in a bit. Given that KU wants to play 3 perimeter players alongside 2 bigs, it needs to find minutes for someone beside Harris/Mayo. Griffen has gotten the starting nod of late, and for good reason as he’s the best of the rest so to speak. But even Rylan has been inconsistent, and his value is just marginally above that of a bubble-level player.

From here, we’ve seen some bright spots from Diggy Coit and fewer good moments from A.J. Storr, Shak Moore, and Rakease Passmore. From this list, it’s tough to suggest that any of these sub-bubble guys playing more minutes would help the team.

Now onto the interior rotation. Perhaps the only thing the consensus view from fans is getting right is that Flory Bidunga has shown himself to be valuable and should get more minutes. One can excuse him not being used by Self as much early in the season when he was yet unproven, but after filling in nicely for Hunter (when he was ejected the final 10 minutes against Duke) and K.J. (when he was injured in late January), he’s proven himself to be a serious force. In fact, Flory was KU’s best player in K.J.’s absence, adding 7.78 PPGAB of value while playing more minutes than he normally does (about 70% of possible minutes in Adams’ absence).

This isn’t to knock K.J., which is what people often do when looking at the rotation. Adams has been the better player since his return (Flory has really struggled in the last few outings), muddying the debate even further. Some are blaming Adams for the recent poor play of Flory (an asinine suggestion which is so dumb it becomes impossible to refute—as once Flory begins to play well again no one will start crediting K.J. for Flory’s re-emergence but use it as further evidence that Flory should play while K.J. sits), but it’s clear that like any freshman, Bidunga is going to have off nights. Still, we’re left with the question. How should Self best utilize the front court rotation to ensure the best possible chance for his team to win games?

With 80 minutes to use (40 minutes among 2 spots), the 3 bigs should average 26.7 minutes. We’d argue giving Hunter the most (close to 30-32), Flory a bit less (25-27), and K.J. the remainder (22-24) seems ideal. However, these are just ranges that don’t take into account opponent quality, opponent style, foul trouble, and which player is playing the best that game. Self has to use his judgment and the feel of the game to determine how KU best matches up.

As discussed in Split #2, KU’s frontcourt is carrying it this season. Any combination of Adams/Dickinson/Bidunga has been value-adding while KU plays poorly when it tries to “go small” and play with four guards/wings around a single big. That’s the biggest indictment on the fans and conventional wisdom. Flory’s emergence as a possible starter alongside Dickinson wasn’t suggested by anyone until it was discovered in the second half of the West Virginia game when Adams (and Storr, Griffen, etc.) was benched for poor play. Although both Dickinson and Bidunga are centers, KU was able to defend and score adequately to narrow the deficit and get the Hawks back in the game. Simply put, crafting a rotation that fulfills some secondary concern (like “spacing”) matters less than playing the best talent. While position and complementary pieces still matter in a rotation, coaches have some flexibility. Small lineups work, provided the guards are skilled scorers who can hit open shots and put pressure on bigger opponents (i.e. to force turnovers). Two-big lineups can also work, provided the posts are active on the glass and take advantage of their size. For KU in 2025, the skill is clearly in the front court so as many minutes as can reasonably be had by 2 of Adams/Dickinson/Bidunga is going to be what is best for the team.

If it were up to some fans, KU would go small more for “spacing” and to “get Storr going.” But Storr, like Griffen or others on the wing, has had plenty of opportunities to get going. He just hasn’t played well. Some have blamed this on not enough playing time, but Flory Bidunga proves a player can produce with limited minutes. Flory has played fewer minutes than A.J. has this season, yet he is putting up a season that would rank in the 90th percentile of all seasons put up by KU rotation pieces since 1993, while Storr is currently below Nick Timberlake’s 2024 performance and sits in the 13th percentile to this point of the season.

If we look beyond minutes played, the myth Storr has had limited opportunities becomes stranger to suggest. Storr is putting up shots when he plays; he’s not being hidden. According to KenPom he is third on the team in shot percentage (24.6%), far in front of players like Dajuan Harris (17.1%) or K.J. Adams (14.8%). These numbers also support the idea that Harris’ and Adams’ value comes from intangibles and not from scoring…that Harris and Adams are “role players.” Storr has not produced winning moments for KU this season, and in two of KU’s losses, Storr’s negative-value efforts surpassed the team’s final margin of defeat.

If fans take to social media in order to express frustration, they should do so with a modicum of basketball IQ and blame the players who are underperforming.

Split #4

Player 1+1.346 WPA
Player 2+1.207 WPA
Player 3+0.518 WPA
Player 4+0.126 WPA
Player 5-0.106 WPA
Player 6-0.198 WPA
Player 7-0.225 WPA
Player 8-0.413 WPA
Player 9-0.730 WPA
Player 10-1.412 WPA
Player 11-1.503 WPA

WPA, or Win Probability added, is calculated by looking at each play made during the game and assigning the relative win percentage difference to the player responsible for that play. WPA is adjusted to not overweight the importance of defensive rebounds (they are important but defensive stops aren’t entirely due to the player who gets the ball after a missed shot). For the season, KU has a -1.214 WPA, meaning the Jayhawks have lost 1.214 more games than they were expected to. To be sure, KU has been mostly un-clutch this season2.

These calculations provide another look at player value, in that we can see who is performing in the higher-leverage situations. Players who dominate the easier opponents but struggle against good teams in key spots might be fooling us with elevated value scores. WPA provides a different look.

At the top we have the following four players with positive WPA. Note a commonality?

  • Dickinson: +1.346
  • Bidunga: +1.207
  • Adams: +0.518
  • Clemence: +0.126

Again, we decreased the importance of defensive rebounds and played around with this metric, so this is not due to positional advantages per se. KU’s most clutch players are its post players. While this probably doesn’t bode well for March, when it is rumored that guards carry teams, this blame should be on the shoulders of the underperforming backcourt than the frontcourt. Has a single fan produced the narrative that the backcourt is the reason KU will struggle to win, while simultaneously defending the efforts of the bigs? Yet, consistently, we see that the 2025 Jayhawk frontcourt has out-produced the backcourt on a variety of value-metrics.

When we get to the rest of the list, keep in mind that more high-leverage opportunities equate to a higher likelihood of a WPA further away from 0. The rest of the list is as follows.

  • Harris: -0.106
  • Coit: -0.198
  • Passmore: -0.225
  • Moore: -0.413
  • Griffen: -0.730
  • Storr: -1.142
  • Mayo: -1.503

For all the hate Juan gets, he’s been KU’s best backcourt option in not only PAB but also the clutchness factor of WPA. Contrast Juan with Zeke. Zeke’s play against Houston cost him an astounding 0.849 WPA, but even aside from his choke job against the Cougars he’s not been good against the better opponents or in many key situations. Zeke was also bad in the losses to Missouri, Iowa State, Baylor, and Kansas State. Now, we don’t want to overstate this. Mayo is also needing to do more than he should given the weakness of the team’s other wing scorers. He’s been a reliable piece on the whole. His play in key situations has to improve if KU’s going to make a deep run this March. But it hasn’t only been Zeke. Both Rylan Griffen and A.J. Storr, though they’ve been in fewer high-leverage situations than Mayo, have produced significant negative-WPA seasons. Not a single one of the 3 most-important transfer additions has been the slightest-bit clutch for KU. If we broke it down by the “Big 3” returnees (Harris, Adams, and Dickinson) and the “Big 3” transfers (Mayo, Griffen, and Storr), we’d show that the Big 3 returnees are collectively adding 1.757 wins while the Big 3 returnees are collectively losing 3.375 wins to what this KU team is expected to have on the season.3

In closing, Harris and Adams (and Dickinson) have done well enough to be seen as positive pieces to the 2025 KU team. While Bidunga has outplayed Adams on the whole, this hasn’t been the case in 3 of the last 4 recent games. Nevertheless, KU’s front-court is best with all 3 bigs rotating among 2 spots, and it is certainly better than the backcourt. Blaming K.J. for imperfection is missing the forest for the trees. Harris is KU’s best guard, something no one acknowledges.4 It is hardly his fault KU has failed to recruit or bring in talented transfer options to supplement his role. The sooner fans realize this, the better they can get closure with whatever happens for this team the rest of the way.

Addendum: 2024 Splits

Big 3 (Harris, Adams, Dickinson)50.0% minutes played+6.11 cumulative PPGAB
All Others in Rotation48.6% minutes played-1.69 cumulative PPGAB

Looking back to 2024, we see that the trio collective of Harris, Adams, and Dickinson was worth over 6 points per game of value compared to bubble, while the remaining scholarship pieces were well-below that level of performance. In 2024, Harris struggled while Adams played much better than he has in 2025, but the idea is the same. The “Big 3” as a group were getting KU on its way to 1-seed possibilities, but the team was held back by the sub-bubble play of the others.

Of course it would be wrong to not mention that Kevin McCullar, though not part of the Big 3 of the 2025 roster, was very much a member of this group for the 2024 team. McCullar was KU’s best player on a Per 100 possession basis (+6.73) and was worth +3.98 points per game in the games he was healthy enough to play. It was the combined efforts of the others that were a disaster.

For that reason, it’s tough to listen to critics who place heavy blame on any of Harris/Adams/Dickinson for the team’s record the past two seasons. KU would have missed the tournament last season without them, and they would be a bubble-team this year without the trio. While its true that each has limitations and there are valid critiques to each player’s overall game, the fanbase’s level of hate for Harris, Adams, and/or Dickinson is way too extreme. There’s no proportionality when comparing them to the rest of the roster.5

  1. In other words, a team that has all bubble players + Harris/Adams/Dickinson would be favored by about 8.5 against a bubble team on a neutral floor. For reference a 1-seed is typically about 12 points better than a bubble team. The “Big 3” get KU over 70% of the way to 1-seed status, or about to 3-seed/4-seed status alone. ↩︎
  2. Close losses include West Virginia, Houston, and the Baylor debacle. KU has won some close games early (North Carolina, Duke) but on the whole isn’t getting the best record given its skill-level. This can be looked at one of two ways. The pessimistic view is that KU cannot close against good teams and is destined for an early exist in the NCAA’s. The optimistic view is that KU is good enough to beat anyone and that their poor play in clutch situations is mostly “bad luck” that can be remedied. ↩︎
  3. This doesn’t change much if you play with the relative value of a defensive rebound. It isn’t like WPA is overweighing Dickinson’s importance due to his defensive rebounding prowess. He’s just been more clutch than the others, with Mayo being most-unreliable in big moments. ↩︎
  4. Almost no one acknowledges that Harris has been one of KU’s 2 best backcourt players either. We’d grant the possibility that Zeke is more important than Juan (Mayo is a better scorer to be sure), but after that there is a wide gap between Harris/Mayo and the rest of the backcourt. Yet it is Juan who gets the lion’s share of the blame. How absurd! ↩︎
  5. In 2023, Harris + Adams combined for 2.56 PPGAB while the rest of the roster was at +4.35. When we adjust for minutes played, Harris + Adams as a duo were better than the combined efforts of the other rotation players. At no point in the last 3 seasons has it been statistically acceptable to place the majority of the blame on them for the team’s struggles. ↩︎

NFL Franchise Rankings in the Super Bowl Era

Franchise rankings are determined by allocating 100 points for the Super Bowl winner that season and then half as much for teams making it as far as the prior round. Therefore, the Super Bowl Runner-up gets 50 points, the Conference Championship losers 25 points, the Divisional losers 12.5 points, and finally the Wild-Card losers 6.25 points. The final column sets the top franchise to 1 and then rates the other franchises in terms of a portion of #1.

Additionally, the list shows the total appearances per round, including appearances even if that round hadn’t been devised yet. For instance, the Wild-Card round didn’t exist until the 70’s, but if a team made the Super Bowl in say, the 1960’s, it would show up as a Wild-Card appearance in the above table (as well as the Divisional and Conference rounds). Or, for teams that receive a bye past the Wild-Card into the Divisional, they still show up as having reached the Wild-Card round that season. That Wild-Card column can also be understood as a showing of a franchise’s total number of playoff appearances.

There are 32 current and total NFL franchises in the 59-year Super Bowl era. There have been a number of name changes, so the current franchise name and colors are listed in the table above. The Baltimore Ravens are treated like an expansion team (instead of the continuation of the old Cleveland Browns) following official NFL record keeping.

To compare franchises, divide one franchise into another. For instance, the #3 Dallas Cowboys (0.988) have a franchise that is 1.36 x that of the #5 Kansas Chiefs (0.725). Inversely, the Chiefs are 0.73 that of the Cowboys (divide 0.725 into 0.988). Speaking of the Chiefs, they were 0.311 of the top franchise and ranked in the middle at #16 before Mahomes became the starter in the 2018 season. They still have a bit of a gap to #4 San Francisco, but they have surpassed Green Bay thanks as they share Super Bowl titles with the Packers but have more appearances.

Despite having never won a Super Bowl, Minnesota (0.532) can boast a storied history of playoff appearances and NFC Championships. Minnesota grades out as a 2.33 x franchise compared to the New Orleans Saints (0.228), the worst franchise which has won the Super Bowl.

The franchise with the most playoff appearances is the Dallas Cowboys with 36. They also have the most Divisional appearances at 29. San Francisco has made 19 Conference championship games, and the New England Patriots have been to 11 Super Bowls, which is the most. New England and Pittsburgh share the record of 6 Super Bowls, and the Steelers edge out the Pats in terms of which franchise can claim being the best over the past 59 seasons.

Tom Brady, whose career lasted 23 seasons for the Patriots and Buccaneers, has contributed to 1,019 points or 0.953 of the entire 59-year history of #1 Pittsburgh Steelers. If we exclude franchises he played for (as his numbers are included in their totals), the only other franchises which have a better history than Tom Brady are Dallas and San Francisco. Patrick Mahomes, to his credit, is already at 0.421 for his career (putting him in front of the bottom 17 franchises)1.

  1. This counts only Mahomes as a starter. His rookie season (in which his team lost in a Wild-Card game) is not counted as he did not appear in the postseason. ↩︎

Dajuan Harris’s Value in Context

Published 1/31/2025

Not many more players in the history of Kansas basketball have been as polarizing as Dajuan Harris and K.J. Adams. Both have been starters on the three most-recent KU teams and both are seen as being responsible for the success or lack thereof since 2023.1

We’ll table the contributions of K.J. Adams for now, and focus on Dajuan Harris, particularly his play this current season. A common refrain from many is that Harris is not good enough to be KU’s starting point guard, or he should play limited minutes, or even that the team would be better starting someone else (like Shak Moore). With Harris’ injury and a DNP, we got a glimpse of the post-Dajuan era, and it wasn’t pretty. Kansas nearly lost to a middle-of-the-pack conference team at home. Ironically enough, it was the defensive plays and free throws of K.J. Adams which helped seal the win.

Nevertheless, we’ve wanted to compare the play of Dajuan Harris to others for some time, as a way to contextualize the discussions around the only Jayhawk to have played the last five seasons at KU. Specifically, we were most concerned with this season. Harris in 2021 was not good, and even in 2022 he was the weakest link of the starting rotation by far. No one is denying this. Furthermore, the biggest critiques currently Harris faces is from his play this season, and they really aren’t warranted.

Harris Compared to Players in Kansas’ History

First, we will compare how Harris stacks up to others in Kansas history using the fullest statistical data we have, which is defensive charting and the PPGAB/Per100AB calculations. With video available in KU seasons from 1993-2025 (albeit not complete), we have a good idea as to the contributions of the 194 players who’ve played for Kansas over that time. In these 33 seasons there’ve been 321 player-seasons with at least 10% of minutes played, indicating we have plenty of KU players over the years to compare Dajuan Harris to.

How does he stack up? Using a combination of the 3 main value metrics—PPGAB, Per100AB, and WAR—we place 2025 Dajuan Harris in the 66.3%ile, or #102 out of 321. If we just look at PG seasons since 1993, this places him at #18 out of 63, two spots behind his solid 2023 season. This is about in the middle of all PG starters since ’93 (#18 with 33 seasons played).2 Harris’s Per100 metric, which is minutes-neutral, places him in the 70.8%ile, right next to 1993 Adonis Jordan and 2004 Keith Langford.

There might be some room for critiquing Juan’s play over the course of last season (he was at the 34.4%ile) and certainly his play as an underclassman was subpar. But it’s a mystery why he gets so much heat in a year where he’s been better than the other options in the backcourt. Let’s compare the 2025 perimeter rotation next.

Harris Compared to 2025 KU Guards

Through 20 games, Harris edges out Zeke Mayo as KU’s most-valuable perimeter player this season. This might be partly due to timing, as Mayo had his worst game of the season against Houston. So come season’s end, maybe it will be Mayo then Harris. Either way, Harris is clearly more valuable than the other options. Let’s compare the team’s 7 perimeter rotation players in terms of minutes-neutral Per100AB:

  • Harris +4.35
  • Mayo +3.90
  • Griffen +1.60
  • Coit -1.82
  • Moore -2.47
  • Storr -4.24
  • Passmore -15.66

Harris’ would-be replacements, Coit and Moore, have struggled more often than Juan has this season. Why would KU want to give up 6 to 7 points per 100 possessions by leaving Harris out of the game longer than Juan needs for his normal in-game breaks, occasional foul trouble, etc.? Perhaps during games where Moore or Coit is playing well and Harris is not you might see diminished minutes for Harris so the hot hand can continue playing, but the general trend of the rotation should be for Juan to get the most minutes.

Harris Compared to Big 12 Guards

The last response of Juan’s critics normally accepts that Harris is KU’s best option as point guard this year, but pivots and says this is due to poor recruiting at the guard position. We’ll let the reader judge for himself how good KU’s recruiting has been, but we can judge this idea in terms of how Harris stacks up to other guards in the Big 12. If Harris is in the middle-of-the-pack or below compared to the other Big 12 guards, this would be a problem for a team which wants to win the league and get a high seed in March. Ultimately, for KU to win as a team it needs its players to win their individual match-ups. If Harris is not doing this at a high-enough rate, it means the other positions have to pick up the slack if KU is going to reach its regular season goals heading into March Madness.

Unfortunately, we do not have charted stats for the other 15 Big 12 teams. We can’t fully say how good a different player’s defensive coverage is, or how much more value a player’s shot-creation is adding or subtracting. Therefore, we need to use a different set of statistical information. This won’t be as robust or accurate as the charting process, but it is the best we have when comparing players on other teams. We will use 3 sources and a total of 5 metrics to analyze and rank the Big 12 guards through the end of January, 2025.

First, we will use Bart Torvik. We will use Torvik’s algorithm to generate the list of Big 12 point and combo guards. Setting the limit to all players who’ve played 25%+ minutes, and filtering to include only the “pure point guards,” “scoring point guards” and “combo guards,” we get a population of 48 guards. This works out to an average of 3 per team, which is fitting as it aligns with the common practice of having three ball-handlers rotate at the 1 and 2 positions throughout the game.

Now that we have the list of 48 Big 12 ball-handling guards, we will use Torvik’s (offensive) value score, PRPG! as well as his defensive PRPG! metric. Combining these two numbers gets us a total PRPG! estimate, which serves as Torvik’s estimate to the relative value of a player. Total PRPG! is our first metric.

We will also use Torvik’s calculation of Box Plus-Minus (BPM). BPM is an older value metric than PRPG! and can be calculated a bit differently depending on the source. BPM is probably the most similar to CtH’s PPGAB or Per100AB, just with less information than what we gather. BPM is our second metric.

The third metric is taken from Evan Miyakawa. It is BPR, or Bayesian Performance Rating. This rating utilizes On/Off +/- data to estimate a player’s value. While we have our own concerns with how “noisy” (and accurate) this data is, its value is that it is conceptually different from other value metrics. Also, it should in theory provide more insight to defense.

The fourth metric is College Basketball Reference’s Win Share/40. While Torvik’s PRPG! is a per game metric, WS/40 is minutes-neutral. We don’t want to overly bias players who play large minutes against those who play fewer.

The fifth metric is CBB Ref’s PER, Player Efficiency Rating. This rating is offense-heavy, and if anything is done to hedge. We don’t want to bias anything toward Harris, and by including PER we are doing the opposite.

These five metrics are recorded for each Big 12 guard, and then normalized to find a mean and standard deviation among the population. From here, corresponding z-scores are calculated for each category.

Next, we average the z-scores among these categories to find an average z-score and then find the associated percentile to make the ranking more intuitive.

This exercise places Dajuan Harris as the 9th best 1-or-2 guard in the Big 12, at the 78.5%ile and ahead of anyone else on 11 of the other 15 Big 12 teams. We’ll grant that both Houston and Iowa State have better backcourts, but Harris would objectively start on 14 of the 16 Big 12 teams this season.

If the critic’s point was simply that Harris is not elite, no one would disagree, but Harris is viewed much more negatively than that. And for no reason. It’s factually wrong that Harris in 2025 is not a good college basketball player at the high-major level.

2/14/2025 Update – Juan up to #5 among Big 12 PG/CG’s

Through 24 games, Dajuan Harris is now grading out as the 5th best B12 PG/CG. There are 42 such players with at least 25% minutes played for their teams, with Harris in the 80.6th%ile among his B12 peers. He’s now grading slightly better than the Iowa State guards (Lipsey, Gilbert), which shouldn’t surprise anyone who saw the KU/ISU matchup in Lawrence.

Note that there are some B12 guards classified as “wings” which aren’t included, with some having classifications changed with more games being played. It’s unlikely that including these players would change the calculation much (some would grade better than Harris, but most would be below him). Either way, for Harris to be in the 80th percentile of ball-handling guards in the B12 shows he has value. When comparing Juan to his Kansas counterparts-Shakeel Moore (33.5th percentile) and David Coit (27.0th percentile), it puts into perspective that KU is better with Harris in the game.

  1. While not the point of this blogpost, Harris and Adams were starters on a 2023 team which won the Big 12 and earned a 1-seed. Sure, they lost in the Round of 32 (by 1, without Bill Self). They were also starters on a 2024 team that, despite its flaws, was a 4-seed despite losing its best wing scorer in Kevin McCullar. Now the Round of 32 is, by definition, a disappointment for a program at KU’s level, but it’s not like the Harris/Adams era is colored by missed tournaments or even bubble-teams. When viewed in the context of the overall landscape of college basketball, KU’s been quite good the last couple seasons. There needs to be more common sense in assessing the state of the program. ↩︎
  2. We haven’t adjusted WAR, which accumulates over a season, so it is more likely than not that Harris’s 2025 season relative to KU history improves rather than declines. ↩︎

What will 2025 bring?

The 2025 Kansas Jayhawks enter the New Year after falling in their conference opener (for the first time in over 3 decades), and are now 9-3 (0-1) on the season. This year’s team has had some good wins, but it has also had some bad losses. With the majority of conference play still to come, let’s recap the season so far and look ahead to what might be.

Season So Far – Player Breakdown

After deriving an estimated level of value in terms of points against a “bubble-level” player or a replacement player, there are four different ways to assess player value. The first, or PPGAB +/-, rates a player’s contribution in terms of points per game above or below an average player on a bubble-team. Generally, KU rotation level players should strive to be above 0.00, and the average number of positive-bubble players KU has in a season has been 6.1 since 19931. This year, with Harris, Mayo, Griffen, Adams, Dickinson, and Bidunga; KU is right at its average.

Hunter Dickinson, at +4.44 per game, is having the 24th best PPGAB +/- season in the last 33 seasons of Kansas basketball. This is the 94.8%ile of all player-seasons. He’s nearly a full point-per-game better than his 2024 campaign (+3.46), with this being due to better defense (his offense has actually declined). He’s averaging 15.1 and 10.4 per game on 27.7 minutes a contest. He leads in blocks, is second in steals, and third in assists. Dickinson’s Per 100 is second on the team behind Bidunga (more on him later), and is currently at the 94.0%ile of all KU players since ’93 who’ve qualified2. Hunt’s minutes are down some this season, which is good, but we’ll see if he is asked to play more now that conference play has commenced. Hunter is adding 2.05 WAR, again leading the team. Similarly, his POCWAB is +0.92, leading the team in this metric as well. Simply put, Hunter is better than most of the bigs he faces on the block and cleans up defensive possessions well with boards. He does get hurt when teams make him guard the ball-screen and can fluster him at times when he’s on offense. But he’s the fourth-best player on KenPom for a reason, folks3.

Zeke Mayo, at +3.02 per game, is KU’s hottest player, averaging 26 PPG over his last 3 games. Zeke puts to bed the lie that it is impossible to adjust to a higher level of competition or that Self’s system isn’t conducive to transfer-ins. He’s been tremendous, and is adding value above-bubble on both ends of the floor. Mayo’s Per 100 value puts him at the 81.3%ile among KU players, very close to senior-year Steve Woodberry (1994). Mayo also doesn’t have a real weakness. He’s not a lock-down defender nor excellent ball-handler, but he can cover his man and handle it full-court in limited stretches. Expect him to continue to get big minutes.

Flory Bidunga is a +2.54 per game player despite playing only 12.6 minutes per game. Such high value in such limited playing time has skyrocketed the true freshman to the upper echelon of the Per 100 list. Bidunga’s value per possession is the 11th best since ’93 (96.7%ile), among other elite interior players like 2009 Cole Aldrich and 2012 Thomas Robinson. Will Flo keep up such play if he gets more playing time, something that seems to be on the way? We shall see. But he has been a bright spot thanks to his hustle, rebounding, elite finishing ability at the rim, and overall feel for the game.

Dajuan Harris is having an underrated season, generating +2.14 PPGAB and +4.03 Per 100. He’s in-between sophomore year Jacque Vaughn (1995) and senior year Adonis Jordan (1993) at the moment. Given the criticism of Juan, one would think he was having a terrible year. Harris’s WAR and POCWAB is 3rd on the team, outranking Flory due to Harris having more minutes played and more clutch moments against the better teams. One concern is that Harris is playing worse of late–only +0.54 per game over his past 5 games–but trends come and go throughout the course of any season.

There’s a noticeable decline following these top four players. K.J. Adams is technically an above-bubble player on the season, with a +0.62 PPGAB score and +1.24 Per 100. His corresponding WAR of +0.76 is also okay, and would be over +2.25 if the season extended to the average 36 games this year. But, Adams has a negative POCWAB, which shows he hasn’t been clutch against the tougher opponents on the whole.4 This was exacerbated by a season-low -7.59 game-score against West Virginia in a 1-point loss.

Rylan Griffen has been similar to K.J. on a value-scale. He’s at +0.52 PPGAB and +1.43 Per 100 in fewer minutes than Adams, making his WAR a bit less. Griffen is also below 0 on POCWAB, with poor outings against N.C. State and West Virginia being the major culprits5. Much has been made about his struggles shooting the ball, but his 56.0% true shooting isn’t bad. But he’s not a high margin scorer, nor does he create many opportunities for others.

David Coit has been KU’s best player not in the green, with a -0.59 PPGAB and -1.76 Per 100. Despite being a scorer at the lower levels, he’s also played within his role as a bench energy-guard who can hit the open shot and given effort on both ends.

Rakease Passmore, at -1.89 PPGAB, would be KU’s worst rotation-player in this stat if he played more. His Per 100 of -17.15 certainly is. It’s doubtful that Passmore qualifies with 10% of minutes played by season’s end.

A.J. Storr, who is sitting at -2.03 PPGAB, is KU’s lowest-earning player. He’s also got the second-worst WAR and worst POCWAB on the year. In fact, Storr has only added to his team’s chances of winning in 2 games this season, first against mid-major Oakland and then again at Creighton. He has also had 3 games where his play was neutral in helping the team win, meaning the remaining 7 games (including North Carolina, Michigan State, Duke, Missouri, and West Virginia) were games in which his play hurt the team.

Zach Clemence and Shakeel Moore haven’t played 10% of minutes and thus don’t need much discussion so far. Each has dealt with injuries and had limited impact on the results of the season thus far.

What Comes Next?

Now the fun begins. Kansas is reeling, having lost 3 of 5 and a home game to a West Virginia team that wasn’t supposed to be that good. With losing comes criticism, and there is much consternation about this team.

Hopefully, some of that has been answered above. There are four players (Hunt, Flo, Zeke, Juan) who have been comfortably above-bubble players all season, and have clutched up well enough to help the team win games. While not perfect, these four should be seen favorably. Everyone else warrants more serious scrutiny.

Kansas has struggled with K.J. Adams on the floor recently, though it’s not all the time. Both Creighton and now West Virginia took advantage of his inability to hit the outside shot and sagged off him. While all teams do this to some degree, Adams had very poor games in these two losses, contributing to his negative POCWAB. When he was benched for Flory Bidunga, the Jayhawks made their run to cut an 18-point deficit to 4. The game was eventually tied, with Adams on the court (though he didn’t contribute positively to the effort), but the clear message from Flory’s performance was that Flo could do things K.J. just can’t. Rebound, finish inside, and even cover the roll man on the high-ball screen. Yes, Flory can’t shoot from the outside. But neither can K.J. Might as well play 2 bigs who are elite at the rim/on the glass more.

Even worse has been A.J. Storr, someone who arguably cost KU against West Virginia and could have lost the North Carolina or Duke games had other Jayhawks not rallied and clutched up. One doesn’t hear enough criticism about his play. Some even pine for him to start. While our sympathies are with those who want K.J. to sit more until and unless he starts showing some value, the replacement cannot be A.J.

Our starting line-up, followed by the bench in terms of use, is as follows:

  1. PG Dajuan Harris
  2. SG Zeke Mayo
  3. SF Rylan Griffen
  4. C Flory Bidunga
  5. C Hunter Dickinson

Yes, there are 2 centers listed. This recognizes that KU won’t have anything resembling a stretch-4 or point-forward, but rather two more-traditional bigs. Can Self make it work? No reason to think it couldn’t be an improvement. After all, he played with 2 bigs from 2004 through 2016, winning multiple conference titles, going to 6 Elite 8’s and 2 Final 4’s, and winning a national championship. Mayo and Harris will have to make plays with the ball, utilizing the bigs for screens and finding them in places where they can be effective. Hunter can also pop out, and his outside shot (which is okay, not great) becomes a more-valuable option when you have Flory (a great offensive rebounder) underneath.

The bench, in terms of minutes-played, should be as follows:

  • K.J. Adams
  • David Coit
  • Shakeel Moore
  • A.J. Storr

This makes a 9-man rotation, with it being necessary for each player to get in the first half for a minimum of 4 or 5 minutes. No excuse. If the game is close, the starters will need blows early so their legs are fresh for a longer run in the second half. If KU builds a comfortable lead, it makes sense to rest the starters some, and if KU is trailing then that must be because some of the starters aren’t playing well and something needs to be tried.

Adams has still been the best of the rest. He’s athletic, a versatile and solid defender, and his energy isn’t matched by other options at the 4 once you pull Flory or Hunter. Putting in another guard, such as Coit or Moore, and shifting Griffen down to the 4 makes the shooting better but it makes the defense much worse.

Coit, as a backup, can spell Mayo, Harris, or even play alongside them in a 3-guard look. Moore is slotted in as Harris’ backup, though he needs closer to 10 minutes, not the 1:40 per game he got against N.C. State and West Virginia. He did get 14 against Brown, in a runaway Jayhawk victory.

A.J. Storr stays in the rotation, despite showing nothing this season to merit it. Storr’s reputation and history as a skilled scorer and adept foul-drawer is what keeps him getting playing time. He should spell Griffen at the 3 primarily, but could arguably get some minutes at the 4 if Adams isn’t working out that night.

What Self decides to do shall be seen. Unfortunately, he doesn’t seem all that willing to sit Harris for long. Harris is averaging 35.3 minutes in the 7 games against power-conference teams. Now, this hasn’t always been the worst move. Moore wasn’t available in all of these games. Harris had great games against Michigan State and N.C. State, and held his own against North Carolina, Duke, Missouri, and West Virginia despite slow starts in the Mizzou and WV games. Harris is +12.01, unadjusted, against these 7 teams this year in total. What one hopes is that Moore’s presence can eat minutes up that Harris can use resting, allowing KU to tire out opposing guards while helping Harris be at his max for crunch time. Why else is Moore on the team?

The biggest issue is how he handles the 4-spot, really the 3 and 4 spot. Flory, getting only 12.6 minutes per game, is being wasted. Getting this number up to 20, 22, even 24 could change the dynamic of the team enough to help it. Going with a 2-big line-up means shooters need to shoot, with Griffen, Coit, even Storr being the wings alongside Harris/Mayo in the backcourt. At the moment Griffen seems to be the best choice. We won’t completely write-off Storr just yet.

The Real Issue – Energy

Focusing on each individual misses that basketball is a team game, and that how someone approaches things affects everyone else. KU brought zero energy to start the Creighton, Missouri, and West Virginia games6, trailing by 10+ points within 10 minutes of each. They had double-digit deficits in each second-half by more than just 10, and each time their comebacks were thwarted in part due to how far behind they got. Had KU only gotten down by 10-12 against West Virginia, instead of 18, it’s likely they would have won. Cutting Missouri’s 24-point lead to 2 in the span of about 10 minutes was impressive, but why not keep the game within arm’s length so your eventual run gets you in front?

Energy, or lack thereof, has been tied to poor road performances recently. KU is 3-9 in true road games the last two seasons, and 1-8 over its most recent 9 road contests. This is unheard of. These games are marked by poor energy, with a number of them being effectively over by halftime. Again, this is where utilizing the bench can help.

  1. Minimum of 10% minutes played. ↩︎
  2. Minimum of 10% minutes played. ↩︎
  3. Pomeroy’s rankings are a bit suspect, but if someone is included on them, he certainly isn’t a net negative to the team he plays for. ↩︎
  4. K.J. certainly showed his worth against Duke and Flagg, earning a positive game-score. ↩︎
  5. In fact, Griffen’s performance against N.C. State is the team’s worst clutch performance this season, given the opponent’s quality and being blind to the performance of the team. ↩︎
  6. KU’s energy wasn’t great against Michigan State, although the Spartans didn’t seem to have much either. Eventually both teams worked into the game and it got better, with KU’s talent winning out. ↩︎

Current Championship Odds

Below are the market-derived odds for various championships in sports. These odds are updated manually as of the date listed, so may not be current. This is the most unbiased look at what the market views as the true odds for a team to win a title.

NCAA Basketball Champions (April 2027) – As of 4/7/2026 – First Projection

  • Duke – 7.8%
  • Michigan – 6.9%
  • Arizona – 4.8%
  • Florida – 4.5%
  • Houston – 4.2%
  • Michigan State – 3.9%
  • Connecticut – 3.7%
  • Kansas – 3.7%
  • Arkansas – 3.0%
  • Illinois – 3.0%
  • North Carolina – 2.7%
  • Vanderbilt – 2.4%
  • Gonzaga – 2.4%
  • Texas Tech – 2.4%
  • St. John’s – 2.0%
  • Virginia – 2.0%
  • Iowa State – 2.0%
  • Kentucky – 2.0%
  • Alabama – 2.0%
  • Louisville – 1.2%
  • Purdue – 1.2%
  • BYU – 1.2%
  • Tennessee – 1.2%
  • Miami – 1.2%

Earliest odds have Kansas tied for 7th with Connecticut. A lot to be determined on this front given the nature of the portal and how much teams can change. This is basically the market’s look at program strength, with Kansas still in the mix but a bit lower than the top tier.

2026 U.S. Open – June 2026

  • Scottie Scheffler – 11.7%
  • Rory McIlroy – 7.3%
  • Bryson DeChambeau – 5.3%
  • Jon Rahm – 4.5%
  • Ludvig Aberg – 3.4%
  • Cameron Young – 3.1%
  • Xander Schauffele – 3.1%
  • Matt Fitzpatrick – 2.8%
  • Tommy Fleetwood – 2.8%
  • Collin Morikawa – 2.5%

The season’s third major begins June 18, returning to Shinnecock Hills where it was played 8 years ago. Scheffler’s odds once again show him to be the favorite, and little is changed on the order from the PGA’s. I expect Rahm’s to get better and DeChambeau’s to drop.

There is a 46% chance that someone currently without a major wins the U.S. Open, and by nationality, here is what we’re expecting:

  • USA – 54.1%
  • EUR – 34.1%
  • INT – 11.8%

It has been 14 tournaments in a row with an American or European winner…the Internationals haven’t hoisted a major championship trophy since Cam Smith raised the Claret Jug in 2022.

Looking Back at Recent Champs

Starting Win Odds for 2026 Major Champions

  • 2026 Masters: Rory McIlroy – 5.4%
  • 2026 PGA: Aaron Rai – 0.2%

NCAA Basketball Champions (April 2026)

Michigan won the 2026 National Championship. Here is a history of their odds.

  • 4/8/2025 – 2.5%
  • 12/30/2025 – 13.4%
  • 1/23/2026 – 13.6%
  • 2/25/2026 – 15.4%
  • 3/9/2026 – 18.9%
  • 3/16/2026 (Before R64) – 17.7%
  • 3/24/2026 (Before S16) – 22.7%
  • 3/30/2026 (Before F4) – 37.5%
  • 4/6/2026 (Before CG) – 73.0%

Starting the offseason in 12th in the odds, Michigan emerged as an early favorite by December, and was always in the top three of the odds up to the tournament.

CFP 2025 College Football Season (January 2026)

Indiana won the CFP at the end of the 2025 season. Here is a brief history of their odds.

  • Before Quarterfinals: 21.8%
  • Before Semifinals: 41.4%
  • Before Finals: 73.7%

Starting Win Odds for 2025 Major Champions

  • 2025 British Open: Scottie Scheffler – 13.6%
  • 2025 U.S. Open: J.J. Spaun – 0.5%
  • 2025 PGA Championship: Scottie Scheffler – 11.8%
  • 2025 Masters: Rory McIlroy – 9.4%

NCAA Basketball Champions (April 2025)

Florida won the 2025 National Championship. Here is a history of their odds.

  • 2/17 – 7.5%
  • 3/3 – 7.0%
  • 3/17 (Before R64) – 16.2%
  • 3/22 (Before R32) – 17.2%
  • 3/24 (Before S16) – 17.5%
  • 3/29 (Before E8) – 21.0%
  • 3/31 (Before F4) – 24.0%
  • 4/7 (Before CG) – 51.0%

Florida had the fourth-best odds for much of February into March. By the start of March Madness, this had grown to second-best (behind Duke).

College Football Playoff Odds

Published 12/27/2024, before the quarterfinal round has begun.

Although the 12-team CFP has already started, here are the championship odds for each team using College Football Insiders data:

  1. Oregon – 23.8%
  2. Georgia – 16.0%
  3. Boise State – 0.7%
  4. Arizona State – 3.1%
  5. Texas – 14.3%
  6. Penn State – 8.2%
  7. Notre Dame – 10.3%
  8. Ohio State – 10.1%
  9. Tennessee – 2.2%
  10. Indiana – 3.8%
  11. SMU – 5.2%
  12. Clemson – 1.8%

A noticeable thing occurs when looking at seeds 3 and 4, Boise State and Arizona State, who earned byes into the quarterfinal round due to their conference championships but are nevertheless the two weakest teams in the playoff. Boise has almost no shot of winning, and Arizona State’s odds before the playoff were worse than two of the first-round road teams.

Because the bracket isn’t balanced like one normally assumes it would be (with the #1 seed being the best followed by the #2 seed and so on), there is a strong argument to make that being the #5 or #6 seed is actually better than being the #1 or #2 seed. Let’s compare the #1 seed with the #5 seed, remembering that we need to consider the playoff scenarios before the CFP started. #1 Oregon will play the winner of #8 Ohio State and #9 Tennessee (this is Ohio State) in the quarterfinals. #5 Texas plays #12 Clemson and, if it wins (it did), faces #4 Arizona State in the quarters. So, Oregon just has to win 1 game and Texas has to win 2 games to get to the semifinal round, but Texas arguably has the easier opponents.

Oregon is given a 59.5% chance of winning its Rose Bowl (quarterfinal) game and making the semis. Texas is given a 52.4% chance of winning both the first round and then the Peach Bowl game to make the semis. But, this was before the tournament began. Since that time, Oregon’s quarterfinal opponent was confirmed to be the tougher Ohio State, giving the Ducks a 55.4% chance of making the semis. This still favors Oregon’s path, but 55.4% vs. 52.4% is not a big difference.

To add further weight to the idea that Texas has an easier path to the CFP semifinals, let’s look at actual odds from the bettors. Texas was 13.5 point favorites vs. Clemson, corresponding to a 86.0% chance of winning. In the Longhorns’ Peach Bowl game against Arizona State, they again are 13.5 point favorites. Taking 0.86 * 0.86 gets us to 0.7396, or a 74.0% chance of Texas making the CFP semifinals. Oregon on the other hand is 2.5 point underdogs to Ohio State in the quarterfinal Rose Bowl game, giving the Ducks a 45.8% chance of advancing to the semifinal bowl game. Now, this isn’t a perfect comparison as we don’t exactly know what Oregon’s odds would be in Texas’ spot in the bracket and vice-versa, but Texas would have to be about 10 point favorites vs. Ohio State for it to be a wash for the Longhorns and Oregon would have to have been only about 7.5-point favorites in both games it would have played (Clemson/Arizona State). It’s doubtful that’s the case.

At the moment, the final 8 teams have the following odds of winning the CFP according to the website’s odds (which do differ noticeably from the market-based odds):

  1. Oregon – 20.5%
  2. Georgia – 14.2%
  3. Boise State – 0.6%
  4. Arizona State – 2.4%
  5. Texas – 19.5%
  6. Penn State – 13.4%
  7. Notre Dame – 15.6%
  8. Ohio State – 13.8%

FanDuel’s futures odds give the following implied predictions of winners1:

  1. Oregon – 14.8%
  2. Georgia – 14.8%
  3. Boise State – 0.8%
  4. Arizona State – 1.1%
  5. Texas – 22.8%
  6. Penn State – 14.2%
  7. Notre Dame – 10.1%
  8. Ohio State – 21.5%

Texas and Ohio State are seen as the strongest teams, and Penn State, the #6 seed, despite not being the strongest team, is nearly equal money with Georgia and Oregon due to the Nittany Lions having an easier road through the quarters.

  1. Calculated using the money-equivalent-bet method, where we presume the market is predicting a bet for any team has the same expected average cash out. Or, any of the FanDuel futures would be a comparable bet to all others were the winning percentages to work out in this way. I can think of no better way to derive winning percentages from market odds given that bookmaker’s take cuts (and thus you cannot just add all projected pay-outs and get it to equal 1.0). ↩︎

Player’s Own Clutch Wins Above Bubble (POCWAB)

In the spirit of designing advanced stats with silly acronyms, today we introduce Player’s Own Clutch Wins Against Bubble (POCWAB). What makes POCWAB unique is that it looks at each game individually to see how well someone performed in helping his team win that game. Unlike other methods, which take a player’s season-long value and divide it over the number of games or possessions played, POCWAB weights game played against the better teams more heavily. A player who performs solidly in the games where KU is favored by 20 but doesn’t play well against the tougher teams on the schedule will show up as not being clutch. The player who does show up in the big moments will be recognized even if he doesn’t have the best value metrics for the whole season.

POCWAB is calculated by seeing what a bubble-team’s chances of winning that particular game would be, then taking into account that specific player’s game-specific raw PPG +/-, then recalculating what a bubble team’s chances are of winning given what the specific player did that game. So if Player A is playing in a game where the stakes are even (i.e. against a bubble team) and said team has a 50% chance of winning and said player produces +4 points of raw value, we now calculate how likely it is a team would win if it were 4 point favorites. (Technically we also account for minutes played, so it would be more like if the team were 4.5-to-5 point favorites). If the team now has a 65% chance of winning, this would mean the player contributed 0.15 clutch wins (65%-50%). Clutch wins can be positive or negative.

We can then take that number and sum the total value of clutch wins, or POCWAB.

Since 2022, the furthest year we’ve gone back so far, here are the five best seasons of POCWAB (as well as the leader in 2025):

  • Jalen Wilson 2023: 6.09
  • Ochai Agbaji 2022: 4.68
  • Christian Braun 2022: 4.16
  • Dajuan Harris 2023: 2.91
  • Jalen Wilson 2022: 2.82
  • Hunter Dickinson 2025 (9 games): 0.61

This and That

POCWAB appears to correlate well to WAR and PPGAB +/-1. This probably shouldn’t be too surprising, but we might expect that, for a few players, someone stands out as especially clutch or un-clutch2. For a more in-depth discussion of clutchness, see the note below.3

The season of Remy Martin in 2022 needs to be explored. In Remy’s first 11 games, he had a +0.54 POCWAB, good for third on the team. This was the non-conference portion of the schedule. Remy would miss the 12th non-conference regular season game with injury, and once conference play began was nothing like the player thought it was getting. Martin only played 10 total and 9 conference games (missing 9), producing -0.29 of POCWAB in this span of 19 games4. In comparison, Dajuan Harris was still able to add +0.24 POCWAB as a game-manager sophomore point guard during this time. The final stretch, the 9 games which made up KU’s Big 12 Tournament Title and NCAA Tournament Title runs, saw Remy produce a second-best +1.00 POCWAB (only behind Agbaji). Remy’s NCAA Tournament run of +0.67 was the team-lead. Undoubtedly Remy was clutch in the biggest games.

KU’s worst players in POCWAB over the past few seasons have been its ball-handling guards. Joseph Yesufu (-0.93) and Dajuan Harris (-0.81) were the worst in 2022. Bobby Pettiford (-1.66) was easily the worst in 2023. In 2024, it was Elmarko Jackson (-1.97). This season it has been A.J. Storr (-0.51) and Rakease Passmore (-0.41), though David Coit (-0.26) has also struggled given he’s had a decent season. Coit’s expected POCWAB is only -0.08.

The best relatively clutch seasons are from the clutchest players as seen above for the most part. KU’s 2022 team was clutch, unsurprising given how well it did at the end of the season against tournament competition.

Hunter Dickinson has been relatively un-clutch (does better against easier opponents) over his 2 seasons at KU. Kevin McCullar last season was the worst clutch player when comparing his performances against top opponents vs. the easier ones. This might not be Kevin’s fault, as his injury affected his performance during tougher conference games.

For future plans with this, see the notes5.

  1. In fact it has an R^2 of 0.9123 with PPGAB +/-. ↩︎
  2. Perhaps the only one I could find was the comparison between Mitch Lightfoot and Jalen Coleman-Lands from 2022. Coleman-Lands had a better PPGAB +/- (+0.41 to +0.15), Per100 (+2.88 to +0.72), and WAR (+0.91 to +0.85); but the POCWAB was +0.11 to +0.34 in Lightfoot’s favor. ↩︎
  3. Clutchness is an oft-debated topic in analytics, with many stating it does not exist. We believe it does, but that it is very tough to measure. Frankly, the best players are the best because they are consistently good. But we can still measure player performances while accounting for high-leverage situations. In our scenario, the high-leverage scenarios are just those games which are likely the closest for a bubble-team. POCWAB could be made even better if we added new caveats (such as the actual final margin) or played around with the hypothetical replacement level (which is bubble-level). ↩︎
  4. The Kentucky game (which saw KU humiliated in Allen Fieldhouse) was in the midst of conference play so it is part of the 19-game stretch we discuss. ↩︎
  5. What could make POCWAB better is to increase leverage for NCAA Tournament games, account for how a player’s teammates performed in each game, and adjust the hypothetical level from bubble-level to something higher (like a 4-seed). Right now, Remy Martin’s clutch play isn’t accounting for the importance of the Tourney. Right now, performances like Jalen Wilson’s clutch game in the OT loss at K-State in 2023 are being undervalued, as the only reason that game was even close was due to Wilson’s elite play. Right now, games against teams much better than bubble-teams are not seeing as much leverage as games against true bubble-level teams. Using 2025 as an example, a player’s POCWAB can be affected much more based on his performance against Missouri or Creighton than on his performance against Duke. ↩︎