2016 High School Football Ratings

Power Ratings for 2016. To compare teams, subtract one team’s rating from the other. This will provide an estimated skill difference in points per game.

RankTeamClassRecordRating
1Bishop Miege4A-I12-168.24
2Shawnee Mission East6A10-262.57
3Blue Valley6A12-161.41
4Derby6A13-059.67
5Lawrence Free State6A9-351.59
6Goddard5A11-247.41
7Blue Valley North6A7-445.35
8St. Thomas Aquinas5A8-445.30
9Manhattan6A9-145.27
10Lawrence6A6-443.64
11Mill Valley5A9-439.12
12Hoisington3A12-138.53
13Wichita Heights5A9-237.53
14Hutchinson6A9-237.04
15Holcomb4A-II10-236.45
16Junction City6A8-236.12
17Bishop Carroll5A7-336.04
18Basehor-Linwood4A-I11-135.58
19Washburn Rural6A7-434.90
20Andale4A-I8-233.95
21Pratt4A-II12-133.56
22Maize South4A-I10-233.31
23Olathe South6A4-632.90
24Garden City6A9-132.89
25Buhler4A-I11-232.86
26McPherson4A-I8-332.68
27Wichita Northwest6A6-432.08
28Topeka6A5-432.00
29Scott Community4A-II7-331.94
30Phillipsburg3A11-130.63
31Mulvane4A-I8-330.31
32Gardner Edgerton6A4-630.21
33Shawnee Mission West6A6-430.18
34Great Bend5A10-229.72
35Hesston3A10-429.19
36Wichita Collegiate4A-II7-429.15
37Olathe Northwest6A3-628.73
38Halstead3A9-228.33
39De Soto4A-I7-328.04
40Pittsburg5A5-427.87
41Blue Valley Northwest6A2-727.85
42Louisburg4A-I8-327.39
43Shawnee Mission North6A6-527.28
44St. James Academy5A6-526.63
45Olathe East6A3-626.29
46Dodge City6A5-426.22
47Blue Valley Southwest5A2-826.10
48Plainville2A-1A11-225.10
49Valley Center5A9-225.09
50Ottawa4A-I8-324.44
51Silver Lake3A10-123.62
52Olathe North6A3-623.52
53Rossville3A13-123.47
54Wichita South6A4-522.90
55Nemaha Central3A12-122.57
56Topeka Seaman5A8-321.66
57Smith Center2A-1A9-320.33
58Spring Hill4A-I5-419.89
59Blue Valley West6A2-719.19
60Sabetha3A9-218.59
61Marysville3A7-317.07
62Nickerson4A-II6-417.07
63Andover5A6-416.38
64Augusta4A-I6-416.27
65Shawnee Heights5A3-616.11
66Norton3A7-415.85
67Garden Plain3A10-215.44
68Chaparral3A9-215.42
69Maize5A7-315.03
70Shawnee Mission Northwest6A1-814.30
71Riley County3A5-514.14
72Abilene4A-I7-313.89
73Frontenac4A-II10-113.09
74Kapaun Mt. Carmel5A2-712.97
75Topeka Hayden4A-II8-512.91
76Troy2A-1A13-012.79
77Southeast of Saline3A7-312.34
78Bonner Springs5A4-611.09
79Clay Center4A-II5-510.93
80Hugoton4A-II5-410.92
81Wichita West6A3-610.61
82Paola4A-I4-510.16
83Kansas City Piper4A-I6-49.81
84Campus6A3-69.51
85Holton4A-II7-59.14
86Goddard Eisenhower5A3-68.67
87Colby4A-II5-58.66
88Atchison4A-I6-38.28
89Conway Springs3A7-27.85
90Meade2A-1A8-27.55
91Salina South5A1-87.19
92Smoky Valley4A-II8-37.07
93Hays4A-I2-76.74
94Tonganoxie4A-I5-45.59
95Leavenworth5A1-85.54
96Clearwater4A-II3-65.49
97Washington County2A-1A8-35.40
98Marion3A7-25.28
99Larned3A3-84.82
100Independence4A-I8-24.78
101Eudora4A-I2-73.93
102Ulysses4A-I4-63.38
103Beloit3A6-32.86
104Arkansas City5A3-62.68
105Liberal5A4-52.65
106Ellsworth3A5-42.64
107Wamego4A-I4-52.61
108Newton5A1-82.32
109Emporia5A4-61.90
110Cimarron3A7-31.87
111Rose Hill4A-I3-61.82
112Kansas City Schlagle5A8-2-0.43
113Perry-Lecompton3A4-6-0.78
114Shawnee Mission South6A0-9-0.96
115Wellsville3A10-2-1.13
116Lansing5A4-5-1.43
117Wichita Trinity Academy4A-II3-6-1.48
118Cheney3A5-4-1.53
119Fort Scott4A-I3-6-1.78
120Santa Fe Trail4A-II7-2-1.87
121Andover Central4A-I2-7-2.06
122Wabaunsee2A-1A4-5-2.25
123Kingman4A-II3-6-2.31
124Columbus4A-II8-2-2.45
125El Dorado4A-I3-6-2.59
126Labette County4A-I5-5-3.22
127Sterling3A6-4-3.27
128Galena3A8-3-3.59
129Salina Central5A0-9-4.51
130Rock Creek4A-II2-7-4.62
131Valley Heights2A-1A7-3-4.77
132Wichita East6A2-7-4.96
133Hillsboro3A3-6-5.14
134La Crosse2A-1A5-6-5.52
135Jackson Heights2A-1A6-3-5.52
136Baldwin4A-II3-7-6.34
137Goodland4A-II3-6-6.85
138Jefferson County North2A-1A8-2-7.18
139Topeka Highland Park5A0-9-7.77
140St. Mary’s-Colgan2A-1A8-4-7.81
141Republic County2A-1A5-6-7.94
142Lakin3A5-5-9.37
143Circle4A-I1-8-9.89
144Concordia4A-II1-8-9.96
145Sedgwick2A-1A7-3-10.56
146Wichita Southeast6A1-8-10.93
147Winfield4A-I1-8-11.40
148Centralia2A-1A1-8-11.56
149Hutchinson Trinity3A5-4-11.82
150Lyndon2A-1A9-2-12.37
151Mission Valley3A6-4-12.38
152Wichita Independent3A3-7-12.40
153Wellington4A-I0-9-13.22
154Girard4A-II5-6-13.37
155Field Kindley4A-I4-5-15.00
156Chanute4A-I3-6-16.43
157Topeka West5A1-8-16.49
158Salina Sacred Heart2A-1A3-6-16.69
159Caney Valley3A9-3-16.72
160Kansas City Turner5A5-5-17.63
161Burlington4A-II5-4-18.20
162Thomas More Prep-Marian3A2-7-18.30
163Elkhart2A-1A6-4-18.33
164St. Marys3A4-5-18.43
165Haven3A1-8-19.22
166Ell-Saline2A-1A3-6-19.69
167Ellis2A-1A4-5-19.72
168Maur Hill Prep3A7-3-20.54
169Olpe2A-1A5-5-21.03
170Iola4A-II4-6-21.25
171Chase County2A-1A6-3-22.15
172Council Grove3A6-3-22.18
173Russell3A2-7-22.44
174Hiawatha3A4-5-23.07
175Royal Valley3A3-6-23.40
176Fredonia3A7-3-25.14
177Osawatomie4A-II2-8-25.17
178Jayhawk Linn3A9-1-25.20
179Oakley2A-1A1-8-26.16
180Moundridge2A-1A3-7-26.73
181Kansas City Washington5A3-6-26.76
182Baxter Springs4A-II5-4-27.54
183Prairie View4A-II2-7-28.00
184Osage City3A5-6-28.16
185Riverside3A3-6-28.28
186Wichita North6A0-9-28.73
187Kansas City Wyandotte6A2-6-28.93
188Chapman4A-II1-8-30.71
189Douglass3A3-7-30.93
190Parsons4A-II1-8-30.98
191Jefferson West4A-II1-8-31.68
192Pleasant Ridge3A3-7-32.09
193McLouth2A-1A4-5-32.73
194Doniphan West2A-1A2-7-33.43
195Inman2A-1A3-6-34.39
196Kansas City Harmon5A0-8-34.40
197Minneapolis3A1-8-35.39
198Neodesha3A5-4-35.50
199Anderson County4A-II2-7-36.43
200Lyons3A0-9-36.45
201Oskaloosa3A4-5-36.70
202Belle Plaine3A2-7-38.78
203Kansas City Sumner5A2-6-39.05
204Remington2A-1A2-7-39.11
205Cherryvale3A5-4-39.22
206Medicine Lodge2A-1A0-9-39.36
207Southwestern Heights3A2-7-40.21
208Syracuse3A3-6-41.26
209Humboldt3A4-6-44.84
210Horton2A-1A1-8-46.46
211Riverton3A2-8-46.60
212West Franklin3A2-7-46.64
213Northern Heights2A-1A2-7-49.03
214Erie3A2-7-54.62
215Stanton County2A-1A2-7-57.64
216Oswego2A-1A3-7-57.98
217Bishop Ward4A-II0-9-58.18
218Atchison County3A0-9-58.40
219Central Heights3A1-8-59.96
220Bluestem3A2-7-61.17
221Maranatha Academy3A2-7-62.75
222Yates Center2A-1A2-7-63.35
223Uniontown2A-1A2-7-64.10
224Southeast3A0-9-74.35
225Sublette2A-1A0-9-81.52
226Eureka3A0-9-83.59
227Northeast3A0-9-92.18
ClassAverage RatingState ChampionRunner-Up
6A25.93DerbyBlue Valley
5A9.89Mill ValleyGoddard
4A-I11.82Bishop MiegeBuhler
4A-II-4.09PrattTopeka Hayden
3A-16.77RossvilleHesston
2A-1A-22.11TroyPlainville

2026 Kansas Jayhawks

The 2026 Kansas Jayhawks were 24-11 and earned a 4-seed in the NCAA Tournament. They advanced to the Round of 32 before losing. The team’s College Basketball Reference page is here.

Traditional Stats

Value Offense

Value Defense

Combined Value PPGAB

Value 4-Way

The 2026 Season

Battling injury for most of the non-conference season, star freshman Darryn Peterson’s availability was the biggest story for much of the year. While he would only miss two games after the new year (one for an ankle injury and one for illness), Peterson wouldn’t be fully available to play 30+ minutes per game until the final five weeks. Throughout the season speculation raged, with people theorizing he was sitting out to protect his NBA draft stock or that he never intended to play another game in college. More than a few prognosticators looked rather silly on this front. Once he did start playing a full allotment of minutes, the narrative was quickly dropped.

With Peterson in the lineup fulltime, Kansas did not improve like it was assumed they would with a lottery pick getting serious minutes. Instead, the rest of the team got noticeably worse. KU was a +10.35 team over its first 24 games (through Arizona at home) but closed its final 11 as a +2.28 team (with a 5-6 record over that stretch). It was the third season in a row where KU limped to the finish, with 2024 being a season devastated by injury to key players (with Dickinson not 100% and McCullar missing the NCAA Tournament) and 2025 being a season with an underachieving team that showed little fight in the last few minutes of close games who lost in the tournament in a close game. The 2026 team really didn’t have a story line that it could blame its end of season poor play on…it was finally healthy and had developed a set rotation by March. If anything, it should have been playing its best basketball. Yet it was struggling down the stretch and couldn’t find momentum in March.

As was stated, the team got worse on the court after it got better on paper with the return of Peterson. But Peterson wasn’t the problem. He was KU’s most valuable player, leading scorer, and put up a Per100 value score in the 98.2%ile (sixth among all KU player seasons since 1993). With the rest of the roster in a rut, Self tried to change things up a bit late and almost stole a win in the Round of 32, but the buzzer beater from St. John’s sent KU home before the second weekend for the fourth season in a row.

The four legitimate KU-level players in 2026 get featured with an image.

Season Write-Ups

2026 Player Projections (10/23/2025)

Through 5 Games – Peterson is Currently Out (11/19/2025)

KU Through Christmas Break Recap (12/23/2025)

Melvin Council and Past KU Guards (1/9/2026)

Looking Ahead to the Rest of the Season (1/9/2026)

Elmarko Jackson, Darryn Peterson, and Value (2/19/2026)

The Importance of Quality Depth (3/4/2026)

Beware of the Phog Update (3/9/2026)

Tournament Preview – KU’s Path (3/17/2026)

2026 Season Recap – Value Metrics (4/7/2026)

2026 Projections

Initially written on 10/14/2025, published on 10/23/2025.

The 2026 Kansas Jayhawks are almost a brand-new team from the year before, making the exercise of projecting how the team will do a much different task than in prior seasons. With transfer portal players, international recruits, and multiple true freshmen on the team for the upcoming season, how these pieces fit together is something that no one is quite sure of yet.

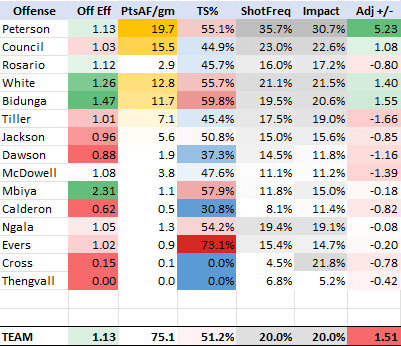
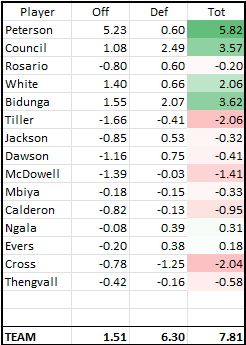
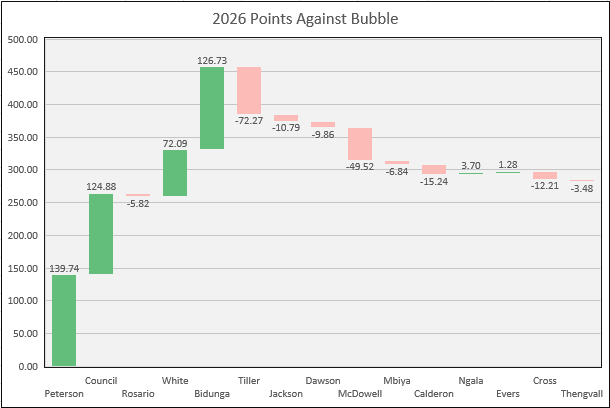
Team Projection: +3.62

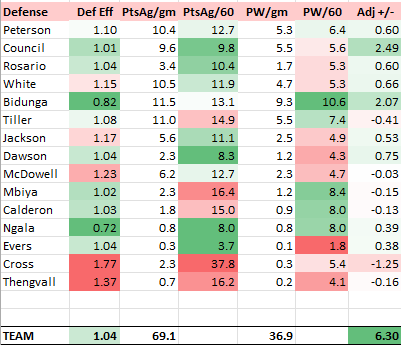
Our projection is that the 2026 Kansas Jayhawks are going to be about 3.62 points better than a bubble-team, which would translate to a +19.17 KenPom rating and an average seed of about 7. This would tie Self’s worst seed during his time at Kansas (last year) and is comparable though perhaps even more pessimistic than other preseason rankings (AP #19, KenPom #21, Torv #17, Lunardi 5 seed).

Player Projections

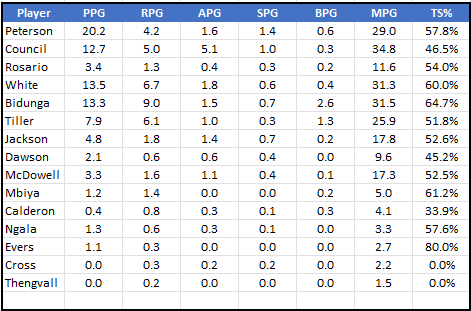
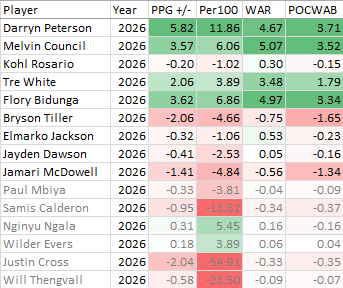
Darryn Peterson (Fr.): +6.45 Per100 on 80% mins, +3.61 PPGAB

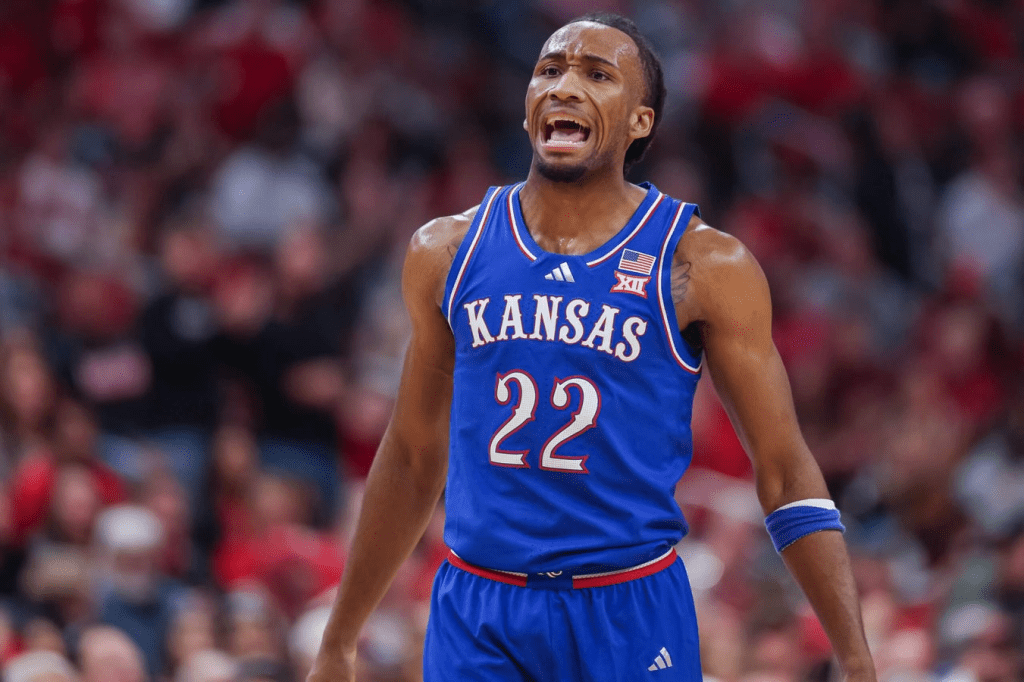
Peterson finished as the #2 overall high school recruit, and is KU’s most-hyped recruit perhaps ever, but at least since Andrew Wiggins. He has gotten national attention before even playing a game at KU, being projected at the top of NBA mock drafts and has 10/1 odds to win Naismith Player of the Year. He doesn’t have any discernable weaknesses, and if he lives up to even half of the hype and accolades he’s received, will easily be KU’s best player this year.

His projections are slotted based on what top freshmen recruits have historically done at Kansas. His numbers are very close to Ben McLemore’s, Devon Dotson’s, and Andrew Wiggins’. There’s good reason to think he can surpass these names, but considering all scenarios we feel comfortable leaving them as is. But if Peterson can play like the number one overall pick season, he can help raise this team’s ceiling immensely. He’s going to have to if KU is going to be the type of team Self has typically produced.

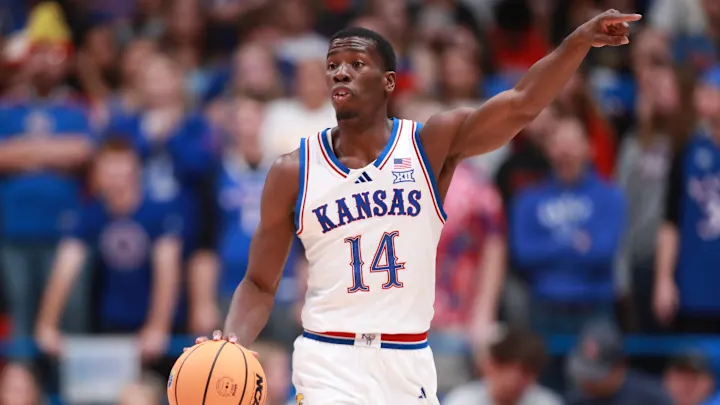
Flory Bidunga (So.): +4.25 Per100 on 65% mins, +1.93 PPGAB

Flory was a surprise entry into the transfer portal this past spring, requiring Kansas to re-recruit him and confirm they are serious about him moving forward. He had an excellent stretch as a true frosh in a Kansas uniform but saw his playing time diminish after K.J. Adams returned from injury later in the season. Bidunga did not close the season well. His strengths are in his ability to dunk, block, rebound, jump, run, and move. He isn’t a polished low-post scorer, but his athletic upside only means he will continue to improve. He is KU’s only returning big man and second-most important player.

His projections are based upon a sensible increase in his play from last year, but honestly if he merely matches what he did over the first two-thirds of the 2025 campaign he will surpass these marks. Flory has the potential to be a valuable asset as a modern big man, running the floor, playing the pick-n-roll, and flushing dunks from lobs.

Melvin Council (Sr.): +3.40 Per100 on 80% mins, +1.90 PPGAB

Council is the first of our transfer seniors to get a mention. In looking at his contributions last season at St. Bonaventure, it’s clear he was their most important piece and a huge contributor and creator on offense and defense. Now we cannot say for sure how good his coverage defense is, nor can we say how well he will do playing up a level against Big 12-quality opponents, but his vocal leadership and proven toughness have already won many Kansas fans who follow off-season news.

Council’s projections expect him to be KU’s #2 offensive creator, complementing Peterson while also making winning plays through hustle stats (steals, rebounds, pressure defense, etc.). If he plays the game with the right type of energy, it will show up in the metrics.

Tre White (Sr.): +3.10 Per100 on 60% mins, +1.30 PPGAB

White may be the most proven player on the 2026 roster, having played at the power conference level with his time at Illinois. While his 3-point shooting marks haven’t been elite, his true shooting numbers last year were solid thanks to solid shooting inside the arc and at the line. He also rebounded well and took care of the ball. His limitations appear to be as a creator (low assist rate), so how well he shoots from the outside, finishes his scoring opportunities in the paint, and how frequently he gets to the line will determine how high of an offensive ceiling he will have.

Defense is a question mark just as with other newcomers. But his age and size suggest he will be at least average. His value projections are slightly lower than what his estimated value for 2025 was, so hopefully these marks indicate a floor-level to his play for 2026.

Jayden Dawson (Sr): -1.05 Per100 on 50% mins, -0.37 PPGAB

Dawson is easily the lowest projected player of the incoming three transfers who will end their college careers at Kansas as one-year seniors. He’s a decent shooter from deep (36% career 3-point shooter) but doesn’t stand out in other departments. He’s not someone who gets to the line a ton, not does he generate a lot of assists. He isn’t a great rebounder nor does he grab many steals for his position. He was a solid player at a lower level last season, but given the change in competition, will he make as many shots this year?

His value projections assume he can maintain at least some of his skill moving up a level, something that Zeke Mayo was able to do (but Nick Timberlake wasn’t).

Kohl Rosario (Fr): -4.70 Per100 on 40% mins, -1.32 PPGAB

A late reclassifier, Rosario has been mentioned as someone who has impressed the coaches during the offseason. He is an athletic wing with NBA potential size and skill that has him in some mock drafts for 2026. He is slotted as a #70 recruit (ESPN) but should he play like a top 30 or higher freshman, he has a huge chance to really boost his value metrics. Between he and Dawson, KU is hoping to find a fifth starter to provide above-bubble value.

Elmarko Jackson (RS So): -5.25 Per100 on 20% mins, -0.74 PPGAB

Elmarko is the second of three Kansas scholarship returnees, but his return is following a redshirt season due to injury. Jackson came in as a highly regarded McDonald’s All-American but struggled mightily as a frosh. He lost his starting job and only played important minutes due to KU’s thin roster in 2024. He had a bright moment helping get a defensive stop to seal the NCAA Tournament win against Samford, and he should be able to develop into a solid defender given his athletic ability and size. His projection is based upon a typical improvement from freshman to sophomore, but given how low his value as a freshman was, we are confident he can surpass this projection.

Jamari McDowell (RS So): -5.15 Per100 on 15% mins, -0.54 PPGAG

Jamari is in a similar situation to Elmarko. A redshirt 2025 season means he’s returning to the (game) court in the first time in over a year, so how much the season off helped him develop his ability is still part of the equation. We are bumping him up from his freshman value marks, while hopeful he can surpass these projections.

Nginyu Ngala (Sr): -6.04 Per100 on 15% mins, -0.63 PPGAB

Ngala comes in as a senior in eligibility, having played in Canada for collegiate hoops. He is also 26 years old, so we don’t see him being bullied or intimidated at this level. He is a small scoring guard, so we are curious to see how his game translates to Kansas. His projection was based upon him as the #101 recruit out of high school. This is probably too low, but we wanted to be cautious.

Bryce Tiller (Fr): -5.36 Per100 on 25% of mins, -0.94 PPGAB

We’ve now arrived to the other bigs not named Flory Bidunga. Tiller is the best-known of the three, having come in last winter to practice with the team while not burning eligibility. He has had time to develop, get accustomed to the school, and play against D-1 bigs in practice. His projection slots him as the #85 freshman, an estimate given he enrolled early and isn’t listed in RSCI or ESPN. We see him developing into a solid collegiate player, but how much of that happens as a freshman remains to be seen.

Samis Calderon (Fr): -5.64 Per100 on 20% of mins, -0.79 PPGAB

Calderon is Brazilian who came to Kansas by way of Overtime Elite from Atlanta. Good size/length and a very good athlete. What are his ball skills like? His defensive instinct? Ability to score in isolation? We just don’t know. His #91 ranking in ESPN slots him as a very replaceable talent his freshman season, but again it’s just as likely he outshines this rank than he plays below it.

Paul Mbiya (Fr): -6.41 Per100 on 20% mins, -0.90 PPGAB

Mbiya is the final big man listed, coming to Kansas by way of DR of Congo via France’s ASVEL. His numbers indicate he is a good rebounder, finishes inside at a high rate, but shoots free throws at about 50%. Very similar to Doke in that regard, something I’m sure will be brought up by commentators. One thing to note is that Doke was very raw as a freshman and not very valuable before his season-ending injury. Mbiya (20) is a bit older than the typical freshman. Of he, Calderon, and Tiller; KU needs one to comfortably surpass projections so that minutes are distributed toward the better value. Mbiya is slotted as #120 recruit.

Corbin Allen (Fr): -11.99 Per100 on 5% of mins, -0.42 PPGAB

Allen is a local product (Kansas City, MO) and not projected to play much. He is KU’s 13th scholarship player and was slotted as #250 incoming recruit. His PPGAB marks are based upon him appearing in every game, whereas in reality players with limited minutes normally play in about half of the contests.

Walk-ons: N/A on 5% mins

Not going to go through the hassle of projecting walk-on numbers, but KU has three grand-fathered walk-on players this season: Wilder Evers, Will Thengvall, and Justin Cross. Sadly, this is going away as teams will soon be 15-player rosters with full scholarship/NIL payment potentials. It just doesn’t make sense to waste a spot on someone who is merely going to be a practice player. Many a fan favorite got the chance to wear the Jayhawk uniform due to being a walk-on, and some even developed into scholarship players (Christian Moody, Conner Teahan).

But with dark clouds and rain comes growth. One area for players who otherwise wouldn’t have been Jayhawks to still get that chance is thanks to the transfer portal. We’ve already seen a Zeke Mayo—Lawrence kid but not quite elite coming out of high school—get the chance to develop himself into a KU-level player by going to a smaller school and transferring in. So, there will still be that easy-to-root-for kid who eventually gets his chance. It will just be different from before.

Reversion Bump:

In order to get to the Team Estimate of +3.62, we bumped up the cumulative player estimates by 1.50 points. This was partly due to the fact that individual player projections are conservative, but mostly due to the fact that the minutes distribution will not be as spread out as it is. We currently show 12 players as playing 15% of minutes or more, unsure of who will beat out whom for playing time, but we are confident that there will be 8 or at most 9 guys who get rotation-level minutes. The guys who get rotation minutes will likely outperform expectations (and those that do not will most likely underperform). The end result will be a better overall output as minutes go to the better players.

Closing Thoughts:

Current projections are for KU to play 2 bigs 30% of the time. I believe the plan will be for Tre White to start as a stretch 4 (he’s a solid enough rebounder) and there is certainly the option for Rosario to play that role some as well along three guards and a big (mostly Flory). But there will also be times where playing two bigs makes sense, or at the very least Self will experiment doing so. KU’s guards aren’t super deep. After Peterson and Council, who else do you want out there playing serious minutes? Jackson, McDowell, Ngala, even Dawson aren’t likely going to be clearly superior vs. adding some rebounding/size by playing a bigger 4 man and sliding White/Rosario down to the 3. So, we will see what style of play KU goes with given its roster. Self clearly wanted to give himself options as playing either way is viable.

10/23 Update

With the first exhibition two days away, more information is available which would change some things about these projections. We are less concerned with the accuracy of the projections than we are about the objectivity of them. This is why we utilize recruiting rankings, past seasons’ stats, and very little else. Projections are slotted based on what players have objectively done or proven. This doesn’t mean they will meet them (see A.J. Storr or Elmarko Jackson), but it does provide a good level of expectation for the team coming in.

With all that said, the hype around Peterson means he will surpass his totals and be KU’s best freshman player in the Bill Self era (and likely ever, given that Wilt couldn’t suit up for the varsity team). There’s just too much going for him in terms of praise, preseason accolades (unanimous preseason first team Big XII selection), and market attention (+1000 Wooden Award odds, tied for second best odds nationwide).

Kohl Rosario has been announced as a starter for KU’s first exhibition game, and like Peterson, seems to only be receiving praise from his teammates, coaches, and the media. Freshmen are tough to project, because some just don’t quite make the adjustment to college hoops right away (Quentin Grimes). The big thing about Rosario and projections is that he was slotted to be a well-below KU-level player. He will certainly not be as bad as his initial projections showed, and his minutes played will also be higher than initially estimated.

Injury is another factor. Jayden Dawson didn’t play in the Late Night scrimmage because of injury and hasn’t impressed according to rumors. His projected value marks aren’t great, but there is still a good chance he doesn’t reach these marks. Others in the backcourt (Jackson, Ngala, McDowell) are likewise not mentioned much, though of these three it looks like Jackson is the guy Self is favoring.

Finally, the front court. Of the three non-Flory guys, Tiller’s name is the one that appears to be beating out the other two. Instead of Tiller getting 25% of the minutes and the other two 20% of the minutes, it might be something like 45%/10%/10%. Or maybe Tre White will play even more at the 4 and Kansas will prefer playing smaller more often than initially projected.

Ultimately, it looks like KU has five legitimate players (the five current starters) that will be as good or better than most starting fives they face. The bench will be the team’s weak spot, with the caveat that there are a number of guys with different skill sets that can emerge.

2017 High School Football Ratings

Power Ratings for 2017. To compare teams, subtract one team’s rating from the other. This will provide an estimated skill difference in points per game.

RankTeamClassRecordRating
1Bishop Miege4A-I13-066.84
2Goddard5A11-149.80
3Derby6A11-248.99
4St. Thomas Aquinas5A11-248.27
5Phillipsburg3A12-146.17
6Blue Valley North6A9-445.81
7Bishop Carroll5A12-144.17
8Andale4A-I12-143.99
9Wichita Northwest6A10-243.88
10Shawnee Mission East6A9-243.59
11Blue Valley6A8-442.51
12Lawrence Free State6A10-142.46
13De Soto4A-I10-242.09
14McPherson4A-I10-238.64
15Smith Center2A-1A12-138.40
16Buhler4A-I7-336.26
17Topeka6A8-234.37
18Manhattan6A8-233.39
19Conway Springs3A10-132.98
20St. James Academy5A8-331.60
21Maize South4A-I9-231.09
22Mill Valley5A7-530.77
23Kapaun Mt. Carmel5A6-430.63
24Labette County4A-I9-229.46
25Olathe East6A5-529.29
26Marysville3A12-229.28
27Maize5A9-228.64
28Hutchinson6A5-428.50
29Holcomb4A-II12-127.13
30Goddard Eisenhower5A5-627.06
31Wichita Heights5A6-426.51
32Pittsburg5A8-326.31
33Scott Community4A-II11-126.00
34Sabetha3A13-125.58
35Olathe North6A7-425.20
36Andover5A5-524.94
37Campus6A5-522.12
38Silver Lake3A12-121.50
39Lawrence6A5-521.47
40Cheney3A9-321.24
41Garden City6A8-321.17
42Olathe South6A4-620.88
43Blue Valley Southwest5A3-620.69
44Nemaha Central3A10-120.61
45Paola4A-I7-320.02
46Great Bend5A5-419.81
47Nickerson4A-II7-319.60
48Olathe Northwest6A4-618.58
49Galena3A11-118.31
50Fort Scott4A-I8-318.23
51Perry-Lecompton3A7-418.07
52Andover Central4A-I5-617.68
53Riley County3A7-317.24
54Tonganoxie4A-I9-117.22
55Larned3A6-517.15
56Basehor-Linwood4A-I7-317.11
57Centralia2A-1A8-316.84
58Pratt4A-II7-216.75
59Clay Center4A-II7-416.45
60Junction City6A5-416.14
61Smoky Valley4A-II9-216.06
62Gardner Edgerton6A0-915.91
63Salina South5A3-715.49
64Hesston3A8-415.35
65Valley Center5A5-414.78
66Columbus4A-II7-314.68
67Garden Plain3A7-214.33
68Shawnee Heights5A7-314.23
69Wichita West6A5-413.88
70Mulvane4A-I6-413.74
71Bonner Springs5A5-513.70
72Wichita Collegiate4A-II5-513.35
73Newton5A3-613.08
74Frontenac4A-II9-413.04
75Norton3A7-312.95
76Blue Valley West6A1-812.45
77Blue Valley Northwest6A2-712.18
78Hoisington3A7-411.60
79Topeka Seaman5A4-511.56
80Shawnee Mission Northwest6A4-511.53
81Jefferson County North2A-1A10-111.13
82Louisburg4A-I6-310.69
83Cimarron3A7-310.53
84Chaparral3A6-310.36
85Washburn Rural6A4-510.28
86Topeka Hayden4A-II7-59.91
87Hays4A-I3-69.78
88Halstead3A4-69.51
89Colby4A-II6-49.10
90Augusta4A-I5-48.87
91Emporia5A4-58.56
92Concordia4A-II4-57.92
93Plainville2A-1A8-47.81
94Liberal5A6-37.15
95St. Marys3A5-56.96
96St. Mary’s-Colgan2A-1A10-36.91
97Wichita East6A3-66.41
98Wellsville3A9-26.14
99Beloit3A6-35.10
100Goodland4A-II2-75.05
101Kansas City Schlagle5A9-15.02
102Dodge City6A3-64.81
103Jackson Heights2A-1A8-24.72
104Field Kindley4A-I4-54.13
105Wellington4A-I5-53.90
106Arkansas City5A1-83.80
107Holton4A-II7-43.48
108Valley Heights2A-1A7-23.42
109Burlington4A-II7-42.59
110Shawnee Mission South6A3-62.44
111Salina Central5A0-91.71
112Olpe2A-1A9-31.07
113Lyndon2A-1A8-20.25
114Kingman4A-II5-50.20
115Baldwin4A-II6-40.02
116Osage City3A9-3-0.16
117Hugoton4A-II3-6-0.96
118Sedgwick2A-1A5-5-1.03
119Caney Valley3A8-3-1.11
120Thomas More Prep-Marian3A3-6-1.18
121Marion3A8-3-1.22
122Lakin3A7-3-1.94
123Winfield4A-I2-7-2.18
124Wamego4A-I5-5-2.74
125Spring Hill4A-I2-7-3.56
126El Dorado4A-I4-5-3.74
127Chanute4A-I5-5-3.97
128Rock Creek4A-II3-6-4.38
129Wichita Trinity Academy4A-II4-5-4.68
130Ottawa4A-I1-8-5.13
131Shawnee Mission West6A0-9-5.37
132Clearwater4A-II1-8-5.53
133Eudora4A-I2-7-5.92
134Maur Hill Prep3A7-3-5.97
135Leavenworth5A3-6-6.15
136Kansas City Piper4A-I4-5-6.35
137Abilene4A-I2-7-6.61
138Elkhart2A-1A8-3-6.82
139Lansing5A2-7-6.84
140Southeast of Saline3A4-5-7.07
141Mission Valley3A6-4-7.16
142Santa Fe Trail4A-II6-3-7.21
143Rose Hill4A-I1-8-7.45
144Sterling3A6-2-7.87
145Ell-Saline2A-1A8-2-8.75
146Ulysses4A-I1-8-9.23
147Hutchinson Trinity3A6-4-9.39
148Chapman4A-II1-8-10.34
149Cherryvale3A7-3-10.86
150Meade2A-1A5-5-11.68
151Ellsworth3A6-3-12.07
152Shawnee Mission North6A1-8-12.41
153Rossville3A2-7-12.75
154Humboldt3A7-3-13.02
155Prairie View4A-II4-6-13.70
156Wichita Southeast6A1-8-14.25
157Girard4A-II4-6-15.24
158Baxter Springs4A-II4-5-15.68
159Wichita South6A1-8-15.71
160Jefferson West4A-II2-7-15.99
161Russell3A4-5-17.85
162La Crosse2A-1A6-4-18.38
163Circle4A-I0-9-18.70
164Doniphan West2A-1A6-4-19.54
165Atchison4A-I4-5-19.73
166Troy2A-1A4-5-20.82
167Royal Valley3A4-5-20.85
168Jayhawk Linn3A8-2-21.28
169Topeka West5A1-8-22.35
170Ellis2A-1A3-6-22.42
171Haven3A2-7-22.77
172Douglass3A3-7-23.13
173Council Grove3A6-3-24.02
174Hillsboro3A1-8-24.11
175Medicine Lodge2A-1A4-6-24.46
176Kansas City Turner5A4-6-24.56
177Oskaloosa3A3-6-25.91
178Neodesha3A5-5-26.19
179Salina Sacred Heart2A-1A2-7-26.60
180Iola4A-II3-6-26.60
181Osawatomie4A-II2-7-27.08
182Minneapolis3A2-7-27.36
183Moundridge2A-1A2-7-27.42
184Hiawatha3A2-7-27.45
185Parsons4A-II1-8-28.29
186Horton2A-1A3-6-28.62
187Washington County2A-1A0-9-29.30
188Kansas City Wyandotte6A1-7-30.15
189Independence4A-I2-7-30.88
190Pleasant Ridge3A4-6-31.11
191Wichita North6A0-9-31.37
192West Franklin3A3-6-32.20
193Riverside3A2-7-32.59
194Oakley2A-1A1-8-32.61
195Wabaunsee2A-1A1-8-32.81
196Topeka Highland Park5A0-9-32.87
197Belle Plaine3A2-7-34.94
198Kansas City Washington5A2-7-35.44
199Wichita Independent3A1-9-35.52
200Southwestern Heights3A2-7-35.67
201Lyons3A0-9-36.68
202Kansas City Sumner5A4-4-37.44
203Anderson County4A-II1-8-38.69
204Remington2A-1A1-8-38.95
205Fredonia3A3-6-39.02
206Republic County2A-1A0-9-40.60
207Syracuse3A3-6-41.46
208Atchison County3A0-9-41.79
209Northern Heights2A-1A3-6-42.01
210Riverton3A1-8-43.84
211McLouth2A-1A0-9-44.62
212Eureka3A3-6-45.37
213Kansas City Harmon5A0-9-47.02
214Erie3A2-7-48.44
215Maranatha Academy3A2-7-50.42
216Bluestem3A3-6-51.53
217Uniontown2A-1A4-5-51.64
218Stanton County2A-1A3-6-51.66
219Inman2A-1A0-9-51.71
220Chase County2A-1A1-8-53.47
221Southeast3A0-7-53.82
222Oswego2A-1A1-8-56.60
223Yates Center2A-1A3-7-57.78
224Central Heights3A0-9-58.67
225Bishop Ward4A-II0-9-61.74
226Sublette2A-1A0-9-67.96
227Northeast3A0-9-72.55
ClassAverage RatingState ChampionRunner-Up
6A16.22Blue Valley NorthDerby
5A9.55Bishop CarrollSt. Thomas Aquinas
4A-I9.49Bishop MiegeAndale
4A-II-2.34HolcombFrontenac
3A-11.99SabethaMarysville
2A-1A-22.22Smith CenterSt. Mary’s-Colgan

2025 High School Football Ratings

Power ratings for 2025 through Week 12 (before title games). To compare teams, subtract one team’s rating from the other. This will provide an estimated skill difference in points per game.

RankTeamClassRecordRating
1Andale3A13-057.96
2Kapaun Mt. Carmel4A12-151.06
3Manhattan6A11-250.05
4Maize6A10-149.52
5St. Thomas Aquinas5A8-248.84
6Mill Valley5A8-348.08
7Derby6A8-447.33
8Great Bend5A11-146.96
9Wichita Northwest6A9-244.00
10Topeka Hayden3A12-142.34
11St. James Academy5A10-241.16
12Hays5A8-339.07
13Southeast of Saline2A12-137.76
14Gardner Edgerton6A9-337.22
15Olathe West6A9-236.96
16Junction City6A7-334.68
17Shawnee Mission Northwest6A7-434.60
18Salina Central5A12-133.91
19Rock Creek3A11-133.57
20Nemaha Central2A13-033.29
21Blue Valley5A4-533.08
22Basehor-Linwood5A12-132.97
23Hoisington2A10-132.94
24Olathe Northwest6A9-432.85
25Spring Hill5A8-232.24
26Olathe South6A5-531.36
27Bishop Carroll5A6-429.80
28Osage City2A10-229.39
29Andover5A6-328.87
30Washburn Rural6A6-428.83
31Blue Valley Northwest6A4-528.69
32Shawnee Mission East6A5-428.52
33Blue Valley West6A3-728.47
34Pratt3A9-227.62
35Bishop Miege4A7-626.78
36De Soto5A7-326.14
37Eudora4A9-225.12
38Cheney3A7-424.77
39Leavenworth5A9-224.49
40Hutchinson5A7-323.95
41Holcomb3A9-123.51
42Lawrence Free State6A6-423.51
43Lawrence6A1-823.38
44Sabetha2A9-222.86
45Silver Lake2A7-321.99
46Hugoton3A8-221.42
47Wamego4A9-320.93
48Olathe North6A5-520.64
49Mulvane4A8-219.48
50Rossville1A11-219.28
51Kansas City Piper4A5-519.16
52Hesston3A6-418.30
53Shawnee Heights5A4-517.99
54Goddard5A6-417.83
55Blue Valley North5A4-617.66
56Jefferson West3A8-317.61
57Rose Hill4A6-417.28
58Scott Community3A5-317.00
59Liberal5A7-316.95
60Valley Center5A4-516.67
61Buhler4A6-416.53
62Phillipsburg2A7-416.48
63Topeka Seaman5A3-616.41
64Holton3A6-516.07
65Olathe East6A3-615.77
66Wichita East6A5-515.75
67Salina South5A3-815.71
68Clay Center3A6-414.81
69Jackson Heights1A11-114.18
70Augusta4A5-613.81
71Sterling1A13-013.74
72Wichita Southeast6A7-313.60
73Ottawa4A7-413.45
74Goddard Eisenhower5A2-713.32
75St. Mary’s-Colgan1A10-113.29
76Garden Plain2A9-213.11
77Tonganoxie4A5-512.81
78Andover Central4A5-512.54
79Dodge City6A4-512.30
80Blue Valley Southwest5A0-912.20
81Garden City6A1-812.18
82Smith Center1A11-111.70
83Maize South5A4-511.58
84Shawnee Mission North6A1-89.63
85St. Marys2A3-69.39
86Shawnee Mission South6A3-69.35
87Santa Fe Trail3A11-18.67
88Olpe1A7-38.23
89McPherson4A5-48.15
90Wellington4A8-37.86
91Thomas More Prep-Marian1A7-37.46
92Russell2A7-37.31
93Pittsburg5A4-56.53
94Beloit2A6-46.50
95Council Grove2A7-36.40
96Royal Valley2A3-66.39
97Labette County4A9-35.98
98Riley County2A2-65.66
99Frontenac3A8-24.90
100Wichita Heights6A1-84.82
101Inman1A8-24.40
102Ellsworth2A5-44.22
103Wichita Collegiate3A3-64.10
104Paola4A5-54.01
105Abilene4A5-43.82
106Hutchinson Trinity1A8-33.01
107Wellsville3A6-42.89
108Prairie View3A8-21.88
109Emporia5A2-71.30
110Riverside1A8-31.01
111Haven2A7-30.70
112Perry-Lecompton3A2-70.33
113Wichita South6A3-6-0.01
114Topeka6A3-6-0.33
115Clearwater3A2-6-0.36
116Chaparral3A5-4-0.60
117Louisburg4A3-6-0.74
118Hillsboro2A6-4-0.75
119Kansas City Washington5A7-2-0.78
120Cimarron2A4-5-1.28
121Hiawatha3A2-6-1.39
122Moundridge1A8-3-1.61
123Plainville1A3-5-1.84
124Concordia3A4-5-1.92
125Chanute4A5-5-2.02
126Lansing4A2-7-3.18
127Newton5A0-9-3.51
128Wichita Trinity Academy3A4-5-3.61
129Arkansas City4A2-7-4.52
130Ulysses4A3-6-5.90
131Shawnee Mission West6A1-8-6.06
132Chapman3A1-8-6.88
133Baldwin3A5-4-7.05
134Caney Valley2A9-2-7.40
135Campus6A0-9-7.74
136Goodland3A2-6-9.22
137Halstead2A2-7-9.28
138Centralia1A8-2-9.37
139Independence4A3-6-9.49
140Jefferson County North1A8-2-9.65
141Topeka Highland Park5A6-3-9.90
142Girard3A6-4-11.97
143Winfield4A1-8-12.13
144Marysville3A1-8-12.41
145Medicine Lodge1A4-5-13.16
146Republic County1A8-2-13.27
147Fort Scott4A3-6-13.58
148Colby3A3-6-13.73
149Kingman2A2-7-13.95
150Marion1A7-3-14.00
151Circle4A1-8-14.34
152Wabaunsee1A4-5-14.46
153Troy1A6-4-15.14
154Douglass2A3-6-15.69
155Atchison County2A4-6-17.34
156Minneapolis2A3-6-18.26
157Stanton County1A2-1-18.65
158Atchison4A5-4-19.43
159Parsons3A3-6-19.52
160Kansas City Turner5A1-8-20.79
161Topeka West5A1-8-21.10
162Conway Springs1A4-6-21.73
163Smoky Valley3A3-6-21.94
164Cair Paravel1A2-6-22.51
165Bishop Ward3A2-7-22.67
166Valley Heights1A4-5-23.63
167Kansas City Schlagle4A3-6-24.09
168Ellinwood1A5-4-24.09
169Lakin2A3-6-24.87
170Neodesha3A5-4-25.49
171Salina Sacred Heart1A5-4-25.54
172Bonner Springs4A1-8-25.96
173Baxter Springs3A3-5-26.13
174Riverton2A5-5-26.88
175Norton2A0-8-27.39
176Anderson County3A3-6-28.90
177Mission Valley1A4-5-28.95
178Oakley1A2-6-29.38
179Eureka2A6-3-29.79
180Columbus3A2-7-30.07
181Wichita West6A1-8-31.11
182Nickerson3A1-8-31.94
183Remington1A2-7-31.96
184South Sumner1A2-7-33.83
185Kansas City Sumner4A3-6-33.88
186Jayhawk Linn1A5-4-34.27
187Sedgwick1A2-7-34.87
188Oskaloosa2A2-6-35.34
189Burlington3A2-7-35.44
190Iola3A2-6-35.59
191Pleasanton1A4-5-35.60
192Larned2A0-8-36.00
193Cherryvale2A5-4-36.55
194McLouth1A3-6-37.12
195Lyons2A1-8-37.42
196Southwestern Heights2A2-7-38.06
197Onaga1A3-6-38.59
198Belle Plaine2A0-9-39.73
199Wichita North6A0-9-40.27
200El Dorado4A0-9-41.03
201Doniphan West1A2-7-41.51
202Maur Hill Prep1A3-6-42.90
203Humboldt2A3-6-45.26
204Galena2A3-6-45.65
205Field Kindley4A0-9-46.14
206Pleasant Ridge1A3-6-47.21
207Valley Falls1A1-8-49.67
208Bluestem2A3-5-49.68
209Horton1A0-9-50.03
210Southeast1A3-6-52.18
211Central Heights2A2-7-52.92
212Uniontown1A3-5-53.51
213Syracuse1A0-9-53.76
214Herington1A1-8-54.51
215Kansas City Harmon5A1-8-58.91
216Fredonia2A0-8-58.95
217Kansas City Wyandotte6A1-7-59.00
218West Franklin2A1-8-59.99
219Osawatomie3A0-8-60.80
220Maranatha Academy1A1-7-62.97
221Erie1A0-8-66.71
222Bennington1A0-9-70.33
ClassAverage RatingState ChampionRunner-Up
6A+16.55ManhattanOlathe Northwest
5A+16.84Salina CentralBasehor-Linwood
4A+0.70Kapaun Mt. CarmelBishop Miege
3A-1.75AndaleTopeka Hayden
2A-11.85Nemaha CentralSoutheast of Saline
1A-23.53SterlingRossville

That’s Why They Play the Games

6A state champ Manhattan had a 9.7% chance of winning state after the regular season ended. The Indians were a 4-seed and had to face a difficult path to even make the title game. Because of this, they had the fifth-best odds to win state, behind Maize, Wichita Northwest, Olathe West, and Gardner Edgerton.

5A state champ Salina Central had only a 0.3% chance of winning state at the beginning of the playoffs. Despite being the 2-seed in the western half of the bracket, the Mustangs had relatively-poor computer marks. Central had only the 12th-best odds of winning state in class 5A. Bolstered by a few upsets on their path, eventually they had to defeat a solid team and did so in the state semis, knocking off Great Bend. But when they got to state, they played Basehor-Linwood, a team which had the fifth-best computer rankings in the East at the end of the season. And while the computers say that a Mill Valley or St. Thomas Aquinas would be 2 touchdown favorites to Salina Central had they faced off, it was the Mustangs who took home the trophy.

4A state champ Kapaun Mt. Carmel dominated throughout the year and had a 55.6% chance of winning state at the beginning. This held.

3A state champ Andale (and the team ranked #1 in the state by our metrics) was expected to win 36.1% of the time. But the Indians only got better in their playoff run, dominating the rest of 3A to show that they are truly one of the state’s best. It would be great to see them compete against 5A/6A opponents during the regular season.

2A state champ Nemaha Central had a 17.6% chance of winning state when the playoffs began. They were the best team in the East, but the computers thought the West was stronger this year in 2A. But the title game proved otherwise. The Thunder dominated against Southeast of Saline to secure the crown.

1A state champ Sterling had decent odds to win state (13.5%) but 1A was wide open this year. Earning the #1 seed in the West, the Black Bears took down Rossville by 1 point in the title game.

2025 Football Win Projections Using ESPN’s FPI

KU finished the 2025 season at 5-7 (3-6).

Here is how KU did against the spread, moneyline, and ESPN FPI predictions.

The table should be easy to understand. KU Impl % means what the betting odds are saying in terms of how likely it is KU wins. FPI is ESPN’s implied prediction in terms of a number from 0 to 1.

Using ESPN’s FPI data, KU was projected to win the following number of games by week. This shows the progression, detailing how KU’s season went.

Before Game 18.188 estimated wins
Before Game 2 (1-0)8.289 estimated wins
Before Game 3 (2-0)7.885 estimated wins
Before Game 4 (2-1)7.268 estimated wins
Before Game 5 (3-1)7.939 estimated wins
Before Game 6 (3-2)6.924 estimated wins
Before Game 7 (4-2)7.349 estimated wins
Before Game 8 (4-3)6.790 estimated wins
Before Game 9 (4-4)5.937 estimated wins
Before Game 10 (5-4)5.906 estimated wins
Before Game 11 (5-5)5.534 estimated wins
Before Game 12 (5-6)5.171 estimated wins

The next table shows how likely it was that KU was going to a bowl game (technically 6+ wins) after x number of games.

RecordChance of 6+ wins
3-197.0%
3-292.5%
4-296.0%
4-390.4%
4-467.5%
5-467.1%
5-547.6%
5-617.1%

There is no sugar-coating things, this was a disappointing season. After the team begun well in Week 0 against a solid Mountain West team in Fresno State, winning 31-7 and jumping in the computers, Kansas dropped close games against Missouri and Cincinnati to sit at 3-2 heading to UCF. Despite being down at the half, the Hawks rallied and had some great defensive stops in the fourth quarter to win 27-20 and go to 4-2. At this point, KU had a 96% chance of winning 6 or more games.

But from here, things got worse. An embarrassing loss to Tech followed by another embarrassing loss to K-State. After getting Oklahoma State at home and winning, at 5-4 KU could salvage the season by winning just 1 more. But it wouldn’t be easy. KU dropped a game in which it had a fourth quarter lead at Arizona, didn’t show up against Iowa State in Ames, and then blew another lead in its season finale against Utah. When all is said in done, KU won’t go bowling for the second straight year despite high expectations coming into the season.

The biggest blown chances were certainly the following three games:

  • Cincinnati (34-37 final).
  • Arizona (20-24 final).
  • Utah (21-31 final).

Get any of these should-be wins, and the narrative is different. Now KU did win a close game against UCF in comeback fashion, so perhaps this mitigates things somewhat. But going 1-3 in these three games was a recipe for disaster.

An additional angle here is scheduling. With a 9-game conference schedule, choosing to play Missouri cost the team at a bowl bid. Had KU played a MAC or weaker C-USA team, KU likely would have won and got itself to 6 wins by going 3-0 in the non-con instead of 2-1. The same thing happened last year, when KU football decided to play against Illinois instead of scheduling an easier opponent. The difference between 6-6 and 5-7 is huge in college football, and once again KU will not be adding to its bowl history as it fails to qualify for one this season.

Analyzing LIV Golfers in the Majors

Utilizing Pre-Tournament odds has allowed us to “smooth” out a player’s career in majors by not just looking at the win/lose scenario of if a player won a certain major or not (which means he could finish anywhere from second to did not qualify). It has also served as the baseline for our major projections for golfers for future years. We can utilize the same data to look at how LIV golfers have done, collectively, both before and after joining LIV.

For now, we are going to focus on a group of 33 golfers who joined LIV either during the 2022 season or in the off-season just before 2023. These golfers all had to be 40 or younger when joining LIV, as we are excluding those who have clearly aged out of their primes and are far less likely to contend for major championships. We are testing hypotheses that posit that LIV Golf has been generally detrimental to players’ careers, but given that players in their 40’s are proven to decline, we don’t want to include this group so as to skew the data.

We wanted to compare common time-periods, so we looked at the majors from 2020 – 2022 (pre-LIV) and those from 2023 – 2025. Now, it is true that 2022 was when LIV began (between the PGA and U.S. Open), so there are some tournaments included in the pre-LIV time period that actually occurred after LIV had started. But we do want to note that no one who joined LIV during 2022 was hurt from major championship competition that season…OWGR points were in tact given they had been racking them up on Tour, many who went to LIV did so after the first event at some point, and majors didn’t pull any shenanigans like they did when the U.S.G.A. removed Talor Gooch’s spot at the 2023 Open because he wasn’t “eligible” to play at East Lake in the 2022 Tour Championship (despite Gooch accumulating enough points to finish in the top 30 regardless). So the entirety of 2022, at least in terms of who got into the majors and how they performed in them, were relatively unaffected by LIV.

By 2023, this had changed. Only those with exemptions such as recent major victories or the ability to earn OWGR points in other ways (playing a heavy schedule on the Euro Tour in the off-season) were getting into majors, with any LIV pathways non-existent. This has only worsened, with very few LIV golfers remaining in the Top 100 of the OWGR for much time.

Another caveat is that 2020 only had 3 majors, the British Open not being held due to the United Kingdom’s inane and overly-restrictive coronavirus measures. But 1 missed tournament out of 12 isn’t a huge difference so we’re mostly comparing apples-to-apples. Another point is that guys like Jon Rahm and Tyrrell Hatton are left off as they didn’t join until the 2024 season. While both are interesting before-and-after test cases, it would be too much extra work to try and account for them. Maybe next year.

The following table shows the players with the most expected majors from 2020 – 2022 who went to LIV, and then a comparison from 2023 – 2025.

Golfer2020-22 Exp. Mjrs.2023-25 Exp. Mjrs.Diff
Dustin Johnson0.5080.155-0.353
Bryson DeChambeau0.3670.402+0.035
Brooks Koepka0.3270.341+0.014
Cameron Smith0.2150.201-0.015
Patrick Reed0.1850.083-0.102
Louis Oosthuizen0.1570.025-0.132
Joaquin Niemann0.1190.180+0.061
Abraham Ancer0.0950.014-0.081
Marc Leishman0.0810.004-0.077
Jason Kokrak0.0680.003-0.065
Matthew Wolff0.0510.000-0.051
Sebastian Munoz0.0390.002-0.036
Harold Varner III0.0370.006-0.031
Kevin Na0.0330.003-0.030
Talor Gooch0.0320.033+0.001
Thomas Pieters0.0310.011-0.019
Branden Grace0.0290.005-0.025
Bernd Wiesberger0.0240.000-0.024
Mito Pereira0.0230.021-0.001
Matt Jones0.0220.000-0.022
Charl Schwartzel0.0200.007-0.013
Cameron Tringale0.0200.000-0.020
Carlos Ortiz0.0180.010-0.008
Martin Kaymer0.0180.003-0.014
Sam Horsfield0.0150.002-0.013
Brendan Steele0.0120.002-0.009
Dean Burmester0.0090.030+0.021
Danny Lee0.0050.000-0.005
Laurie Canter0.0040.012+0.008
Hudson Swafford0.0040.000-0.004
Anirban Lahiri0.0020.0020.000
Scott Vincent0.0010.001-0.001
Peter Uihlein0.0000.0000.000
TOTAL2.5691.560-1.009

On the whole, the trends don’t look good. Of the 33 players on or around their prime years during this period, moving to LIV affected their expected major wins by a full major, dropping the collective win estimates by about 40%. If we look more granularly, we see that only 6 golfers who joined LIV in 2022 or early 2023 boosted their market-derived major estimates, which comes to 18.2% of the total.

Like all debates surrounding the future of professional golf, this could be seen as proof for either side. The traditionalist, pro-PGA Tour side would point out that the data is undeniable, moving to LIV is more likely-than-not to harm your chance at winning a major. Sure, it might not hurt guys like Phil Mickelson or Lee Westwood–guys who have aged out of their primes and just want to cash in–but for those in their competitive years the extra pay comes with a steep opportunity cost to your reputation as a championship-worthy golfer.

On the other hand, the pro-LIV contingent could point out that much of this difference is due to LIV not getting a fair shake, that being excluded from majors is actually harming the game itself at the highest level. And they would be right to point out names like Talor Gooch and Sebastian Munoz. Gooch reached his prime right when LIV began, but being unfairly dismissed from the U.S. Open in 2023 soured his view of the majors as a pristine, pure, and fair level of competition. Gooch has played in only 4 majors since the beginning of 2023, and none in 2025, though he has remained a solid LIV player1. Munoz has been a solid-but-not-spectacular player on LIV, but his game (currently 51st on Data Golf) would almost certainly be good enough to get him into majors had continued to play on Tour. Other names like Lucas Herbert, Marc Leishman, Harold Varner III, and others would likely build major-championship expected win equity were there a fairer way to get into majors for LIV golfers.

Nevertheless, the fact remains that LIV has not been a solid way for players to grow or build their careers in the events that matter most. This may change, with younger guys like David Puig, Josele Ballester, Tom McKibbin, and Caleb Surratt now on LIV and competing well. Maybe by 2027, we’ll start seeing these guys contend in majors, highlighting that LIV is a viable path. LIV needs to get younger, but more importantly, it needs to find more pathways into the majors. At the moment, the only LIV-specific pathways into the majors are to be the top non-exempt player among the top 5 shortly before either the U.S. Open or the British.

Here are possible reasons why LIV Golfers from 2023-25 have been less competitive getting into majors and being viable contenders than they were pre-LIV.

  • The market is accounting for the fact these golfers haven’t been as good since moving to LIV, perhaps because LIV is less competitive.
  • The market is being unduly biased against LIV. Though we would doubt this would hold up long-term.
  • LIV guys have fewer ways to get into the majors.
  • The data itself has aging effects. Though those in the 40’s were excluded, there are probably more examples of players aging out of their primes (Johnson, Leishman, Grace) than there are those who aged into their primes (Niemann).
  • Selection bias is at hand, specifically with LIV selecting players who are at the tops of their games/peaks in 2022/23, and since golf has “churn” where players fluctuate and have up-swings and down-swings during their careers, it is inevitable that there will be more players who decline than those who improve.

More Specifics by Golfer

  • Brooks Koepka, who had a rough 2025, had more expected win equity 2023 – 2025 than from 2020 – 2022. This is a minor difference, and the fact the 2020 British Open wasn’t held is a factor.
  • Cam Smith, who peaked in 2022, hasn’t declined as much as people think. Smith wasn’t great in either 2020 or 2021, so his “decline” in 2023 and after isn’t necessarily unexpected. Going back to selection bias, LIV took Cam at his absolute peak. If Cam had stayed on the PGA Tour, there’s no reason to expect he wouldn’t have seen a similar “reversion-to-mean.”
  • Talor Gooch actually had more expected win equity from 2023 – 2025 than 2020 – 2022. We’ve spoken of Gooch being disillusioned after the 2023 U.S. Open, but in the events he has gotten into, the market has seen him as a somewhat serious challenger.
  • Bryson DeChambeau has clearly thrived under LIV. This isn’t to say he wouldn’t have played well had he stayed on Tour, though.
  • Dustin Johnson has dropped the most. While D.J. aged out of his prime (he’s now 41), the drop was far faster than we would have anticipated. LIV critics are probably right that he lost his competitive juice around 2022.
  • Patrick Reed is still a solid golfer, but he did see decline in recent years.
  • Louis Oosthuizen dropped fast.
  • Marc Leishman has been hurt by not getting into majors.

Actual Majors

LIV Golf has produced 2 major championships, the 2023 PGA with Brooks Koepka and the 2024 U.S. Open with Bryson DeChambeau. Both were major winners before their wins with LIV. We haven’t done this yet, but we would estimate that, if we include the likes of Jon Rahm, Tyrrell Hatton, etc. when they were signed and project major championships by LIV golfer since the league began, we’d estimate that LIV should have projected it would have about 3 majors by now. So LIV is likely underachieving a bit. But given how short of a time period we’re looking at (only 14 majors have been played since the advent of LIV Golf), this isn’t some cause for alarm.

  1. Gooch finished 11th in 2022, 1st in 2023, and 10th in 2024. He is currently 5th with one individual event to go for 2025. Objectively, he should be exempt into the majors for 2026. ↩︎

Future Major Projections for 2026

Major Projections for 2026:

GolferProj Wins
Scottie Scheffler0.52
Rory McIlroy0.31
Jon Rahm0.19
Xander Schauffele0.16
Bryson DeChambeau0.15
Collin Morikawa0.14
Ludvig Aberg0.13
Viktor Hovland0.10
Brooks Koepka0.09
Justin Thomas0.09
Joaquin Niemann0.09
Patrick Cantlay0.08
Tommy Fleetwood0.08
Jordan Spieth0.08
Hideki Matsuyama0.07
Cameron Smith0.06
Tyrrell Hatton0.06
Matt Fitzpatrick0.05
Sungjae Im0.05
Shane Lowry0.05
Cameron Young0.05
Tony Finau0.04
Tom Kim0.04
Sam Burns0.04
Corey Conners0.04
Min Woo Lee0.04
Sepp Straka0.03
Max Homa0.03
Wyndham Clark0.03
Russell Henley0.03
Dustin Johnson0.03
Robert MacIntyre0.03
Will Zalatoris0.03
Sahith Theegala0.03
Akshay Bhatia0.03
Si Woo Kim0.03
Patrick Reed0.03
Jason Day0.03
Nicolai Hojgaard0.02
Keegan Bradley0.02
Daniel Berger0.02
Harris English0.02
Rasmus Hojgaard0.02
Justin Rose0.02
Adam Scott0.02
Brian Harman0.02
Denny McCarthy0.02
Aaron Rai0.02
Byeong Hun An0.02
Rickie Fowler0.01

Major Projections from 2026 – on:

GolferProj Wins
Scottie Scheffler5.83
Jon Rahm1.84
Collin Morikawa1.72
Ludvig Aberg1.69
Rory McIlroy1.51
Tom Kim1.49
Xander Schauffele1.41
Bryson DeChambeau1.25
Viktor Hovland1.17
Joaquin Niemann1.07
Akshay Bhatia0.85
Justin Thomas0.80
Patrick Cantlay0.62
Jordan Spieth0.61
Sungjae Im0.59
Cameron Young0.55
Brooks Koepka0.53
Cameron Smith0.52
Hideki Matsuyama0.51
Tommy Fleetwood0.51
Matt Fitzpatrick0.50
Min Woo Lee0.48
Sam Burns0.47
Nicolai Hojgaard0.44
Tyrrell Hatton0.38
Rasmus Hojgaard0.36
Robert MacIntyre0.35
Will Zalatoris0.34
Sahith Theegala0.32
Corey Conners0.32
Sepp Straka0.29
Wyndham Clark0.28
Nick Dunlap0.28
Si Woo Kim0.26
Tom McKibbin0.25
Tony Finau0.24
Shane Lowry0.23
Max Homa0.20
Davis Thompson0.18
Russell Henley0.17
Aaron Rai0.16
Aldrich Potgieter0.14
Patrick Reed0.14
David Puig0.14
Daniel Berger0.14
Maverick McNealy0.13
Denny McCarthy0.13
Jackson Koivun0.13
Jason Day0.12
Ben Griffin0.12

Analysis

Scottie Scheffler clears both these lists, thanks to the fact he is entering into a golfer’s peak years (he is 29) and has produced consistently high major estimates in each of his past four seasons. In fact, his projection of 0.52 majors is actually less than either of his estimated totals in 2024 or 2025…if anything we are likely being too conservative for him in 2026.

Scheffler’s career projection is about 4 majors more than second-place Jon Rahm, again due to Scheffler’s age and consistency. There aren’t many comps for Scheffler’s potential career arc, especially when 1985 is our beginning point, but we should note that Tiger had quite a long and consistent run even into his 30’s. Despite a hiccup to his public persona and some injuries which lowered his perceived skill level in 2010 and 2011, Woods bounced back to have elite seasons in 2012 and 2013 (age 37 and 38 seasons) though he couldn’t close out major wins in either year. Thus it is very possible for Scottie, should he avoid off-course scandal and injury, to continue in more-or-less the same vein of play for roughly the next decade. We should also point out Phil Mickelson’s longevity as evidence that someone can continue putting up competitive seasons well into his 40’s and maybe even snag a major or two late in his career. Scheffler has a very realistic chance to get to 9 or even 10 majors in his career.

Tom Kim is another golfer worth talking about, mostly because he was someone we felt was over-projected in prior exercises. Kim’s 2025 season was worse than his 2023 or 2024 season, which at his young age looks like a set back and makes us wonder how good he will actually become. Kim is projected to win 1.49 majors over the course of his career, which does seem high but when compared to other golfers who were elite young is actually keeping with the mean.1 We will discuss more about the methodology in the section below.

How long Rory can continue his consistency is another interesting question. Rory has been one of the most consistently good golfers in modern history. He has consistently been in contention in majors, even during his dry spell of 2015 – 2024, in a way that cannot be said of many others in his generation. Turning 37 next season, Rory has reached the age where golfers begin to decline. Some don’t start doing so until their late 30’s or even early 40’s, but it does happen at some point. Now that he has the career grand slam, will he be motivated to try and win more? 2025 was Rory’s highest estimated major season, and we project 2026 won’t be too far behind.

The bounce back possibilities are keeping guys like Brooks Koepka and Cam Smith afloat. As each has won a major and been top picks over majors in recent seasons, the model still sees these guys as having potential for solid seasons in the future. Brooks is turning 36 next year which will lead to a decline, but he still has 16 more major chances before his age-40 season. For Cam, his missed cuts in all four majors might lower the market’s perception of him for 2026. But April 2026 is still a long way away.

Methodology

The model used to project future majors incorporated the following data:

  • Golfer’s historic market-derived estimated majors won in each past season
  • Golfer’s year of birth (age)
  • Field’s collective estimated majors by golfers’ ages since 1985
  • Actual golfers’ ages for all majors won since 1946
  • Field’s collective peak season by golfers’ ages since 1985
  • Estimated major share to ranking table for an average season
  • Actual career trends by age

The gist of the model is to use the market-derived estimated majors a player has over the course of the prior four seasons and then forecast what his market-derived estimated majors will be given his age and the typical “skill-curve” of a professional golfer. Golfers peak around ages 28-36, so golfers around 25 will generally see their predicted majors rise and plateau for their coming years while golfers around 35 will see their predicted majors decline as they age out of the typical prime seasons.

Following this, other adjustments are made. While younger golfers have the advantage of age, that is they have more years to rack up majors than older ones, we’ve found that there is less predictability for those who are younger. To account for this, a multiple is used which has the effect of boosting golfers age 28 and older while discounting those who are younger…particularly those younger than 26. We know that golfers peak around 31 on average, but for players who are elite early, there is a better chance they peak in their 20’s than 30’s (think Spieth). Golfers tend have periods of consistency from 28 to 36, barring injuries of course.

A preliminary projection is had, and we use this projection to compare how others golfers around that skill level and age have done throughout the rest of their careers, using logarithms. Three years of past data is used in order to get a better sampling of comparison golfers, and then an adjusted projection (normally lower than the preliminary projection) is arrived at. From here, these two projections are weighted together to form a final projection in terms of projected majors won for every future season a golfer has (until age 56).

Despite the name, the final projection isn’t truly final. Due to the fact each golfer is individually forecast, we need to ensure that collectively, the field of golfers have a forecast that arrives at a reasonable projection of total majors. For instance, if it turned out that we were projecting the field of golfers to have 5 major wins for 2026, this wouldn’t be accurate as there are only 4 majors that can be won in any given year. Using historic data, we find out that the number of estimated majors a field has for the following year is ~3.85. Which is to say that for all golfers who played in at least one major in 2025, we expect the market to estimate that they will win 3.85 of the 4 majors for 2026. So there is a little churn year-over-year, with there being 0.15 estimated majors for those in the majors in 2026 that didn’t play in 2025.2

As we progress into the future, we see the 2025 field’s number decrease. By 2035, we expect 1.69 majors to be won by those who played in at least one 2025 major. Using these estimated numbers of 2025 field majors won, we then devise multiples for each season…2026 is 3.85, 2027 is 3.69…and then use these multiples to adjust what our “final” player projections had.

The end result is a model which is hopefully the best projection as to how a golfer’s career will pan out…note that this is more of a projection of a golfer’s major championship estimates than his major championship wins. Now these two numbers should converge on the whole, but there are a lot of uncertainties per individual when it comes to winning major championships. Often luck plays a factor in determining if a golfer will win a major or not, and we don’t know who will clutch-up in the big events that are to be had.

Really what we are projecting is the market’s future sentiment of golfers, something that is not perfectly knowable. By 2035 it is a near certainty that there will be a top golfer who is not on our radar in 2025…we just don’t know who that is. We think Scheffler (age 39 season) will still be a formidable player given how good and consistent he is now. We think Tom Kim (age 33 season) has a chance to be good that year but we also note that there is more unpredictability with young players. Others will have almost completely aged out by then (Lowry, Henley) while others will likely be top-50 type players now in their 40’s (DeChambeau, Thomas, Hatton).

  1. In other words, Kim could win 1 or 2 majors as his projection suggests or he could become an elite 3+ major winner or he could completely crash out and never vie for a major championship the rest of his career. All of these are possibilities. ↩︎
  2. Since 2000 this has held true in reality, not just market-derived probabilities. J.J. Spaun won the 2025 U.S. Open despite not being in any of the majors in 2024. Keegan Bradley won the 2011 PGA in his first ever major, the 2003 PGA Champion Shaun Micheel didn’t play a major in 2002, and finally 2003 British Open Champion Ben Curtis was playing in his first major. This makes 4 majors won in 26 seasons, which works out to a number close to 0.15. ↩︎

College Program Rankings – Alltime

The following rankings are a weighted average of each school’s Football, Basketball, and Baseball program rankings. Football accounts for 50% of the ranking, Basketball 35%, and Baseball 15%. These weights were chosen to reflect the relative importance of Football compared to Basketball compared to Baseball. Football rankings run from 1869-2024, Basketball 1896-2025, and Baseball 1947-2025. While there are clear ways to objectively rank College Football and Basketball before the current playoff systems these sports now have, College Baseball begins with the College World Series.

KU is #16, which places it at the top of the new Big 12. Being one of the top programs in the second-most important sport helps elevate its weaker showing in the other two.

To compare two schools to one another, simply divide one’s Total rating from the other. So, KU at 0.3215 compared to Missouri at 0.1777 is 1.809 times better collectively in the three sports that actually matter. This is a slightly bigger gap than the one between KU and #1 Alabama (1.787).

2025 NCAA Baseball Tournament

The Kansas Jayhawks have made the NCAA Baseball Tournament for the sixth time in their history. Kansas earned a 2-seed, the highest seed of non-regional-hosts, and will travel to Fayetteville, Arkansas to play in that regional. Its first game is against Creighton at 7:00 pm on Friday, May 30.

It’s not easy to win a regional as a road team, as hosts (1-seeds) have won 66.8% of all regionals since 1999 (the first year of the 64-team format). 2’s have won 18.8% of regionals, 3’s 12.3%, and 4’s only 2.3%.

The betting odds for the Fayetteville regional have this skewed even higher in favor of host-team Arkansas, who is the #3 overall seed in the field and the betting favorites to win the College World Series.

  • 1. Arkansas – 79.45%
  • 2. Kansas – 11.35%
  • 3. Creighton – 6.98%
  • 4. North Dakota State – 2.21%

Even though KU has a difficult path ahead of it, the team has had a great season which includes a program-most 43 wins of which 26 are come-from-behind. This team is very capable of winning a regional.