Top 11 Player-Seasons in Kansas Basketball (Since ’93)

What makes a seasons special for an individual? Basketball is a team game so team success is and should be important, especially at Kansas. However, too often players who have an excellent year are more remembered for being on a disappointing team. Especially given the vagaries of a single-elimination tournament, team success should be but a factor when judging an individual’s overall year in the context of a program’s rich history.

We believe we’ve found the metric for this, or total Points Against Bubble (PAB). This value number is cumulative (not rated per possession or per game) so it has two broad components–actual player value and durability. Regarding the latter, durability includes player health, stamina, as well as games played…so a player who helps his team advance further in March will rise on the list. What we are asking is this. Which players over the past 34 seasons have helped Kansas win more basketball games in that one particular season they were truly great? In fact only one player is listed here more than once, indicating how difficult this is to land on.

The List (Sorted from Best Year)

RankPlayerSeasonClassPAB
1Frank Mason2017Sr.280.12
2Drew Gooden2002Jr.244.50
3Thomas Robinson2012Jr.229.69
4Raef LaFrentz1997Jr.221.97
5Nick Collison2003Sr.221.33
6Paul Pierce1998Jr.218.08
7Wayne Simien2005Sr.216.01
8Raef LaFrentz1998Sr.214.78
9Marcus Morris2011Jr.212.99
10Perry Ellis2016Sr.206.73
11Jalen Wilson2023RS Jr.203.42

This could also be called the “200 Club” as only players with a season above 200 PAB earn their ways on it. These players added 200 or more points of value more than an estimated “bubble-level” (think average Big 12 player) would.

Let’s recap each of these special years in order. First, Frank Mason was consensus NPOY in 2017 and earned this award. He played 1,301 minutes that year (sixth-most in this era), leading Kansas to a 1-seed and Elite 8 appearance. Mason was the engine driving that team. It was thin up front and the other good offensive weapons were either not yet in their college primes (Devonte’ Graham, Svi Mykhailiuk) or defensively poor and thus not quite as valuable as you might assume (Josh Jackson, Lagerald Vick). Frank’s value mark likely won’t get caught anytime soon. Aside from Danny Manning or Wilt Chamberlain’s prime, I doubt anyone else had a better season in his Kansas career than Frank did in ’17.

Drew Gooden’s 2002 season might surprise some at #2, and by a comfortable margin, but he was also on a team that went undefeated in the Big 12 regular season and made a Final 4. Gooden logged a lot of minutes (and rebounds) to go along with elite scoring. He was smooth and athletic against bigger players but big enough to dominate quicker smaller ones. This season earned him NABC NPOY honors.

Thomas Robinson led the Jayhawks to a national runner-up in 2012, with elite scoring and rebounding marks from the power forward position. He made a tremendous jump from just two years prior, when he was losing value when playing in limited minutes (his 2011 minutes backing up the Morris twins were actually solid, but nothing like his 2012). T-Rob benefitted by playing 39 games and being durable. He was a consensus First Team All-American and Big 12 Conference POY.

Raef LaFrentz makes this list twice, and it is his 1997 junior season that added more PAB than his senior campaign. This value score could have improved had his team gone further in the tournament like they were expected to, but nevertheless Raef was the best player on one of KU’s all-time best teams.

Nick Collison filled the void in 2003, not only replacing much production lost from teammate Drew Gooden’s departure to the NBA, but also sophomore Wayne Simien’s season-ending injury that thinned the front-line even more. Collison played in 81% of minutes that year, the most of any interior-focused player on this list. Collison’s solid offensive skill was buoyed by elite defense.

Paul Pierce in 1998 was an incredible player, and this season would launch him into being a lottery pick with a professional Hall of Fame career. The 1998 season was cut short far too soon (though it is tough to blame Pierce, he played well enough against Rhode Island), however since Kansas played a lot of games that year (39 due to scheduling abnormalities), Pierce got enough minutes in to fairly qualify for this list.

Wayne Simien in 2005 is notable because he was rated the best player on a per possession basis, estimated to be +14.39 PAB Per100 possessions. He was an elite college basketball player, who has nearly as many career PAB as Nick Collison does despite playing 1,070 fewer minutes. His ’05 season was cut very short (in an already shorter season), making his achievement of being on this list that much more spectacular. I feel it necessary to defend him even more, as against Bucknell his +8.99 value score led the team and was only one of two players on the floor who really played well that night.

Raef LaFrentz’s 1998 season puts the large southpaw on the list a second time, though this season was plagued by a broken hand that sidelined him (he missed 9 of the team’s 39 games). Like Pierce, he played well in his final college game, posting a +9.58 game score. His season on a per possession basis is second on the all-time (since ’93) list behind Simien’s ’05 campaign. The 1998 season was the only time that there have been 2 players to make the 200 Club.

Marcus Morris in 2011 was incredible, winning the Big 12 POY and earning 3rd team All-American honors. His brother Markieff was just as good (albeit in fewer minutes, which is why he sits at #12 and didn’t qualify for this list), but Marcus’s smooth offensive game helped KU get another 1-seed. He also played well in his final game, but his teammates certainly did not.

Perry Ellis makes the top 10 by having an underappreciated 2016 year, where he led that Jayhawks to a #1 overall seed and earned second-team All-American honors. Unlike most of the others on this list, Ellis performed poorly in his final game of the season, but KU would have never been where it was without his contributions.

Jalen Wilson’s 2023 season was the most recent one to make this list. A year after winning a National Championship, Wilson returned and led a new-look Hawks to another 1-seed and Big 12 Conference trophy. He was named Big 12 POY that season. Though a power forward, Wilson played quite a bit on the outside as well but added much value thanks to much-improved defense and incredible rebounding numbers for someone his size.

There are the top 11 player-seasons over recent KU basketball history. Since Jalen in 2023, no one has really gotten close, and it will likely take a truly elite scoring season to do so. Players with lower scoring marks who otherwise dominate in some other way to be solid value-players (think Marcus Garrett’s defense, Udoka Azubuike’s paint presence, Mario Chalmers’s defense and shooting) haven’t been able to get that close to 200 PAB. Others that missed by a small(ish) margin include Markieff Morris in 2011, Devonte’ Graham in 2018, Cole Aldrich in 2009, and Dedric Lawson in 2019. Devon Dotson missing up to 10 games in 2020 is also an interesting prospect, as him getting these 10 games and his current pace would have gotten him just above the threshold.

In closing, the list is mostly dominant post scorers, as this is where the biggest talent gap lies in college basketball. There are far more talented guards than there are truly talented bigs, and KU getting someone who can be an efficient volume scorer with solid rebounding/defending prowess has been how it has been able to dominate during the bulk of the past 34 seasons. Nevertheless, it is a point guard who tops this list.

2026 Season Recap – Value Metrics

With the National Championship game ending the 2026 college basketball season last night and the final adjustments made to the computer metrics, we can put a bow on the 2026 Kansas Jayhawks. The final value metrics have been posted, and now we will assess the season.

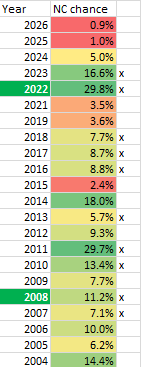
For the fourth year in a row, the program failed to reach the second weekend of the NCAA Tournament. While we don’t need to cloud the 2026 team’s positives and negatives with what much-different-looking past KU teams did, it is part of the narrative post-2022 championship.

Looking at average game score (which correlates strongly with Adjusted Efficiency metrics), KU was a +7.81 team in 2026. This is higher than any of the previous three seasons (+7.19 in ’25, +3.65 in ’24, and +6.65 in ’25). This team was also a bit better in clutch situations than the 2025 team, winning close games against Tennessee, TCU, and Texas Tech.

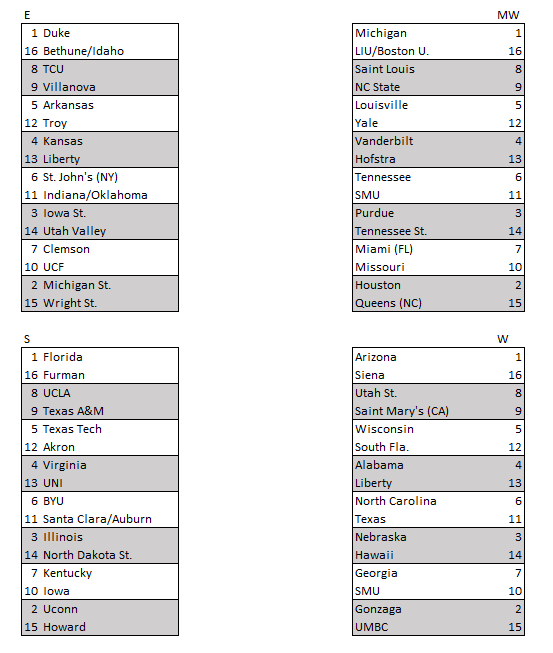
This game score was over 4 points better than our (admittedly conservative) preseason projection of +3.62. To speak in a more-understandable language; we had KU as a 7-seed coming into the season and the Hawks earned a 4-seed thanks to its regular season resume. KU was able to integrate the new guys fairly well in the early season, and actually dealt rather well without Darryn Peterson on the court. Strangely it was the team’s inability to play well with their star freshman that hurt their chances at a deep March run.

KU had to replace its entire starting lineup from the prior season, and it only brought back one rotation player from the previous year. I know the narrative surrounding the Hunter Dickinson era was mostly negative, but even in the portal era it isn’t easy to build a mostly brand new team and expect to be elite. Earning a 4-seed and being good enough to compete to make a second weekend was the most-realistic goal this team really should have had, but the way in which things turned out still seems sour.

The expectation of the 2026 team was that it would need to play around star freshman Darryn Peterson, but after his injuries started looking worse and there became more uncertainty around his availability, the team rallied to win some big games without him. KU rattled off 8 in a row during the midst of conference play, including huge wins against Iowa State, BYU, Texas Tech, and Arizona, making it seem like this year was going to be a better result come March. But, like the last few years, the team played poorly down the stretch.

Peterson, for his part, played great. We will get to individual performances later, but he was quite efficient given his high shot volume. It was the other starters who performed worse with him than they did in games without him. Council was +1.98 value points per game better in games without Peterson, White was +2.36, Bidunga was +3.42, and Tiller was +1.04. With fewer shots to go around for the others when Peterson was in, they failed to pick up the load in other areas, such as defense, assisting, rebounding, or good offensive movement. Kansas struggled to adjust to teams playing aggressive defense on Darryn, and this was reflected across the board with everyone adding less value.

How much of this is coaching is an open question this charting system cannot answer. Ultimately the team’s success comes down to the coaching staff, who recruits and develops the players, with this final judgment being on the head coach who makes the final decisions on these things and who also maintains his staff. We will say that KU’s offense has struggled in three recent seasons despite personnel turnover. It has been the 59th ranked (2024), 52nd ranked (2025), and now 58th ranked (2026) offense. Particularly this season, the ball movement wasn’t great when compared to watching other teams. The individual “factors” are tough to fully judge in relation to other teams due to the fact KU played a difficult schedule (third best nationally according to KenPom), but Kansas didn’t shoot it great, hit the offensive glass hard, or get to the line enough. Depth was an overlooked factor too as KU’s top four guys did finish as comfortably-positive offensive contributors. It was the remaining rotation players who were well-below bubble-level.

What follows is a recap of how each player did. Again, how much of this was due to the coaching staff either using or not using the player appropriately isn’t something we are answering. We will address players in the order they are listed on the 2026 page. Presumed starters at the beginning of the year followed by the rest of the rotation in terms of projected depth.

Darryn Peterson (Fr.)
Projected: +6.45 Per100 on 80% mins, +3.61 PPGAB
Actual: +11.86 Per100 on 49.4% mins, +5.82 PPGAB

As the most-hyped freshman in the Bill Self tenure, hopes were riding high on Peterson, and on paper he delivered with excellent value marks. We slotted him where a top recruit normally performs his freshman season, and Peterson surpassed what the others have done at Kansas. Darryn would wind up playing just shy of half the possible minutes there were due to ongoing injury issues, but he closed the season playing full minutes over the team’s final 9 games. He was there when the team really needed him to be. This should be the narrative about Peterson’s availability when we look back on this season.

As far as his value metrics in terms of KU history (since 1993), he will leave Lawrence posting the sixth-highest Per100 season (second-best among guards – 2017 Frank Mason) at the 98.2%ile. Peterson will post the second-highest offensive PPGAB mark (again 2017 Mason), doing so on high volume while maintaining team-level efficiency. He showed a remarkable ability to score the ball in individual situations. In his one season at Kansas, he posted +4.67 WAR and 139.74 PAB, the latter of which ranks as the best among all freshman one-and-dones and second behind only Dedric Lawson among one-year KU players since 1993. And all this despite Peterson playing half of the available minutes on the season.

Along with leading the 2026 team in Per100 and PPGAB, Peterson led the team in POCWAB despite missing 11 games. Of the 24 he played, he finished above-bubble in 20 of them with 5 of those being +10 value games. Peterson’s best game score of the season came against BYU (+14.76) when he helped the Jayhawks build up a huge lead in Allen Fieldhouse before he sat out with cramping for most of the second half. Darryn also had memorable moments helping KU win some games, including his clutch performance at the FT stripe against TCU (hitting the 3 FT’s to tie the game) and his two late threes to steal a win in Lubbock.

Did he match the hype? Most people will say no. But perhaps the hype was higher than it should have been. Darryn was KU’s most-valuable freshman talent since at least Danny Manning, and whatever pro career he ends up having will likely be quite successful. He wasn’t sitting out games because he wanted to, and when fully healthy gave Kansas good minutes down the stretch.

Melvin Council (Sr.)
Projected: +3.40 Per100 on 80% mins, +1.90 PPGAB
Actual: +6.06 Per100 on 86.3% mins, +3.57 PPGAB

In the preseason we hoped Council could be a hustle/energy guy alongside Peterson, and he provided more than that, particularly early, due to Peterson’s absence. Council gave Kansas durability and production, earning value marks that place him in the 81.8%ile among rotation players since 1993. He was essentially the value of 1996 Jacque Vaughn and did about everything you could ask for a one-year player. Council will grade out as the team’s best defender on a per game basis (and barely second-best on a Per100). He didn’t do anything flashy, he wasn’t someone who got a lot of steals, but he didn’t get beat or take possessions off. He played the game the right way and was rewarded for it in the value scores.

Melvin was the team MVP in 7 games, with his best performance famously coming against N.C. State in mid-December. Council finished with 36 points to lead KU to a 1-point OT win, earning a game score of +18.71. He also gained confidence by showing he could hit open 3’s and score when the team needed him to. Council didn’t play as well when Peterson returned, but he did eventually get things going in the team’s final game against St. John’s. Melvin finished with 15 points, 9 rebounds, and 4 assists in what could have been an all-time comeback.

Claiming the reputation of being a “dawg,” Melvin’s persistence and hustle throughout the season earned him this title and became a fan favorite. Council in one season will leave with as much WAR (+5.07) and PAB (+124.88) as Andrew Wiggins. Not bad for a one-year player.

Kohl Rosario (Fr.)
Projected: -4.70 Per100 on 40% mins, -1.32 PPGAB
Actual: -1.02 Per100 on 23.9% mins, -0.20 PPGAB

Rosario played enough early that he was the starting wing for the Jayhawks before losing both his starting job and role in the rotation. He didn’t shoot the ball well on the season from 3, finishing 18-63 (28.6%). Along with his limited offensive creation (13 total assists, 8 total FT attempts), the coaches looked elsewhere for minutes. After the first game of conference play, the only real extended court time he saw in high-leverage moments was against St. John’s when his energy helped bring the team back.

Despite shooting poorly from the outside, Rosario was a solid finisher in the paint when he had the opportunity to finish. He went 19-24 on 2’s, most of them dunks/putbacks, and his 26 offensive rebounds ranked him third on a per-minute basis. He was adequate taking care of the ball, so this also helped his value marks.

But it was on defense where he gained value, stingily allowing only 10.4 points per 60 possessions to add +3.05 points of value per 100 on this end. With his size and athleticism, he was able to guard multiple positions and discourage opponents from getting good looks.

For a true freshman who didn’t have the highest recruiting ranks (partly due to him “reclassifying”), he played well and looked the part athletically.

Tre White (Sr.)
Projected: +3.10 Per100 on 60% mins, +1.30 PPGAB
Actual: +3.89 Per100 on 77.8% mins, +2.06 PPGAB

Tre played a larger role than he had in prior seasons on prior teams, and a larger role than we had projected. He was KU’s best offensive weapon in the absence of Peterson, and one of the bigger regrets we should have with this team is that it couldn’t find a way for Tre to stay productive in the games Peterson was playing.

Still, White shot career highs from 3 (40.3%) and the free throw line (87.2%) this season. He added more value on offense than defense for a team that was limited on offense. He was a solid rebounder playing the hybrid 3/4 role and posted a positive defensive score for someone having to play a number of mismatches on that end.

White had 7 MVP games for the Jayhawks, though only 1 of those came after January. Beginning in conference play and on through the Tournament, Tre’s PPGAB score of +0.55 was far lower than his excellent start to the season in the non-con (+4.62). He didn’t play as well when Darryn came back and was taking more shots.

For a one-year player, Tre’s closest comparison is Zeke Mayo. KU could do much worse with a one-year veteran than they did with Tre White.

Flory Bidunga (Sr.)
Projected: +4.25 Per100 on 65% mins, +1.93 PPGAB
Actual: +6.86 Per100 on 77.5% mins, +3.62 PPGAB

Flory is our fifth player in a row to reach and exceed his Per100 and PPGAB projections, and where the team really benefited was in his ability to play extended minutes after a foul-plagued freshman season. Flo was deadly in the pick-n-roll, finishing on a number of lobs to fire up the crowd. Winning the Big12 defensive player of the year award, he was an extraordinary rim-protector and solid rebounder but someone who was likely a bit overvalued due to him being caught against a guard on the occasional switch. But of the top 7 players in terms of minutes played, he finished only slightly below Melvin Council for overall defense.

Bidunga had some excellent games and finished as the team MVP in 11. His best was against Baylor (+20.30) where he allowed only a single point to his defensive ledger. KU’s front court wasn’t deep in 2026, so Bidunga’s ability to play 25+ minutes in all but one game (a blow-out win against A&M CC) was very important.

Flo’s Per100 value this season put him in the 85.8%ile among Kansas rotation players since 1993, which is right alongside 2008 Darnell Jackson. He was very much a KU-level player as a sophomore, improving on his Per100 by 3.74 value points. Having played two seasons, Bidunga’s career marks in WAR rank 45th and PAB 38th.

Bryson Tiller (Fr.)
Projected: -5.36 Per100 on 25% mins, -0.94 PPGAB
Actual: -4.66 Per100 on 65.1% mins, -2.06 PPGAB

Tiller played a much bigger role for Kansas than expected. The freshman big had been injured the year prior and not much was known about his readiness, but he answered a lot of doubters early when he hit four 3’s against North Carolina to help KU build a halftime lead. Eventually he would win the starting job and KU would play big more than small, but it’s clear the coaches played him too much and he would eventually be exposed when facing up against more-experienced opponents.

Tiller’s Per100 marks were near or slightly better than where we’d think them to be given his recruiting ranks, but due to his minutes being so high, his per game marks were quite ugly (third-worst season among KU players since ’93).

Bryson has skill, but he has a long way to go to turn this into value. He didn’t have a single game where he finished as the team MVP and had 3 games where his unadjusted value score was worse than the final margin. The rest of the team only had 2 combined times where this happened. Bryson being overexposed is probably the worse thing for the 2026 team. Had it had a solid veteran piece that could play the 4, it would have been far better and gotten the best out of Tiller in a more-limited role.

Elmarko Jackson (RS So.)
Projected: -5.25 Per100 on 20% of mins, -0.74 PPGAB
Actual: -1.06 Per100 on 42.8% of mins, -0.32 PPGAB

Jackson is now the 7th player in a row to reach his value mark projection on Per100, and despite a slow start and infamous finish, he actually played much better this season than he did two seasons ago as a true freshman. Jackson shot 37.2% from 3, 82.5% from the line, and improved nearly everywhere (including defense) in the value metrics department.

Elmarko had his best game against Oklahoma State, scoring 14 to post his first career team MVP outing. He also had solid moments against Tennessee, UConn, and Kansas State (17, 11, and 19 points). While not really a true PG or SG, he filled in as a backup that could do a little of either, and he was certainly KU’s best option off the bench for that role.

Jackson still made some bad decisions this year, including his overly intense defense in the final possession of the season to give up a driving layup with only a few seconds left. But overall he wasn’t a terrible player for his role.

Jayden Dawson (Sr.)
Projected: -1.05 Per100 on 50% of mins, -0.37 PPGAB
Actual: -2.53 Per100 on 16.3% of mins, -0.41 PPGAB

An early transfer-portal signee, Dawson’s lack of playing time was surprising. But the senior could never really get going, shooting 27.9% from 3 on the season. The most points he scored in a game in a Jayhawk uniform was 7 against A&M CC in 20 minutes. He would play a season-high of 28 minutes against Duke a week later, but after this he wouldn’t do much.

Reputably a shooter, Dawson’s defense was the hidden asset of his game, and he would post the best coverage defense and overall Per100 defensive score among rotation players (those with 10%+ minutes played). He likely should have gotten more of a chance, but at the same time he never really did much to help KU win a game when he did play.

Jamari McDowell (RS So.)
Projected: -5.15 Per100 on 15% of mins, -0.54 PPGAG
Actual: -4.86 Per100 on 42.9% of mins, -1.42 PPGAB

Jamari improved his outside shooting quite a bit over his redshirt season, and for 2026 would go on to make 34.9% of his 3’s. He was a far better shooter at home than away from Allen Fieldhouse, however, and him playing as many minutes as he did was not a good thing for the team.

McDowell finished right at bubble-level defensively (-0.10 Per100) but his offense was plagued by low scoring marks and inability to do anything except shoot 3’s. Jamari did earn a team MVP game against Davidson, but he wasn’t consistently good enough throughout the season.

Self went with someone he knew for that final bench spot in the rotation, preferring to play the third year in the program guy over any of the incomers, and this may have hurt the team’s chances in March.

Paul Mbiya (Fr.)
Projected: -6.41 Per100 on 20% of mins, -0.90 PPGAB
Actual: -3.81 Per100 on 7.5% of mins, -0.33 PPGAB

Mbiya emerged later in the year after not playing much early, posting his two-highest games played in the NCAA Tournament (16 and 13 minutes). Still very raw, he struggled to show much offensive skill but his size and knack for the ball proved valuable on the glass (+5.65 total rebounding point value Per100, highest on the team). He also had a nice basket against Tennessee in the Player’s Era Tournament to help KU get a huge non-conference win.

Paul’s best game came against Cal Baptist in the Round of 64, scoring 8 points and getting credit for some possessions won that the official box score didn’t catch. Another “what if” scenario to this season is his development…had he developed a bit earlier could he have helped the team find a bit more success?

Samis Calderon (Fr.)
Projected: -5.64 Per100 on 20% of mins, -0.79 PPGAB
Actual: -13.62 Per100 on 4.7% of mins, -0.95 PPGAB

Calderon’s game was more perimeter based than we initially thought, but just as with most of the other freshmen his offensive game was far too underdeveloped to be of much help. He scored 6 total points this season, with only 1 of those coming after the new year, with his 14 minutes against Towson being the high mark of playing time all year. Self would try him on occasion if others were struggling, but his 3 minutes against TCU kind of ended that experiment.

Samis wasn’t ready to perform at this level. We were a bit surprised given some of the reputation he came in with.

Nginyu Ngala (Sr.)
Projected: -6.04 Per100 on 15% of mins, -0.63 PPGAB
Actual: +5.45 Per100 on 2.8% of mins, +0.31 PPGAB

We weren’t sure at all how to forecast Ngala, but it ended up not mattering as he really didn’t play. When he did appear in the early season buy games, he played exceptionally well, scoring 16 points over 19 minutes of action against Green Bay, A&M CC, and Princeton. He wouldn’t score again the rest of the season.

Ngala’s only real high-leverage minutes came against Syracuse for a brief spell and (sort of) against K-State on Senior Day at the beginning. Undersized, he wasn’t really taken advantage of much while on defense (+6.94 Per100 defensively), though this was certainly sample-size related. What we liked about Gee was his ball-skills. It’s unfortunate KU couldn’t find a way to use his dribbling, passing, and shooting abilities; particularly in games where the team struggled to take care of the ball or run effective offense.

Final Thoughts on Projections vs. Actuals

The initial projections were made with a lot of uncertainty due to the number of new guys on the team, and this uncertainty wasn’t just on the value-points end but also on the minutes-played end. We realized quite early that Tiller was going to be the second-most-played big on the team and that Jayden Dawson’s injury put his status up in the air. But we were also fooled into thinking that Rosario would play more than we projected (he wound up losing the starting role and playing far less in conference play). For future seasons, there’s likely not much more we can do. Perhaps we should shift the projections to after the preseason games as this would help with accuracy, though one point to doing projections is to take a look at the team before knowing much about them. It’s good to see the difference in perspective from beginning to end of the season. We aren’t trying to bat 1.000, we’re more trying to show how much a season of play can change our minds about certain players.

It’s weird to say that KU’s individuals mostly exceeded expectation while the team barely did, but that’s kind of what happened. We did caveat the projections by mentioning that we expected those beating expectation to get more minutes, which meant adding a reversion up factor to the final team estimate. But if anything, KU may have lost out on potential value due to playing time decisions. Bryson Tiller playing 65.1% of minutes vs. Kohl Rosario at 23.9% of minutes seems to be one glaring misstep here, particularly after Rosario’s energy helped spur a late comeback in the Round of 32 game. Jayden Dawson probably should have played more and Jamari McDowell less. Would more of Paul Mbiya earlier on have changed the team’s fortunes any? Tough to say, but he stepped up when called upon in the NCAA Tournament.

Another area we will keep a close eye on is the shifting trend in college basketball where there are more dominant teams relative to the average D1 team. Simply put, the transfer portal and NIL era has tilted the balance of power more toward the power conference teams, and compared to average the typical bubble team and typical 1-seed has gotten stronger. This trickles down to the individual level as well when thinking of the hypothetical “above-bubble” player we use as a benchmark. For KU in 2026, the team might have been a touch stronger relative to the field in past seasons. Its final KenPom mark of +24.15 was actually higher than its final mark in 2023, when it was +22.85 as a 1-seed and regular season Big 12 Champions. For all the talk of this team being down, it wasn’t that far off from other Jayhawk teams in the Bill Self era. But gone are the days where you can win enough games without a truly-loaded roster. Your worst starter and main bench pieces have to be better than what Tiller, Jackson, and McDowell provided.

KU’s NCAA Tournament Paths Throughout the Years

The difficulty of winning 6 games in March/April and reaching the pinnacle of the sport can differ on the year. For a team to maximize its chances of cutting down the nets, it is helpful to have a high seed but also to get some breaks along the way with upsets and good matchups in the bracket.

Since 2004 and the beginning of the Bill Self era, Kansas has been to 4 Final Fours and won 2 National Championships. Thinking back on the past 22 tournaments, fans will tend to rue the missed opportunities such as 2011’s Elite 8 loss but often ignore breaks such as the 2022 path (which saw easier-than-expected games at each level along the way). What we want to analyze is exactly how many Final 4 appearances and National Championships KU fans should have reasonably expected during this period and compare to what was actually achieved.

To do so, we mapped out each of KU’s paths from the 2004 tournament through 2026. Now obviously KU didn’t appear in all of the games or face all of these opponents. But, had they continued to win, we looked at who their opponent would have been in that round. From here, we estimate KU’s chances of winning by using the final KenPom adjusted efficiency marks for both teams and historic winning percentages. In years where there is chalk–favorites winning along the path–KU’s odds of making the Final Four let alone winning the Title are much smaller.

KU Throughout the Years

Kansas has an estimated 4.44 Final Fours over this period, indicating the team has underachieved slightly (4 actual Final Fours). The odds the team makes the final weekend range from as low as 1.3% (2024) to 68.3% (2008). The table below lists each season in reverse chronological order.

An “x” marks the years KU earned a 1-seed, years that should presumably be easier paths to the Final Four. Of the 10 seasons that KU has gotten a top seed, the Jayhawks have an expected 3.31 Final Fours (with 3 actual trips to the F4 as 1’s). Color-coding makes things really stand out. Whereas the program had a run of more green/yellow from around 2007 – 2018, since that time the program hasn’t had favorable paths to the Final Four. The last three years in particular have been mostly helpless. KU had only 0.05 expected F4’s over this span.

One thing to note is that these paths are heavily dependent on KU’s relative strength as a team. The ’08 team didn’t just face a favorable path to San Antonio, it was also the best Kansas team in the KenPom era (according to KP). In order to isolate which paths were most favorable independent of KU’s own relative strength, we changed the odds to reflect a KenPom rating of 30.00 instead of whatever KU’s rating was that season. This changes up the numbers a bit, allowing us to isolate which paths were truly easiest or most difficult based on opponent quality.

Historically, a 30-rated KP team is usually a 1-seed and has some of the best odds to cut down the nets in April of anyone that year. Given KU’s paths, we can see that such a team has as high of odds as 61.9% and as low as odd as 8.5% regarding making the Final Four. Of any of the seasons KU actually did make the Final Four, the odds of a KP30 team doing so were at least 29.1% (2018). So KU’s actual success in March has been helped by favorable paths in those seasons. We can also see that benefit to being a 1-seed with the average odds for a KP30 team with a 1-seed in KU’s paths being 37.9% (keeping with historic F4 odds for 1’s) while for non-1-seed paths the average odds of a Final Four drops to 24.0%.

Looking again at just the three most-recent seasons, a KP30 team in KU’s spots in the brackets would have been expected to make just 0.35 Final Fours1. KU’s success, or lack thereof in recent NCAA Tournaments isn’t solely due to them having down seasons; its also due to more-difficult paths, though this is in part due to them playing tougher paths because of worser seeds. But KU also had 4-seeds in 2004 (47.8%) and 2006 (26.5%) with far more-favorable paths than what they’ve seen recently.

The next thing we will examine is KU’s likelihood of winning a National Championship. Same exercise as before, but now we are factoring in the odds KU also wins the final two games of its would-be NCAA Tournament paths.

KU has had four real chances to win a title and converted on two of them. If we add all of the odds together, KU is expected 1.31 National Championships over this span. I don’t think enough fans recognize how solid 2 NC’s over this period has been. It’s difficult to win 6 games in a row in this tournament. Again, KU’s paths have been more achievable win the team earns a 1-seed. The only two seasons where a non-1-seed Kansas team had a better than 2% chance of winning the Title was 2014 and 2012.

If we strip away KU’s actual strength and look at the paths to the Title from a KP30 team, we see the easiest paths of 2022 and 2011 still only result in a national championship less than 30% of the time. It pays to be a 1-seed, but not all 1-seed paths are equal. 2013 was especially difficult with 4-seed Michigan (#4 overall on KP) and potentially 3-seeded Florida (#2 overall) along the way.

2025 and 2026 were the hardest seasons for a KP30 team, not just because KU was in tougher spots in the bracket as a 7-seed and a 4-seed, but also because of how much better elite teams have gotten. Just reaching the level of 30.00 no longer guarantees a team a 1-seed (2025 saw a record-tying 6 teams with an adjusted efficiency of 30.00 and 2026 will have 8 or perhaps 9 teams reach this mark).

Looking at a few other seasons, the 2014 one stands out as a potentially-doable run given a few breaks (this was the season where 7-seed UConn beat 8-seed Kentucky for the National Championship). With a healthy Embiid, perhaps Kansas makes more noise. Considering KU was a 2-seed in the same exact spot just a year later, the 2.4% probability of 2015 shows just how much things can differ season-to-season. 2008 slips quite a bit when we compare it to other seasons, proving that the strength of that Jayhawk team really helped it secure the title. 2023 was the last time KU had a real chance, with difficult games in the regional (UConn/Gonzaga) being counteracted by potentially easier games in the F4 and CG rounds (Miami FL/San Diego St.).

In closing, a KenPom team rated 30.00 and given KU’s path in each of the last 22 brackets would be expected to win 2.21 NC’s and go to 6.68 F4’s. In order to arrive at the actual NC’s KU has won in the Self era (2), a hypothetical replacement team with the same KP rating each season would need to be +29.47. For 4 Final Fours, this number is lower (+25.57) but still very good overall.

  1. This works out to a 32% chance of at least one Final Four. ↩︎

2026 NCAA Tournament – First Round Preview

Note: First posted 3/18/2026.

The 2026 NCAA Tournament is underway with First Four games having been played yesterday and later this evening. While we don’t have the final lines for the R64 for Tennessee’s opponent (either Miami (OH) or SMU) or Florida’s (Prairie View/Lehigh), we do have opening round lines for the other 30 games. 3/19 update: Miami and Prairie View won.

First, let’s look at the historic winning percentage and point differential for all favored seeds in the First Round.

This is since 1985, so 40 tournaments’ worth. The 1-seed’s average margin is 23.8 points and so on. Let’s now look at the current average betting lines by better seed for 2026 (includes all R64 games):

  • 1 v. 16: -31.3
  • 2 v. 15: -23.5
  • 3 v. 14: -20.0
  • 4 v. 13: -13.8
  • 5 v. 12: -10.0
  • 6 v. 11: -5.3
  • 7 v. 10: -3.4
  • 8 v. 9: -0.3

This is further evidence of a college basketball trend many have been noticing, namely the growing chasm between the very best of the sport and the rest of the sport. While the opening round games between seeds 6 through 11 are in keeping with the historic gaps of these spots, seeds 5 or better are stronger relative to the worse seeds than they’ve historically been. There is almost no chance a 16 knocks off a 1 this season, and moving on down we can see that the 2/15 matchup in 2026 is basically a 1/16 matchup in previous seasons, a 3/14 matchup is a surer result in favor of the better team than a typical 2/15 game, and the 4/13 matchup this year is expected to be somewhere in the middle of a typical 2/15 slash 3/14 First Round contest. While a 12-over-5 upset wouldn’t be shocking this year1, even this gap is noticeably wider compared to prior seasons.

The years 2000, 2004, 2007, 2017, and 2025 are unique in that they are the only ones where no seed worse than a 12 won an opening round game (in 2000 and 2007 all 12’s won their R64 games as well). There is a good chance this happens again. Using the historic line to winning percentage table, we estimate the chance that all top four seeds advance to the weekend at 56.6%. For something that has happened only 12.5% of the time, the projected chalkiness of the 2026 bracket is notable2.

Potential Evolution of the Tournament

We plan on writing more of the phenomenon later, but essentially what is happening is that the best, richest programs are acquiring non-power conference talent from the portal during the offseason and this not only makes the good teams better it makes the mid and low-majors worse. We can see this through KenPom data; currently there are 8 teams with an AdjEM of +30.00 or better, which would be an all-time high. Last season there were 6 teams, which at the time was tied for the highest number in all seasons since 1997. Going all the way back to 2023 (I know, so long ago) there were exactly 0 at season’s end reach that +30.00 threshold. And this was hardly some outlier, in 2022 there was only 1.

Good teams are getting better, and the winners of one-bid leagues (seeds 12 on down) are getting worse. The gap is widening from both directions.

If this continues, we project this will create an evolution in the Tournament. Less exciting will be the First Round games, where chalk predominates more years than not (though upsets when they do occur will become more appreciated), but games in the Second Round and later will see better matchups and more madness. More 4/5 coin-flip games. Fewer 14’s and 15’s getting beat in the R32 by double digits, so the 2’s playing the 7/10 winner and 3’s playing the 6/11 winner will be competitive.

The first time the Round of 64 saw all 5-seeds and better win (2000), we saw two 8-seeds and a 5-seed make the Final Four. Interestingly, the growing gap doesn’t really help the 1-seeds, who have historically already been dominant in the first weekend. Instead, it seeds 2-5 secure a more-likely First Round victory and better odds to make the Final Four. 1-seeds who have to face the 4/5 in the S16 and (more likely) a 2/3 in the E8 are going to get to the final weekend less often than they do when they get a break somewhere in the bracket3.

Closing Thoughts

Assuming the 68-team bracket in its current iteration persists, and we hope it does, there will likely be a push from fans for more upsets, and at some point we hope more regulation when it comes to player movement and NIL. There is still the potential for more mid-majors to grow into competitive teams (think McNeese recently) which helps shore up the bottom of the bracket more. We might even see one-bid leagues manipulate their conference tournaments more to protect the higher seeds, so that the ASUN for instance sends Central Arkansas (KP #152) instead of Queens (#183), which would help when it comes to opening round upset potential.

  1. ESPN BPI projects that all 5-seeds win 43.2% of the time, with the 5-seeds earning a collective 0.76 estimated wins. Only 6 times out of 40 (15%) have the 5-seeds gone 4-0 against the 12’s. ↩︎
  2. If we include 5-seeds, the chances that all of the top 20 teams win their R64 games is 27.5%. Given the historic precedent is 5.0%, this is a five-fold increase. ↩︎
  3. The 1-seeds are 24-0 against 12/13 seeds in the S16 and 21-7 against seeds 6/7/10/11 in the E8. When playing the 4/5 in the S16, the 1’s are 83-29 (74.1%). When playing the 2/3 in the E8, the 1’s are 45-34 (57.0%). 1’s have disproportionately enjoyed better paths with earlier-round upsets than other seeds, so as this changes expect there to be fewer 1’s make Final Fours. ↩︎

Tournament Preview 2026 – Kansas Jayhawks Path

KU received a 4-seed on Selection Sunday and will face 13-seed Cal Baptist on Friday night. Here are some listed chances for a KU Round of 64 win:

  • KU -14.5 points (implied 93.0% looking at historic lines)
  • KU ML -1200/+750 CBU (implied 88.7% looking at equal expected $ outcome)
  • ESPN BPI: 92.6%
  • KenPom: 86.7%
  • Torvik: 85.4%
  • EvanMiya: 92.4%
  • Historic 4 over 13: 79.4%

The range spans from under 80% to 93% depending on source. 4-seeds have won almost exactly 4 of 5 First Round games since 1985, but this year the gap between the top teams and bottom teams is wider than average. This doesn’t guarantee Kansas a win of course, but it does provide more margin of error for the Jayhawks. Should KU go on to win that one, here are some odds for KU’s success moving forward by successive round.

SourceR32S16E8F4CGNC
KenPom86.7%45.5%11.4%5.1%1.7%0.5%
Torvik85.4%43.0%10.9%4.9%1.5%0.5%
Miya92.4%40.4%8.0%3.7%0.9%0.2%

The betting odds imply a KU national championship 0.8% of the time, a bit higher than these models but still quite low.

So expectations are low (and should be). But KU has a real chance to make the second weekend, and as a 4-seed should be expecting to do so, and after that they just need to believe anything can happen. KU’s path isn’t unfair or harder than it should be or something. They just need to show up and play hard.

Grading the Committee – 2026

The NCAA Tournament officially starts tonight, 3/17/2026 with the First Four (play in) games. For the last few seasons we have been grading how the committee did in selecting and seeding the field. The exercise below is similar. In order to grade the committee, we aren’t comparing them to how we think they should have seeded the field, rather we are seeing how consistently they applied their preferences throughout the bracket. Consistency is found by correlating the final S-curve to a weighted-model ranking and playing around with the inputs until the closest correlation (highest R²) can be found.

The committee uses team sheets to help it compare the various teams it reviews. The team sheet contains quite a bit of information, which we’ve divided into four different components. These components are essentially:

  • Schedule strength
  • Raw winning percentage
  • Success by Quadrants
  • Metrics

Within these components, sub-components are present. Each component will show the overall weight the committee inherently applied to the 2026 bracket. Also, each of the components will be explored in more detailed based upon what the committee members are looking at when they sit down to select and seed the field of 68 each March.

Schedule Strength (1.0%)

The committee looks at overall SOS but also sees each team’s conference and non-conference SOS ranks. The overall SOS is most important, but the committee has also historically looked at non-con SOS as it is within a team’s control to play a tournament-worthy non-con SOS. For 2026, the schedule component was relatively small (1%), but it did have some predictive power.

Raw Winning Percentage (2.9%)

This component is unique in two ways. First, it doesn’t have sub-components. Its just a teams overall record (in D-1 games). Second, it arguably should be 0%. Yes, the 1-seeds will have higher raw winning percentages than teams lower down on the S-curve, but this should accounted for by other components.

Miami (OH)’s 28-1 record and inclusion into the field (S-curve ranking of 44) helps draw this number up. At 2.9% the number is low enough that we aren’t too concerned that it was factored into the committee’s decision making, but any higher and we would be getting worried.

Success by Quadrants (30.9%)

The team sheet as well as the source website used to run our calculations show each prospective team’s results by Quadrant, from Quad 1 to Quad 4. Pundits will often compare “blind resumes” which show a team’s Quad 1 results compared to another team’s to argue or support the inclusion of a certain team over another. While many data analysts have argued against the usage of quadrants, the committee very much sees them and does weight them.

The components we used this year were three-fold. First was Q1 results (both overall wins and winning percentage). Second was Q1+Q2 results (again both overall wins and winning percentage). Third was the effect of bad losses (Q3 and Q4). This approximates how the committee likely looks at these metrics. They are impressed with both quantity and quality in terms of the top wins, but in terms of the easier games, want to just make sure teams are avoiding bad losses.

Interestingly for 2026, the committee was far more impressed with Q1+Q2 results (26.4%) than just Q1 results alone (4.5%). Bringing in Q2 games at a higher weight helped teams like UConn (7-3 in Q1 but 18-4 in Q1+Q2) and Iowa State (8-7 in Q1 but 18-7 in Q1+Q2).

Lastly, the bad loss sub-component was incorporated as a multiple to the first two components. We toggled this multiple on and off to see if it had an effect, and it did so we kept it as a sub-component.

Computer Metrics (65.2%)

The computer rankings made up nearly 2/3 of the input the committee considered. This is up from last season (55.7%) and the season before (58.5%).

We divided the metrics into the two buckets the committee basically does–efficiency metrics and resume metrics. The efficiency metrics include: NET, KenPom, Torvik, and BPI. The resume metrics include: WAB, SOR, and KPI. The metrics are weighted more toward the NCAA’s internal metrics (NET and WAB), but each listed number on the team sheet is included as they are what the committee members see.

The split between efficiency metrics and resume metrics was 32.1% and 33.1% respectively. The committee looked at both elements, how well a team did at winning games and how well they won these games. Arguably the resume metrics should be far higher than efficiency metrics, but both are quite correlated to one another regardless so this isn’t so bad.

Correlation to S-Curve

The R² was 0.9694 this season, making it better than 2025 (0.9489) and 2024 (0.8793). Compared to prior recent iterations, the committee in 2026 did a good job. Let’s look at where it was off the most

Teams Over-seeded by the Committee

Given the preferences the committee had, these three teams are finding themselves with better spots on the S-curve than they likely should have been:

Illinois (10 on the S-curve, 16 on the weighted-model)

The Illini have very strong resume metrics (8 in NET, 6 in KenPom) but their Q1 results (7-8) and resume metrics (18 in WAB) leave much to be desired. This resulted in the difference of a seed, from 4 to 3. How to handle strong teams with poorer resumes is going to always be a question the committee has to deal with, but here it seems like they over-borrowed from the efficiency metric side compared to how they were doing so elsewhere.

Kentucky (25 on S-curve, 29 on weighted-model)

Mark Pope’s team got the top 7-seed instead of the top 8-seed, helping the Wildcats avoid a potential R32 matchup against an elite 1-seed (not that their second round game against Iowa State would be easy). Kentucky was hovering around the last 7-seed/first 8-seed spot aside from its strong SOS metric (6th overall). They may have gotten a name-brand boost as well. Not egregious, but nevertheless helpful for UK.

Texas (42 on S-curve, 48 on weighted-model)

This one may be the most controversial. Not only was it a six spot difference, it also vaulted the Longhorns into the bracket instead of San Diego State (45 on weighted model) or Oklahoma (46). The Longhorns are 17-14 (they also have one non-D1 win) which includes a Q3 loss against a decent (23rd overall) SOS. Their combined resume metrics placed them in 48th, below even Auburn (44th). While nearly every bracketologist got this pick correct, it is weird Texas so easily got into the field.

Teams Under-seeded by the Committee

Just as three teams were over-seeded, we found three under-seeded teams for 2026:

Vanderbilt (17 on S-curve, 10 on the weighted-model)

The Commodores knocked of Florida in the SEC Tournament and finished as runners-up to Arkansas, but only reached the spot of the final 5-seed. Others have noticed how indefensible it is for Vandy to be a 5-seed. Looking at the weighted model, the only ranking where Vandy was worse than a top 12 team was in the lowly-correlated overall winning percentage (29) and SOS (20) components…but even there they weren’t egregiously an outlier. KU might have gotten a break to get a 4-seed, because objectively Vanderbilt should have been in front of the Jayhawks.

Utah State (33 on S-curve, 25 on the weighted-model)

Utah State was not happy with its seeding when announced on Sunday, and while it is common to hear complaints this time of year so at first we weren’t necessarily sympathetic to the Aggies, we’re now in complete agreement with them. Not only should Utah State have been a 7-seed instead of a 9, they should have comfortably been on the 7-line. Like Kentucky above who got promoted, the difference isn’t necessarily negligible in that the second round game is more winnable when playing a 2-seed instead of a 1 (Arizona is the 1-seed in Utah State’s potential path). Historically speaking, since 1985 the winner of the 7/10 game has gone on to win the R32 game 54 times for a Sweet 16 success rate of 34%. The winner of the 8/9 game, who almost always plays the 1-seed, gets to the Sweet 16 only 15% of the time.

In terms of the components, Utah State had a lower SOS component (89), and its Q3 loss didn’t help it. Still, an overall Q1+Q2 record of 13-5 to go along with decent metrics (30 in efficiency, 29 in resume) should have had it higher on the S-curve than it was.

San Diego State (49 on S-curve, 45 on the weighted-model)

It was only four spots, but the Aztecs have a case for inclusion into March Madness based on how the committee seeded the field elsewhere. They didn’t have any exceptional metric or component, but cumulatively they were within the top 45 teams. SDSU was 9-10 in Q1+Q2 games which hurt, but other first four teams (Texas was 7-13, SMU was 9-13, NC State was 11-12) were likewise not very impressive. While it wouldn’t have got them in, having SDSU in front of Oklahoma (19-15) and Auburn (17-16), the first two teams out, would have better recognized the Aztecs’ 21-11 record against way worse records from power conference teams.

Bracket Matrix

Just as with last season, the Bracket Matrix was more consistent than the committee itself despite not establishing the preferences we used to best fit the committee to a weighted model. We were able to get an R² of 0.9780 when we compared the Bracket Matrix’s S-curve compared to the weighted model that fit best to the actual S-curve. The Bracket Matrix consensus had Vandy as a 4-seed (and more 3-seeds than 5-seeds in various mock brackets) and an overall ranking of #14. It also had Utah State (#30 overall) a bit better than the official committee did.

The consensus bracket also had all 68 teams correct (well, 37 at-larges). Auburn was in 16% of the mock brackets, the highest for any team to miss the field. Texas had the lowest odds according to the Bracket Matrix, but it was still in 80% of mocks on Selection Sunday.

In total, very little controversy compared to most years. The committee was more consistent than it had been in prior years though its preferences did shift some. The biggest misses were in the area of seeding, but even here it only really had an effect on a few teams.

Bracketology 2026 – Weighting Team Sheets

The NCAA Tournament selection committee uses Team Sheets and a number of metrics and data to determine how to seed the bracket, and we’ve graded them on this by seeing how consistent they’ve been at applying a standard across the board. Using this same idea, that applying a hidden weighting system to the pool of D1 teams will produce an unbiased S-curve ranking, we have created a mock bracket. As of end of games Tuesday, 3/10/2026.

Below is the S-curve.

  1. Duke
  2. Michigan
  3. Arizona
  4. Florida
  5. UConn
  6. Houston
  7. Michigan St.
  8. Gonzaga
  9. Nebraska
  10. Illinois
  11. Iowa St.
  12. Purdue
  13. Vanderbilt
  14. Alabama
  15. Virginia
  16. Kansas
  17. Texas Tech
  18. Arkansas
  19. Louisville
  20. Wisconsin
  21. North Carolina
  22. St. John’s (NY)
  23. BYU
  24. Tennessee
  25. Miami (FL)
  26. Georgia
  27. Clemson
  28. Kentucky
  29. Saint Louis
  30. Utah St.
  31. TCU
  32. UCLA
  33. Saint Mary’s (CA)
  34. Texas A&M
  35. Villanova
  36. NC State
  37. Ohio St.
  38. Missouri
  39. Iowa
  40. UCF
  41. SMU
  42. Texas
  43. Santa Clara
  44. Indiana
  45. Oklahoma
  46. Auburn
  47. South Fla.
  48. Yale
  49. Troy
  50. Akron
  51. Liberty
  52. UNI
  53. High Point
  54. Hofstra
  55. Utah Valley
  56. Hawaii
  57. North Dakota St.
  58. Tennessee St.
  59. Wright St.
  60. UMBC
  61. Queens (NC)
  62. Howard
  63. Siena
  64. Furman
  65. Idaho
  66. LIU
  67. Boston U.
  68. Bethune-Cookman

Right off the bat, we had to change some things up. According to the weighted team sheet rankings, Michigan was ahead of Duke, but since the Blue Devils beat the Wolverines head-to-head, we are confident in saying the order would be Duke #1, Michigan #2.

As we are in the midst of Champ Week, only some of the mid and low-major conference champions in this bracket are official auto-qualifiers. The projected AQ’s listed is the team with the best NET rating still left in that conference tournament. The AQ teams in italics have yet to officially qualify.

Because of taking the best NET rating, this bracket projects Akron as the MAC Tournament winner, not Miami (OH). The RedHawks get left out in this scenario, due to poor metrics and and an abysmal SOS. In fact, Miami (OH) isn’t even that close using the weighted team sheet rankings. I don’t know what the committee is going to do should Miami (OH) not win their conference tournament, but if they apply one standard across the board, it will be an unprecedented snubbing. My prediction was that Miami (OH) would make it due to their strong WAB and resume metrics. Currently Miami (OH) is 31st in WAB and 21st in SOR.

On the flip side, Auburn would get in under this scenario. The Tigers would land the final spot and have to play in Dayton, but imagine the uproar if this occurred. Yet, given the committee’s historical preferences, the weighted team sheet has them in.

For Kansas, the Jayhawks sit at the precarious #16 spot, earning the final 4-seed but certainly in danger of sliding to a 5-seed. Losing both the Arizona St. and Cincinnati games are hurting a team that could be a comfortable 3-seed. Win either one, and the numbers look quite a bit better across the board. Every game matters. Now KU can still move up based on how it does in Kansas City. At the moment, it would be better for KU to have Texas Tech lose in the Big 12 Tournament. Also we should root against Arkansas, Louisville, Virginia, and Alabama.

The bubble looks like this:

Last Four In:

  • Santa Clara
  • Indiana
  • Oklahoma
  • Auburn

First Four Out:

  • Belmont
  • New Mexico
  • Stanford
  • San Diego St.

Also in bubble consideration is South Fla. The Bulls are in the Field conditionally based on them being the highest NET team in the American, but should they lose in their conference tourney, they could still get in as an at large. The weighted team sheet ranking here would likely have them out, but this doesn’t mean the committee would agree.

Belmont suffered a bad loss to Drake in the MVC quarters and Stanford’s defeat to Pittsburgh was disastrous for the Cardinal’s chances. But both New Mexico and San Diego St. are alive in the Mountain West with chances to improve their resumes.

Looking at the wider bubble picture, power conference teams are sitting prettier than the mid-majors nearby. Of the final 10 at large spots (all the projected 10 and 11-seeds), the weighted team sheet rankings show 9 power conference teams and only 1 mid-major. Spots 47-56 on the S-curve (which include South Fla. which is a strange bubble-case) make up the first 10 spots outside the Tournament and contain 6 mid-majors to 4 power conference teams.

If the committee does end up producing a bracket similar to the one above, there will no doubt be outrage from many pundits and teams outside the power conference structure, claiming bias. What this exercise has shown is not that there isn’t a disadvantage to now-power teams, but rather that it is structural not bias-related. Most mid-major teams, even the very good ones, have glaringly worse team sheet numbers in a variety of categories, from Quadrant 1 wins to SOS, when compared to teams in the middle of the power conferences. And while mid-major coaches complain about the difficulty of scheduling more difficult, very few good mid majors are foregoing buy games and looking to play multiple games against better fellow mid-majors in the non-con. Had Miami (OH), VCU, Belmont, and New Mexico gotten together to play each other in non-conference, each team could have added 3 Q1/Q2 games with at least one of them being a Q1 game. Sure, there is uncertainty if scheduling in the off season due to the fluctuation of team strength, but this makes the old bracket busters concept worth revisiting. Teams in the better mid-major conferences should reserve a weekend in mid-February to compete in cross-conference 2 or 3-game showcase tournaments that serve as a sort of play-in to at-large consideration. Some would lose and see their resumes get worse, but the risk would be worth the reward of winning multiple Q1/Q2 games.

The current Bracket Matrix projections show roughly a 0.92 correlation to this one, and when the dust settles my guess is that the actual team sheet weights for 2026 will converge with what Bracket Matrix has. Each season is different, and the committee has been talking more about WAB so this metric will likely receive more attention from the members and should have a higher weight than it currently does.

Beware of the Phog (Update after 2026 season)

For previous versions of this, see 2024/2025, 2023, 2022.

Kansas wrapped up its home slate with another Senior Day victory (43 in a row), beating K-State by a 104-85 margin. This ran the Jayhawks’ record at Allen Fieldhouse to 13-2 for the 2026 season, its only losses being to UConn and Cincinnati. Kansas had a number of impressive wins at the Phog in 2026, including against Iowa State, Arizona and Houston.

Since 2010, the first year that KenPom kept pregame winning percentage estimates, Kansas has gone 254-17 (93.7%) at the Phog. This jumps out as impressive, but the question becomes, how much of this is attributable to Kansas having a consistent standard of top talent and elite teams, and how much of this is attributable to the building? This question is what we are exploring.

Pomeroy’s data allows us to account for important features such as team strength, opponent strength, and even home-court advantage1; presenting us with an unbiased look at how likely it is a team is going to win a certain game. Its important that these numbers are unbiased, as this serves as the basis for judging exactly how special THE PHOG truly is.

Note: in keeping with earlier versions of this post, we will be capitalizing THE PHOG to signify the uniqueness and magic of Allen Fieldhouse in terms of its ability to produce wins for KU. It is a real effect as our numbers will show.

Let’s start with an example, the most-recent example, of a Kansas home game so we can wrap our heads around the exercise. KU was given a 94.3% chance of winning against K-State on Senior Day in KenPom’s numbers. Since KU won, they earned 0.057 Wins Above Expectation (WAE), the metric which determines how many net home wins Kansas has in comparison to Pomeroy’s expectation. If we accumulate WAE over a period of time, it gives us a better idea of KU’s success at home in comparison to an unbiased, reasonable expectation.

Since the beginning of the 2010 season, Pomeroy’s system has expected KU to win 233.43 games in that span, or 20.57 fewer than they actually have. This would be a 86.1% winning rate, not the 93.7% rate Kansas actually has. It also works out to a difference of 1.21 wins per season. So far, THE PHOG effect is giving KU an addition 1+ win per season, which can be the difference in a seed-line by the time March rolls around.

To further gage how impressive this is, we ran a simulation 10,000 times to see how likely it would be that Kansas would win 254 games given its opponent history over this span. Exactly zero times does the simulation project KU to win 254 games; in fact the maximum number of wins randomly assigned was 251. Looking at the distribution in terms of variation, the math estimates that KU would only win 254 games once in 36,040 times if KU’s over-success at home were just a random event.

Other Arenas?

The necessary follow up is to ask the reasonable question, well is this something that happens somewhere else? While we can’t easily test each arena, following the 2025 season we did explore a series of other notable home courts to see how much help they provided to their programs. This can be reviewed in the 2025 update (scroll down on page), but we will briefly represent the results here:

  • Mackey Arena (Purdue) +12.49 WAE
  • Pauley Pavilion (UCLA) +11.60
  • Hilton Coliseum (Iowa St.) +8.54
  • Rupp Arena (Kentucky) +7.67
  • Dean Smith Center (North Carolina) +4.11
  • McCarthy Athletic Center (Gonzaga) +2.08
  • Cameron Indoor Stadium (Duke) +0.75

Purdue lost 5 home games this season despite having a solid team, so Mackey Arena’s WAE has undoubtedly decreased. Iowa State went 16-1 at Hilton in 2026, but did so as a talented team playing a weak non-conference, so Hilton’s WAE likely increased only slightly. Kentucky went 14-4 at Rupp and no doubt lost ground. UCLA did go 17-1 at Pauley so is likely second on this list, and the others (North Carolina, Gonzaga, and Duke) all went undefeated at home so their home arenas will move up a touch on this ledger, though Duke’s underlying talent means its home court aura was less of a reason for its undefeated play in 2026.

Once we normalize for games played, Allen Fieldhouse is in the 100.00%ile (z-score of 4.03) and all others are below the 99%ile (roughly a 2.33 z-score). We’re talking magnitudes of difference here.

Betting Odds

Another way of looking at this is to consider betting odds. If a team is consistently outperforming what odds makers consider is reasonable, this adds further credibility to THE PHOG. With captured historical betting data going all the way back to the 2008 season, we ran a test to see what a hypothetical bettor would make had he put $10 on KU for each home game at the Fieldhouse in that era.

In theory, the market should balance out KU’s massive home court advantage and this bet not be profitable, but in reality we’ve found a market inefficiency. Kansas has won enough times to earn the bettor $252.44 over that span. Employing another strategy, a bettor who starts with $100 and wagers 10% of his collective pot each game would now have a total of $1,026.45 (10x growth) over these past 19 seasons.

Essentially this strategy would be an investment play, where one puts money into a fund and continues to reinvest dividends. This yields a 13.0% annual return (with 16 positive years and only 3 negative ones). By comparison, investing in the S&P 500 over this time results in 10.9% annual growth and a $663.02 pot of money. Betting on KU to win at Allen Fieldhouse has been a safer and more profitable investment strategy than the S&P 500 over the past 19 years, which is insane statement for anyone who knows about sports betting, the stock market, and financial theory.

Closing

After a down 2025, KU bounced back at home in 2026, going 13-2 against a very difficult schedule. KU was true underdogs an astonishing four times at Allen Fieldhouse this season, winning 3 of them (2 of them by double-digits). Kansas has now won 4 of 5 games as betting underdogs at THE PHOG in the Self-era.

Other bits of info include the fact KU hasn’t lost since 2010 when given at least a 90% chance of winning pre-game by KenPom. This is 148 for 148, and an underappreciated feature of THE PHOG, and has earned 6.10 WAE for KU. Kansas has been upset at home, sure, but the teams that do get a rare win at Allen Fieldhouse are at least ones with a pulse. Teams in the 80%-89% are the danger zone for some reason, with KU winning “only” 85.2% of these games (exactly as expected per KenPom, with -0.02 WAE). Regarding KenPom home underdog games for the Hawks, KU is 6-1 for a WAE of 3.49. When the building is energized, it clearly has an effect on lifting the team.

  1. By home court advantage, what he applies is an algorithmically-derived number that can be utilized across the board. All teams have home court advantages; we are trying to isolate Kansas’ in comparison to the others’. ↩︎

NCAA Tournament Selection – 2026 Case Study

Miami (OH) is in the midst of a magical season. The RedHawks are currently (3/5/2026) 30-0 and poised to return to the NCAA Tournament for the first time since 2007. Miami (OH) had 15 consecutive seasons with a losing record before a solid 25-9 campaign last year, but they’ve leveled up even more in Coach Travis Steele’s fourth season.

With a record as good as Miami (OH)’s is, one would normally think them to be a shoe-in to the NCAA Tournament, but things aren’t this straightforward. Let’s first consider their chances at getting the automatic bid. Although undefeated, the Red Hawks aren’t a super strong team according to the metrics. They are 88th right now in KenPom, 53rd in NET, and 83rd in Torvik. They aren’t the strongest team in the MAC, either. Akron sits at 63rd in KenPom (69th in Torvik) and would be favored in a neutral-site matchup. In fact, Torvik has Akron as the MAC tournament favorites, with Miami (OH) projected to win their conference tourney only 30.6% of the time. There are more than a few teams that Miami (OH) can reasonably lose to in the MAC.

Ok, so what? Even if Miami (OH) loses in the conference tournament, they will still have a great record (30-something and 1) and will get an at-large bid. Right?

This is where things get interesting. Recently former coach Bruce Pearl said that Miami (OH) shouldn’t get an at-large spot in this scenario, causing a ruckus in which the administration and coach at Miami (OH) responded with indignity.

Here’s the interesting thing, however. Both sides have a good point. What Miami (OH) has done is truly impressive, yet at the same time theirs good reason to doubt they could’ve qualified for an at-large spot had they been in a power conference and played a tougher schedule. What we want to do is to examine the RedHawks’ tournament resume as the committee will and explain more about this process.

It is our conjecture that the NCAA Tournament committee has a challenging job and is overly criticized. Yes, sometimes they get it wrong. But consider what they are tasked with. They are asked to rank a number of different basketball teams playing in different conferences and oftentimes wildly different schedules. It is tough enough to try and compare the 6th-best team in the Big 12 with the 6th-best team in the Big 10, now try comparing a top team from the MAC to average teams in the SEC or how MWC teams stack up against A10 teams.

In order to guide the committee, the room has team sheets which show a team’s numbers and its wins and losses based on things which can be compared, that is quadrants. If Team A is 5-4 in Q1 games and Team B is 3-6 in Q1 games, the committee can easily judge that, in terms of Q1 record alone, Team A is preferrable. Now it may be that Team B has done better at avoiding bad losses, has a better overall strength and schedule and computer ratings, etc. that wind up seeding Team B better than Team A, but this process helps the committee make some sense of the numbers. Here are a list of important things the committee considers:

  • Wins and overall record against quadrants
  • Computer efficiency metrics (i.e. KenPom, NET)
  • Resume metrics (i.e. WAB)
  • Strength of Schedule

Let’s bring in Bracket Matrix to get a consensus look at where things stand today. The consensus thinks Miami (OH) is in the tournament (they are given the MAC auto-bid at this point by many systems), albeit as an 11-seed. Should Miami (OH) lose to Akron in the MAC finals, how much this would change their status remains to be seen, but they’d likely be a quintessential bubble team.

To see why this is, put yourself in the committee’s shoes. Instead of romanticizing the dream season of the mid-major, look at things objectively. In this scenario, Miami (OH) would be 33-1. Sure, this is impressive. But they also currently have the 344th best SOS according to Warren Nolan. Digging into their resume a bit more, you’d see these marks by quadrant:

TeamQ1-A RecordQ1 RecordQ2 RecordQ3 RecordQ4 Record
Miami (OH)0-00-01-010-016-0

The first thing we’d notice is the goose egg in terms of all Q1 games, followed by the sole Q2 win. Miami (OH) has gone 3-0 in non-D1 games, which don’t really count at all, meaning their overall 30-0 record is really 27-0…still impressive but you get what’s happening. This initial strong element of the resume has started getting chipped away.

Looking at a few computer metrics, here is how Miami (OH) looks

  • 53 in NET
  • 88 in KenPom
  • 30 in WAB

The efficiency metrics aren’t great, but helpful to Miami (OH) is the WAB number. This metric shows the RedHawks as having the caliber of resume of a typical 8 seed.

Let’s compare this to a similarly-placed team in Bracket Matrix, TCU. The Horned Frogs’ team sheet looks something like this:

TeamQ1-A RecordQ1 RecordQ2 RecordQ3 RecordQ4 Record
TCU3-55-75-13-17-1
  • 42 in NET
  • 45 in KenPom
  • 36 in WAB

Looking at these two resumes, which one looks more impressive? This what Miami (OH) is up against. Yes, the 30-0 (or 33-1 potentially) looks great, but once you look at what is presented on the team sheets, it stacks up poorly against teams that have a number of quality wins.

Having said that, TCU going 10-2 in Q3/Q4 should be pulling the Horned Frogs down, and it is. TCU is currently projected to be the lowest 10-seed, i.e. just barely avoiding the First Four play-in. But it is better to have a few “hiccup” games against Q3/Q4 opponents if you win enough Q1 games than it is to go unbeaten against Q3/Q4 teams while not playing (or winning) many Q1/Q2 games.

Another factor helping TCU here is SOS, which sits at 46. This is the same thing for other non-Miami (OH) bubble teams. Ohio State has the 23rd-ranked SOS. Santa Clara’s is 87th. VCU’s is 101st. New Mexico’s is 93rd. Even the other mid-majors on the bubble have way-better SOS than Miami (OH).

What’s really holding Miami (OH) in the at-large picture at all is its WAB and the fact it has avoided bad losses (nearly every game it played, would it have lost, would be a “bad loss”).

Pearl’s Comments and the response

Bruce Pearl’s comments were not taken well, with Miami (OH)’s administration mentioning that Pearl is saying as such to promote Auburn, where his son is the head coach. Auburn was on the bubble but has lost 7 of its last 9 to fall to 16-14 on the year. The Tigers still have an outside shot of making the Big Dance if they can rack up a few wins in the SEC Tournament, but despite having the 3rd-best overall SOS, they’ve lost too many games at the moment to be in the field.

But let’s consider his point. He’s saying that Miami (OH) has benefitted from an incredibly easy schedule, and that were they to play in a power conference, they’d likely be out of the tournament. To explore this, we compared the team with the closest WAB to Miami (OH), Georgia (29), who is conveniently another SEC team.

Georgia’s gone 21-9 this year, but has won 7 Q1 games while only losing 1 Q3 game (and 0 Q4 losses). They’ve racked up impressive wins against Alabama, Cincinnati, Arkansas, Missouri, and Kentucky. We can’t say that Miami (OH) has done this. Maybe they could have, but we can’t say they did. That’s why Georgia’s WAB ranking feels truly “earned” and the committee will likely have them in the 7-8 seed range.

To Miami (OH)’s point, sure the MAC is easier than the SEC, but they’re undefeated, something that many bubble teams can’t say when looking at just Q3/Q4 results. New Mexico has two Q3 losses. TCU lost to lowly New Orleans at home (Q4) earlier in the year. Santa Clara has a Q4 loss as well. Some of the other teams on the bubble (Ohio St., Indiana, VCU) have taken care of games against Q3/Q4 opponents but have paltry records in Q1/Q2. What’s really the difference between going 1-8 in Q1 games versus going 0-0?

What people tend to ignore is that the committee functions in a certain way, namely they function by being able to compare each team against those around it. After a rough draft seed list is created, they go through the “scrubbing” process which is effectively taking two similar teams and using a fine-tooth comb to separate their resumes. The better team moves up a spot and is compared to the team above it. The worse team moves down and is compared to the team below it. Do this for a few iterations, and you’ve made a consensus decision on how the S-curve should be 1-68.

Because of this process, what the committee wants to see is that teams are easier to compare. It is easier to compare teams with similar(ish) Q1 contests, SOS marks, etc. than it is to compare a Miami (OH) and a TCU. The committee is trying to weight wins and losses, and this gets tougher to do when a team’s opponents played are skewed to the low-end of the quadrant scale.

To combat this, the NCAA has consistently signaled the importance of strength of schedule. Teams with poor SOS marks get dinged, and not just on the bubble. Iowa State fell a few spots on the S-curve (and missed a chance at a 1-seed) a couple years back because of its poor non-con SOS. They don’t want to be told they have to parse one team’s results against competitive teams against that of another’s games against non-competitive ones.

WAB, Hypothetic Results, and Scheduling

Running concurrent to this is the recent inclusion of Wins Above Bubble (WAB), which allows a team to play a weak schedule yet still build a resume as long as they have a very good record (i.e. undefeated or 1 loss). This is what Miami (OH) has done in 2026.

The metric is saying that Miami (OH)’s 30-0 record is equally as impressive as Georgia’s 21-9 record against a far harder schedule. What Bruce Pearl is saying is that Miami (OH) would still struggle to achieve something the likes of which Georgia has done against Georgia’s schedule. And what we’re saying is that both are right.

Had Miami (OH) played Georgia’s schedule, a computer metric like KenPom would project the RedHawks to have a 15-15 record. Even if we gave hypothetical Miami (OH) a few more wins playing that schedule, 17-13 isn’t likely getting a team in (that’s about 62nd in WAB).

The better response for Miami (OH) than to insult Pearl would be to point out that most teams couldn’t finish 30-0 against the RedHawks’ schedule. If Georgia had played the schedule Miami (OH) did, computers would project them to be at 28-2 or 29-1…only 21% of the time would we think they could run the table. Yes, they’d be favored in every game. But eventually someone would trip them up, they’d have an off-night, etc. With five total games on the schedule in which they’d be favored to win less than 90% of the time, it isn’t unlikely they’d drop one along the way.

Now the committee doesn’t really consider hypothetical results as such, that’s what WAB is attempting to control, but it does show how the argument becomes circular.

The other element within this is scheduling. A harder schedule for Miami (OH) would have allowed us to see how they would have done against opponents closer to the quality of Georgia’s (or TCU’s or Ohio State’s). Now Miami (OH) couldn’t schedule better within its conference. The MAC is the 17th-best conference per KenPom, truly a mid-major league. The MAC schedule has provided Miami (OH) with a number of Q3/Q4 games and its only Q2 contest (Akron). I believe the committee would be sympathetic to the RedHawks if them being in a weaker league was the only reason for their poor SOS numbers. Where Miami (OH) has been hurt, however, is in the weakness of its non-conference schedule.

The RedHawks have the 364th ranked non-con SOS, having played three non-D1 teams as well as a slew of other low-majors. Playing 8 teams outside of the top 300 in KenPom in your non-con while also playing a mediocre conference slate is a recipe for a disastrous SOS metric. For most teams at the non-power conference level, this matters not since they aren’t trying to get an at-large bid. But for Miami (OH), it might become a nightmare.

Miami (OH)’s coach tried to justify this. As ESPN reported:

Coach Travis Steele recently told ESPN that high-major squads have refused to schedule the RedHawks due to the potential for an upset.

This has become the typical sentiment from mid-major coaches and supporters of these teams. But it isn’t based on much evidence. Looking at the rest of the MAC and using KenPom numbers, Miami (OH) had the worst non-con schedule by far. Its average non-con opponent (excluding non-D1 teams) had a rating of -9.91. The average non-con opponent of all the other MAC teams was -1.97. This is a difference of about 5.6 points per game easier for Miami (OH) than others in their league faced.

Obviously they could have scheduled harder. But even the claim that high-major teams refused to schedule Miami (OH) is far-fetched. Fellow MAC school Eastern Michigan faced four power conference foes in the non-con. The Eagles played at Pitt, Louisville, Cincy, and Butler. These were all Q1/Q2 games. Other teams in the MAC were also able to schedule power conference opponents.

The more obvious solution here is that Miami (OH) didn’t expect to be 30-0 on March 5, and they just weren’t concerned with building an at-large resume when they scheduled last off-season. They were hoping to play well during the regular season to get a good seed in the conference tournament and hopefully get a bid through automatic qualification. Which is fine, a majority of the conferences are one-bid leagues. But don’t pretend your abysmal SOS is the fault of other programs.

Projecting Miami (OH) in the Field

Wrapping this up, what do we think about Miami (OH)’s chances? We’ve been all over the map in this analysis, but this is kind of everything the committee will be considering (well, besides the hypothetical scenarios). Obviously Miami (OH) can take care of things by winning its conference tournament. But what if they don’t?

Let’s say Miami (OH) wins its final regular season game (at home against Ohio). This is actually a key game, as it will allow the RedHawks to have 1 loss at most following the conference tournament. I don’t think Miami (OH) gets in if they lose the regular season finale and in the MAC tournament.

If they finish the regular season 31-0 and lose in the conference tournament, preferably in the championship game to Akron (Q2 opponent), this is where things get interesting. Their WAB would drop a bit (likely to around 38-40), which by itself would get them in the field but not by much. Combined with weak efficiency metrics, no Q1 wins or even games played, and of course that SOS, it is going to be close.

Either way, if Miami (OH) finishes at these records here are the chances I give them:

  • (34-0) – 100%. 10-seed estimate.
  • (33-1) – 60%. 11-seed First Four.
  • (32-1) – 30%. Out but if in 11-seed.
  • (31-1) – 25%. Out but if in 11-seed.
  • (32-2) – 0%. A 2-loss team with that bad SOS won’t get in.

Bid thieves in leagues like the A10, MWC, and WCC (as well as any power league) are also lurking which would change this calculus. At the moment, Torvik projects Miami (OH) in the field 67% of the time, with them earning an at-large bid 49.6% of the time, a true coin flip.

The Importance of Quality Depth, a Case Study

The 2010 Kansas team, despite its untimely end, was the paradigm of a well-constructed roster. It had veteran leadership alongside young pro talent, a compliment of shooting to go along with interior play, stars who took over in the big moments to go along with role players who did the little things, and continuity that ensured everyone was on the same page.

Taking a look at its top 4 players, here are their value stats:

PlayerPPGABPer100 ABWAR/36
Marcus Morris+4.14+9.61+5.29
Cole Aldrich+4.02+8.62+5.27
Sherron Collins+3.48+6.05+5.03
Xavier Henry+2.39+4.99+3.70

The final value stat, WAR/36 just normalizes the season WAR to a 36-game schedule so we can compare across seasons.

All four of these players would go on to play at least some in the NBA. Marcus Morris was a very underrated player who continued to improve and was a very efficient Jayhawk even by his sophomore season.

Now let’s take a look at the 2026 roster’s top 4 players, through 30 games of the season.

PlayerPPGABPer100 ABWAR/36
Darryn Peterson+5.54+12.32+4.48
Melvin Council+4.03+7.15+5.89
Flory Bidunga+4.03+7.68+5.73
Tre White+2.39+4.46+4.05

What stands out is that, by all value metrics, the 2026 top four is as good or slightly better than the 2010 top four. Peterson’s WAR is a bit lower due to him being out of the lineup for 11 games, but other than that the stars of both teams are at worst comparable.

So why does it feel like the 2026 team is so much worse than 2010? Obviously this is due to the rest of the rosters. Let’s take a look at 2010’s role players to begin:

PlayerPPGABPer100 ABWAR/36
Markieff Morris+1.22+4.00+2.06
Tyrel Reed+0.78+2.89+1.53
Tyshawn Taylor+0.26+0.65+1.37
Elijah Johnson-0.03-0.27+0.18
Thomas Robinson-0.69-5.52-0.31
Brady Morningstar-1.30-3.48-0.20

In total, these role players in 2010 had the following value:

+23.22 Points Against Bubble (+0.65 per game)

+4.46 WAR

Contrast this with the 2026 role guys.

PlayerPPGABPer100 ABWAR/36
Kohl Rosario-0.31-1.54+0.25
Jayden Dawson-0.35-2.22+0.10
Elmarko Jackson-0.49-1.63+0.39
Jamari McDowell-1.51-4.87-0.63
Bryson Tiller-1.94-4.28-0.63

The cumulative totals for these five rotation players are:

-133.48 Points Against Bubble (-4.45 per game)

-0.52 WAR

This final table should contrast things nicely:

SeasonStars PAB/gmRole Guys PAB/gmTotal PPGAB1
2010+14.03+0.65+14.68
2026+13.96-4.459.51

Basically, 2026’s role players are spotting a typical opponent 4-and-a half points a game that the stars have to make up. Most nights they can, but some nights, when shots aren’t falling or things aren’t going well, this can result in an unexpected loss.

Back in 2010, KU could get some value from the likes of Tyshawn, or when it went to its bench was able to maintain a solid level of play thanks to the efforts of Markieff and Tyrel Reed. Even with the struggles of freshman T-Rob and Brady Morningstar, Kansas was an elite team.

  1. These totals won’t add up to each team’s season totals for PPGAB as these totals exclude coach technicals, walk-ons, and other non-rotation players (those playing fewer than 10% of possible minutes). ↩︎