
The Kansas Jayhawks statistics pages have been published for seasons 2006 through 2027.
2027 2026 2025 2024 2023 2022 2021 2020 2019 2018 2017 2016 2015 2014 2013 2012 2011 2010 2009 2008 2007 2006
The 2027 Kansas Jayhawks are 1-0 and sit ranked at #17. They will play next on Friday, November 6 against Middle Tennessee. The game will be played at home. The team’s College Basketball Reference page is here.
| Player | PPGAB | Per100 |
| Melvin Council | +4.10 | +9.66 |
| Leroy Blyden | +7.17 | +14.63 |
| Tre White | +10.04 | +22.90 |
| Tyran Stokes | -6.11 | -13.18 |
| Trey Kaufman-Renn | +1.19 | +2.76 |
| Taylen Kinney | -4.19 | -9.11 |
| Keanu Dawes | +3.16 | +11.16 |
| Christian Reeves | +3.28 | +13.38 |
| Dennis Parker | +0.74 | +6.79 |
| Trent Perry | +4.19 | +36.44 |
| Kohl Rosario | ||
| Paul Mbiya | +0.32 | +4.46 |
| Davion Adkins | -1.61 | -28.57 |
| Luke Barnett | -0.65 | -8.92 |
| Will Thengvall | -0.61 | -13.39 |
| Atticus Richmond | -0.64 | -14.05 |
Through one game, the top five Jayhawks have been: Tre White, Leroy Blyden, Trent Perry, Melvin Council, and Keanu Dawes. The KU players who struggled the most were Tyran Stokes and Taylen Kinney. In the case of Stokes, we had him giving up 20 points on defense (including a 4-point play by fouling a 3-point shooter), which contributes heavily to his negative score. Some of this was him still learning how to communicate and defend at the D1 level, but there is also a bit of luck involved when someone is only playing over a sample of about 46 possessions.
Season Write-Ups
After an interesting off-season, the Kansas Jayhawks will begin exhibition play this Friday, taking on Pitt State in a night that will also function as the team’s “Late Night.” With the rules changes on who a team can play in the preseason, KU will also host Louisville and Duke later this month, meaning that entertaining games (albeit ones that don’t officially count) are nearly here.
The rumors heading into the offseason were that Kansas would see wholesale changes to its roster as players entertained the transfer portal, and these rumors proved to be correct. KU saw five non-graduating seniors transfer out and one head to the NBA. Darryn Peterson would be drafted second overall to the Utah Jazz, but those heading to new schools include: Bryson Tiller (Missouri), Flory Bidunga (Louisville), Elmarko Jackson (Georgetown), Jamari McDowell (Wake Forest), and Samis Calderon (Butler).
Kansas was able to return Kohl Rosario and Paul Mbiya, something that helped rally fans who were worried about seeing no continuity from one year to the next. But even Mbiya looked gone for a brief moment (there was an announcement made on his behalf that he had entered the portal but he never actually did and eventually announced his return).
Along with these two, KU had early commitments from four freshmen (led by Taylen Kinney), so at least a skeleton roster existed at this time. Eventually KU would go to the portal and add a strong compliment of talent, before landing the player the staff was really after and who was rumored to be a Jayhawk all along, top high school recruit Tyran Stokes.
Stokes, the McDonald’s All-American and consensus number one player of the 2026 high school class, made things official on April 29th. By May 7th, KU had added its final important piece (or so we thought), in Radford transfer Dennis Parker. The roster at this time looked talented but a bit unproven. Questions were along the lines of: How would the incoming transfers do, particularly those who played at a lower level the year before? Would the true freshmen (aside from Stokes) be able to contribute? How would the progression of Mbiya/Rosario look?
But these days in collegiate athletics are anything but normal, and by the end of the summer there were rumors about Tre White and Melvin Council (independently) looking to sue the NCAA for another season of eligibility. White, who had gone undrafted in the NBA but played in the Summer League, was seeking a fifth season due to the NCAA’s own newly-drafted “five in five” rule that was to allow players moving forward to get five seasons of eligibility in five years of college…a precedence that was somewhat established with the 2021 Covid season.
Council’s lawsuit went a different direction, seeking for a fourth-NCAA season given his own unique circumstances…he argued he had been forced into playing basketball at the NJCAA level because of being falsely accused of a crime, and that he was seeking remedy from this harm and that by being declared ineligible the NCAA was in effect punishing him.
Recently each player had his lawsuit receive initial procedural victories, which had the effect of declaring each player currently eligible as the cases work themselves through the courtrooms. Now this status could change if appeals courts rule against the plaintiffs, but shortly after these cases were seen as favorable for White and Council, each player announced his intent to return to Lawrence for one final “victory lap” season.
So not only are both players eligible, they are both on KU’s official roster and have their old numbers back. So while about six months ago it looked possible that KU might not return any scholarship players from a season ago, the Jayhawks are bringing back four scholarship players with two of these being full-time starters from the 2026 season.
This year’s projection will be a bit different from prior seasons, because there are four possible scenarios as to how the roster might wind up down the stretch of the season heading into postseason play.
Scenario A is the most optimistic outlook, in that both Melvin Council and Tre White are deemed eligible and are able to play most or all of the season (and this is what we know by mid to late-February).
Scenario B sees Melvin Council as eligible but Tre White (who is part of a class of other players) as ineligible.
Scenario C is when White remains eligible but Council’s case gets overturned and he is no longer able to play.
Scenario D is when both are found independently ineligible, effectively returning the roster to how we all thought it was going to be during the summer months.
Given the importance of both players to Kansas a season ago, as well as how much roster turnover there was, each of these scenarios makes the Jayhawks look quite different. So when it comes to projecting how well the team is going to do, we will explore each of these options.
Without further ado, here is each player’s projected value marks, ordered by estimated playing time assuming the best case scenario and the full eligibility of Council and White.
Melvin Council (Gr.) PG: 81.7% minutes, +6.25 Per100, +3.57 PPGAB
The return of Melvin Council has produced far more controversy than one would expect particularly given Mel’s energy and the fan enthusiasm a year ago. Council grades out very well from a value perspective, as his defense and ballhandling were both extremely solid marks and able to overshadow his per shooting efficiency marks.
Council’s age and status as a returning player are also in his favor…we are more confidently able to project players that are in their collegiate primes and have already played under Bill Self than the alternatives. With KU likely having a deeper team than it did a season ago, the hope is that Kansas will be able to rest Melvin more and that his shot selection can be more judicious. He shouldn’t need to be the one to force difficult late-clock shots up.
Tyran Stokes (Fr.) F: 78.4% of minutes, +6.94 Per100, +3.81 PPGAB
As a true freshman, Stokes is slotted at value numbers that fit his class rating coming in and comparing him to other freshmen who were at that level. Make no mistake, Stokes is going to be a high-value player. How good he actually is will be determined during the year, but Kansas fans should be excited about his prospects. Even Stokes’ true position is a mystery, with us merely listing him as a “forward” as we aren’t sure if he is going to play more of the 3 or the 4.
What should make Stokes a more interesting prospect than the talented Darryn Peterson from a season ago is Stokes’ versatility. Stokes is a better passer and rebounder, whereas Peterson was a true shot-first type of player (and still is).
Tre White (Gr.) SF: 72.4% of minutes, +4.26 Per100, +2.16 PPGAB
White got much more love than the news of Council returning, and while White’s return makes KU better and deeper, KU is going to need less from White than they are Council. There are more wings and more options around the 2/3/4 spots than there are at point, particularly if the new PG-types aren’t ready to play at the Kansas-level.
White’s numbers reflect who he is, a solid shooter and rebounder and decent defender. He doesn’t pass well and can sometimes disappear from the game if not engaged in the offense. With Stokes and others, we are expecting Tre White to have a good season. But from what we’ve seen, we still think Melvin is more valuable to this year’s roster.
Keanu Dawes (Sr.) PF: 68.0% of minutes, +3.94 Per100, +1.88 PPGAB
Our median expectation for Keanu Dawes, the first transfer to make this list, is a blend of what KU transfers have historically done (underachieved according to estimate in their first seasons at KU) as well as our optimism toward him given his play last year on a Big 12 team (solid player at Utah). First, the possible bad. Dawes will need to adjust to a new coach and system and play at a more competitive level in terms of expectation. Can he compete at a high level for a program like KU?
We believe so. He is experienced and a veteran, and has already played at Allen Fieldhouse (outplaying Bryson Tiller a season ago) and against Big 12 opponents. He has the ball skills to be both a finisher and complimentary piece around the other talented players KU has assembled. Dawes’s size and versatility will allow KU to play him at either the 4 or the 5, and we have him as the fourth all-but-guaranteed starter spot.
Leroy Blyden (So.) PG: 40.1% of minutes, +0.54 Per100, +0.15 PPGAB
Blyden begins the list of other players who we have anywhere from fifth to tenth on total minutes played/importance to the team. Blyden had a great season for Toledo, shooting 40% from 3 and being a great scorer and solid distributor in his freshman season. But how will he handle playing at a higher level, likely getting fewer minutes, and asked to have a more specific role? Some players thrive doing this, while others struggle to adapt.
What we know is that Kansas will need ballhandling and that they don’t have a ton of it. Especially if Melvin Council is ruled out at anytime during the year, expect Blyden to have opportunities to be in at a lead guard role.
Dennis Parker (Sr.) SF: 35.4% of minutes, +1.97 Per100, +0.49 PPGAB
Parker is a wing who has recently been receiving less anticipation among Kansas fans after the news of White returning. Parker was a solid shooter and scorer at Radford, but how much he can do at a higher level is still to be determined.
A couple things in his favor include his age (senior) and his experience at the higher level of college hoops (he began his career at N.C. State). Parker could very well be the type of player who shows steady development each year, and KU gets him at his college best. Either way, his metrics from a season ago were better than either of Nick Timberlake’s or Jayden Dawson’s.
Kohl Rosario (So.) SF: 33.4% of minutes, +1.35 Per100, +0.31 PPGAB
Rosario’s potential was seen last year when he helped spur KU’s comeback against St. John’s in the Round of 32, and he has elite athleticism/hustle which makes his prospects all the more exciting. We see year two going better for Kohl, though with this roster it remains to be seen how many minutes he actually gets.
But he should be above-bubble, given how close he was to bubble-level as a freshman. His status as a wing might require him to shoot the ball better, but even if he is a subpar shooter he can get minutes by doing little things and adding value through coverage defense and hustle plays such as offensive rebounds or steals/forced turnovers.
Taylen Kinney (Fr.) PG: 30.4% of minutes, +1.07 Per100, +0.23 PPGAB
KU’s other McDonald’s All-American is another intriguing player, someone who you could see play a major role for the Jayhawks this year or maybe need to sit as an inexperienced true freshman. With Council on the roster and eligible, KU’s need for a floor general diminishes. Kinney is five and one-half years younger than Mel. This matters, and is one reason we see Kinney’s minutes diminishing as the season goes. But of course this could change given the uncertainty of Council’s eligibility.
Kinney is at a place in the recruiting rankings that could go either way. KU has had some really solid players around the mid-teens, and some not-so-great freshmen as well. If he isn’t asked to do too much, Kinney should be a great complimentary piece given his ball skills and knack for the game.
Paul Mbiya (So.) C: 24.7% of minutes, -0.43 Per100, -0.07 PPGAB
Mbiya is looking a lot sharper in practice videos than he did a year ago, much smoother and better skilled. His size and potential are still there, and given his proven ability to play big and rebound, he will get more minutes than he did a year ago. How much value he adds, and how much Self wants to play a true 5 (which means benching a player with better skills) will determine how much Mbiya sees the floor. We see him as nearing bubble-level, and as a backup this wouldn’t hurt the team much.
Christian Reeves (Sr.) C: 20.8% of minutes, +3.14 Per100, +0.46 PPGAB
Reeves is tough to forecast, as he has battled injuries during the summer/fall and is only now finally practicing at full-speed. The staff expects him to be healthy for the first game (November 2), so we could have shifted his minutes up more. With Reeves, his efficiency numbers graded out very well last year while at Charleston, and he proved he plays with legitimate size given his rebounding. This marks are a bit of a hedge, we could see him playing more minutes, but we could also see him playing at a lower efficiency level if called on to be the lead center.
Davion Adkins (Fr.) PF: 6.1% of minutes, -4.43 Per100, -0.28 PPGAB
Adkins is an interesting case, in that he could still get rotation minutes if he proves to be a good enough player. He has the size and athletic build that Self loves, but given KU’s veteran depth, he might find it hard to crack the rotation. Self has been saying he wants to play “10 guys” in the rotation, but Adkins is currently our 11th.
Trent Perry (Fr.) SF: 4.3% of minutes, -6.13 Per100, -0.37 PPGAB
Perry is behind a number of wings. But if both Council and White become ineligible, he might get an opportunity and more minutes if others on the wing struggle. He is a strong-looking player, but we don’t really know much about how we will play against legitimate D1 talent.
Luke Barnett (Fr.) SG: 2.6% of minutes, -6.50 Per100, -0.24 PPGAB
Barnett comes in as a shooter, so he might have a better chance at cracking the rotation than Perry if KU decides they need another shooter to get minutes. But most true freshmen who come to Kansas had a higher class ranking than Barnett, so don’t expect much.
Grant Mordini (Fr.) PF: 1.0% of minutes, -15.00 Per100, -0.40 PPGAB
Atticus Richmond (Fr.) PF: 0.5% of minutes, -15.00 Per100, -0.22 PPGAB
Will Thengvall (Jr.) SG: 0.4% of minutes, -15.00 Per100, -0.18 PPGAB
Practice players that aren’t expected to play much, and any minutes they receive will be low-leverage ones.
Kansas TEAM scenarios:
Scenario A: +12.30 PPGAB, +31.57 KenPom
Let’s get it out of the way. If KU can keep its players eligible and if they perform as they should (given what they all did last season), there’s no reason why Kansas can’t get back to being a top team in the nation. It feels weird to offer optimism given how KU has done the last few seasons (and particularly in the transfer portal era), but Self has a very deep team with both Council and White returning.
Note that KU doesn’t necessarily need to hit on everyone; they can play the guys that are performing and maximize the minutes in the best way possible. KU should hit on at least 2 out of the 4 transfers, get some decent play from a few non-Stokes freshmen, get the assumed development out of Kohl and/or Paul, etc. and still be fine.
What is interesting here is that Self has depth again, in a way even that the 2025 team didn’t. Can he use it? He says he wants to play a 10-man rotation, and at least early on I hope we see that. Developing a deep bench will help keep guys rested and ready for March, keep the competition between players on the team, and hopefully assuage any injury or eligibility issue that might arise.
Scenario B (no White): +11.11 PPGAB, +29.87 KenPom
Losing only Tre White isn’t as bad as you might think, assuming that Stokes and some others can fill in the minutes with about as much efficiency. KU would still be very deep in this situation. Some scoring and some other play on the wing might dip a touch, but this is where KU is deepest.
Scenario C (no Council): +9.71 PPGAB, +27.86 KenPom
Without Melvin (but with Tre), KU is still a solid team, but there is definitely minutes that need filling in. At least one but likely both of Blyden and Kinney will need to play serious minutes. Are either up to the task? We just don’t know at this point, so we see a bit more of a pessimistic outlook than in Scenario B.
Scenario D (neither Council nor White): +7.33 PPGAB, +24.48 KenPom
Without either, Kansas’s depth gets challenged considerably. Not only will the team need more minutes from its backcourt, it will need the remaining players to take on a bigger role in terms of offensive creation and leadership. Note that this would be the baseline estimate for a team without Melvin or Tre, so the fact KU has a possibility of keeping one or both eligible should be seen as a win.
Final Scenario
Blending it together, and attempting to predict the likelihood of each player remaining eligible, we see KU as a +10.17 PPGAB and +28.53 KenPom team (roughly a 2-seed). This is close to where KenPom has them in the preseason (+27.16, ranked 8th).
10/19/2026 Update – Trey Kaufman-Renn
As if this off-season couldn’t get any wilder, KU has officially announced the inclusion of Trey Kaufman-Renn (TKR) to the roster. He is another Fifth-Year player, only eligible due to a court injunction against the NCAA and, like Tre White and Melvin Council, potentially ineligible sometime down the road. TKR played for Purdue and was an extremely important piece for the Boilermakers the last two seasons. As a senior a year ago, he led the team in rebounds and was the third-leading scorer. He is 6’9 and listed as a power forward. Kansas will be able to use him either at the 4 or 5, but of course lineups are still very much a work in progress.
In order to make room for TKR, KU announced a season-ending injury to Grant Mordini. This gets KU to the 15-player limit (+1 for grandfathered walk-on Will Thengvall), with 14 of these players legitimate scholarship pieces that could theoretically play rotation minutes for the team. We haven’t seen this depth ever at KU, and anything that rivals it would likely take us back to 2011 or 2010 at the earliest. KU has 3 Graduates (5th-years), 3 Seniors, 3 Sophomores, and 5 Freshmen among its 14. And while we mentioned that three of these freshmen are likely not going to play much given their incoming class ranking, on the court against Pitt State they looked as sharp as some we thought were going to crack the rotation. The point here is that everything is a mess. We don’t have a clue as to how this season will play out.
Doing our best, here’s the amended projection for 2027, sorted by minutes played, keeping the value projections based on earlier estimates, but manipulating the minutes a bit more based on some new information.
These estimates produce a +13.05 PPGAB team, or KenPom of +32.64. Of course the remaining caveats apply regarding eligibility.
This would be the third-best team in the Self era (2008, 2010) and fourth-best since 1993 (1997).
With TKR in the mix, we see a solidified front court. We also see Paul Mbiya getting fewer minutes, as the fourth-best among the four true PF/C types. There have been questions about Keanu Dawes and his adjustment as well, which would indicate more of a need for TKR. On the flip side, Christian Reeves has gotten healthy and had the best exhibition game according to Coach Self. These four players make up 163.5% of possible minutes, indicating a projection of KU having at least two of these bigs on the floor 80% of the time. This number gets slightly higher if we include Davion Adkins.
The PG rotation of Council, Kinney, and Blyden makes up 142.5% of minutes, and it seems reasonable to assume that KU will play a mix of both styles–either two of these guys at one time or just one.
Lastly, we will broadly classify everyone else as a wing, and the Stokes/White/Parker/Rosario foursome produces a projected 175% of possible minutes. At times three of these guys should play, and at times only one. If we add Perry and Barnett to this group, this goes to 185%.
Top 20 in Power Ratings:
46. Kansas +6.86
A slew of SEC teams are at the top, as this conference as shown itself to be the deepest and toughest once again.
Conference Averages:
The SEC grew its lead as the top conference, with the average SEC team 9.5 points better than the average Big 10 team.
KU is currently 3-5 (1-4). Its next game is against UCF on 11/7.
| Date | Location | Opponent | Time | Network | Odds | Win? | Score | Record |
| 9/4/26 | Home | Long Island | 7:00 PM | ESPNU | 99.0% | Y | 51-6 | 1-0 |
| 9/11/26 | Home | Missouri | 7:00 PM | FOX | 36.8% | N | 21-38 | 1-1 |
| 9/19/26 | Neutral | Arizona State | 11:00 AM | FS1 | 46.5% | N | 17-24 | 1-2 |
| 10/3/26 | Home | Middle Tennessee | 11:00 AM | ESPNU | 88.6% | Y | 55-0 | 2-2 |
| 10/10/26 | Away | Utah | 7:00 PM | ESPNN | 11.1% | N | 24-41 | 2-3 |
| 10/17/26 | Away | Kansas State | 11:00 AM | FS1 | 38.6% | N | 24-35 | 2-4 |
| 10/24/26 | Home | Baylor | 12:00 PM | TNT | 38.2% | Y | 25-24 | 3-4 |
| 10/31/26 | Away | TCU | 2:30 PM | FS1 | 34.5% | N | 16-22 | 3-5 |
Here are the odds for the rest of the season as of 11/2/2026:
| Date | Location | Opponent | ESPN FPI Odds |
| 11/7/2026 | Home | UCF | 63.4% |
| 11/14/2026 | Away | West Virginia | 51.2% |
| 11/21/2026 | Home | BYU | 28.2% |
| 11/28/2026 | Away | Oklahoma State | 27.3% |
This comes to an estimated win total of 4.70, of which the simulations show a 20.5% chance of reaching the 6+ win threshold needed to confirm bowl eligibility. KU will need to win at least 3 of its final 4 games to make a bowl.
Below is the power ratings for 2026 Kansas High School football through Week 9 (first round of playoffs). These ratings provide an estimate in relative strength in terms of points per game.
| Rank | Team | Class | Record | Rating |
| 1 | Kapaun Mt. Carmel | 5A | 9-0 | 56.26 |
| 2 | Andale | 3A | 9-0 | 53.53 |
| 3 | Bishop Miege | 4A | 9-0 | 50.61 |
| 4 | Derby | 6A | 9-0 | 45.69 |
| 5 | Hays | 5A | 8-1 | 45.64 |
| 6 | Wichita Northwest | 6A | 7-2 | 43.93 |
| 7 | Manhattan | 6A | 7-2 | 43.07 |
| 8 | Blue Valley | 5A | 7-2 | 42.95 |
| 9 | Mill Valley | 6A | 9-0 | 42.41 |
| 10 | Maize | 6A | 8-1 | 41.42 |
| 11 | Bishop Carroll | 5A | 8-1 | 40.23 |
| 12 | Lawrence | 6A | 7-2 | 37.92 |
| 13 | Silver Lake | 2A | 9-0 | 37.78 |
| 14 | Olathe Northwest | 6A | 7-2 | 37.62 |
| 15 | St. Thomas Aquinas | 4A | 6-3 | 37.42 |
| 16 | McPherson | 4A | 8-1 | 35.52 |
| 17 | Buhler | 4A | 7-2 | 34.96 |
| 18 | Spring Hill | 5A | 8-1 | 33.67 |
| 19 | Gardner Edgerton | 6A | 7-2 | 32.87 |
| 20 | Wamego | 4A | 7-1 | 32.79 |
| 21 | De Soto | 5A | 9-0 | 32.59 |
| 22 | St. James Academy | 5A | 6-3 | 32.32 |
| 23 | Blue Valley North | 5A | 4-5 | 32.31 |
| 24 | Tonganoxie | 4A | 6-3 | 31.79 |
| 25 | Great Bend | 4A | 7-2 | 30.81 |
| 26 | Basehor-Linwood | 5A | 7-2 | 30.56 |
| 27 | Andover | 5A | 9-0 | 30.24 |
| 28 | Eudora | 4A | 7-2 | 29.61 |
| 29 | Garden City | 6A | 6-3 | 29.26 |
| 30 | Junction City | 6A | 4-5 | 29.01 |
| 31 | Jefferson West | 3A | 7-2 | 27.60 |
| 32 | Blue Valley Northwest | 6A | 5-4 | 26.90 |
| 33 | Topeka Hayden | 3A | 5-4 | 26.85 |
| 34 | Shawnee Mission East | 6A | 3-6 | 26.56 |
| 35 | Olathe West | 6A | 6-3 | 26.45 |
| 36 | Louisburg | 4A | 7-2 | 25.86 |
| 37 | Hesston | 3A | 8-1 | 25.62 |
| 38 | Olathe North | 6A | 6-3 | 25.37 |
| 39 | Wellington | 4A | 7-2 | 25.35 |
| 40 | Rossville | 1A | 7-2 | 24.89 |
| 41 | Chapman | 3A | 7-2 | 24.58 |
| 42 | Cheney | 3A | 7-2 | 24.42 |
| 43 | Topeka Seaman | 5A | 5-4 | 24.05 |
| 44 | Wichita East | 6A | 3-6 | 23.33 |
| 45 | Wichita Southeast | 6A | 6-3 | 22.82 |
| 46 | Holcomb | 3A | 8-1 | 22.70 |
| 47 | Paola | 4A | 5-4 | 22.58 |
| 48 | Salina Central | 5A | 6-3 | 22.36 |
| 49 | Sterling | 1A | 9-0 | 22.35 |
| 50 | Rock Creek | 4A | 7-2 | 22.31 |
| 51 | Rose Hill | 4A | 5-4 | 22.21 |
| 52 | Caney Valley | 2A | 9-0 | 22.18 |
| 53 | Sabetha | 2A | 9-0 | 21.47 |
| 54 | Wichita Collegiate | 3A | 5-4 | 19.94 |
| 55 | Nemaha Central | 3A | 6-3 | 19.01 |
| 56 | Shawnee Mission Northwest | 6A | 4-5 | 18.70 |
| 57 | Baldwin | 3A | 7-2 | 18.38 |
| 58 | Riverside | 2A | 8-1 | 18.36 |
| 59 | Council Grove | 2A | 8-1 | 18.06 |
| 60 | Hutchinson | 5A | 4-5 | 17.73 |
| 61 | Salina South | 5A | 6-3 | 17.71 |
| 62 | Goddard Eisenhower | 5A | 5-4 | 17.61 |
| 63 | Lawrence Free State | 6A | 4-5 | 17.55 |
| 64 | Marysville | 2A | 7-2 | 16.69 |
| 65 | Kansas City Washington | 5A | 7-2 | 16.62 |
| 66 | Goddard | 5A | 4-5 | 16.61 |
| 67 | Maize South | 5A | 4-5 | 16.46 |
| 68 | Washburn Rural | 6A | 4-5 | 16.38 |
| 69 | Southeast of Saline | 2A | 5-4 | 16.13 |
| 70 | Wellsville | 3A | 9-0 | 16.09 |
| 71 | Liberal | 5A | 3-6 | 15.80 |
| 72 | Hoisington | 3A | 7-2 | 15.78 |
| 73 | Ulysses | 4A | 7-2 | 15.64 |
| 74 | Augusta | 4A | 6-3 | 15.62 |
| 75 | Kansas City Piper | 5A | 6-3 | 14.99 |
| 76 | Frontenac | 3A | 9-0 | 14.81 |
| 77 | Riley County | 2A | 7-2 | 14.48 |
| 78 | Mulvane | 4A | 4-5 | 14.36 |
| 79 | Beloit | 2A | 8-1 | 14.26 |
| 80 | Andover Central | 5A | 3-6 | 14.13 |
| 81 | Blue Valley Southwest | 5A | 2-7 | 13.00 |
| 82 | Chaparral | 2A | 9-0 | 12.86 |
| 83 | Hugoton | 3A | 5-4 | 11.93 |
| 84 | Haven | 2A | 7-2 | 11.11 |
| 85 | Osage City | 2A | 7-2 | 10.49 |
| 86 | Wichita Heights | 6A | 2-7 | 10.40 |
| 87 | Inman | 1A | 7-2 | 10.21 |
| 88 | Ottawa | 4A | 5-4 | 9.38 |
| 89 | Dodge City | 6A | 3-6 | 8.99 |
| 90 | Garden Plain | 2A | 7-2 | 8.61 |
| 91 | Smith Center | 1A | 7-2 | 8.16 |
| 92 | Royal Valley | 2A | 5-4 | 7.98 |
| 93 | Olathe South | 6A | 5-4 | 7.46 |
| 94 | Independence | 4A | 6-3 | 7.41 |
| 95 | Columbus | 3A | 6-3 | 7.32 |
| 96 | Shawnee Mission North | 6A | 4-5 | 6.87 |
| 97 | Fort Scott | 4A | 6-3 | 6.33 |
| 98 | St. Marys | 1A | 3-6 | 5.14 |
| 99 | Lansing | 4A | 4-5 | 5.11 |
| 100 | Neodesha | 2A | 8-1 | 5.10 |
| 101 | Thomas More Prep-Marian | 1A | 9-0 | 4.83 |
| 102 | Girard | 3A | 5-4 | 4.69 |
| 103 | Jefferson County North | 1A | 8-1 | 4.24 |
| 104 | Blue Valley West | 6A | 0-9 | 4.19 |
| 105 | Goodland | 3A | 5-4 | 3.84 |
| 106 | Hillsboro | 1A | 6-3 | 3.61 |
| 107 | Newton | 5A | 1-8 | 3.58 |
| 108 | Kingman | 2A | 8-1 | 2.63 |
| 109 | Chanute | 4A | 3-6 | 2.27 |
| 110 | McLouth | 1A | 8-1 | 1.94 |
| 111 | Pratt | 3A | 4-5 | 1.51 |
| 112 | Emporia | 5A | 4-5 | 0.94 |
| 113 | Campus | 6A | 0-9 | 0.74 |
| 114 | Arkansas City | 4A | 2-7 | 0.54 |
| 115 | Pittsburg | 5A | 3-6 | -0.15 |
| 116 | Scott Community | 3A | 2-7 | -0.24 |
| 117 | Perry-Lecompton | 3A | 4-5 | -0.33 |
| 118 | Baxter Springs | 2A | 5-4 | -0.65 |
| 119 | Winfield | 4A | 3-6 | -0.78 |
| 120 | Olathe East | 6A | 0-9 | -0.85 |
| 121 | Centralia | 1A | 6-3 | -2.08 |
| 122 | Burlington | 3A | 7-2 | -2.17 |
| 123 | Leavenworth | 5A | 3-6 | -2.70 |
| 124 | Phillipsburg | 2A | 3-6 | -2.73 |
| 125 | Labette County | 4A | 4-5 | -2.74 |
| 126 | Wichita South | 6A | 2-7 | -2.86 |
| 127 | Valley Center | 5A | 2-7 | -2.98 |
| 128 | Cimarron | 2A | 4-5 | -3.37 |
| 129 | Concordia | 3A | 3-6 | -3.45 |
| 130 | Santa Fe Trail | 3A | 4-5 | -3.76 |
| 131 | Clay Center | 3A | 2-7 | -4.30 |
| 132 | Circle | 4A | 2-7 | -4.35 |
| 133 | Halstead | 2A | 4-5 | -4.72 |
| 134 | Olpe | 1A | 7-2 | -5.30 |
| 135 | Norton | 2A | 4-5 | -5.39 |
| 136 | Douglass | 2A | 5-4 | -6.06 |
| 137 | Iola | 3A | 4-5 | -6.70 |
| 138 | Shawnee Mission South | 6A | 1-8 | -7.11 |
| 139 | St. Mary’s-Colgan | 1A | 5-4 | -7.42 |
| 140 | Topeka | 6A | 1-8 | -7.94 |
| 141 | Plainville | 1A | 4-5 | -8.43 |
| 142 | Bonner Springs | 4A | 1-8 | -9.31 |
| 143 | Shawnee Mission West | 6A | 0-9 | -11.77 |
| 144 | Abilene | 4A | 1-8 | -11.92 |
| 145 | Shawnee Heights | 5A | 1-8 | -12.09 |
| 146 | Wichita Trinity Academy | 3A | 2-7 | -13.30 |
| 147 | Clearwater | 3A | 1-8 | -14.34 |
| 148 | Conway Springs | 1A | 5-4 | -14.42 |
| 149 | Jackson Heights | 1A | 4-5 | -14.82 |
| 150 | Riverton | 2A | 4-5 | -15.23 |
| 151 | Holton | 3A | 2-7 | -16.52 |
| 152 | Medicine Lodge | 1A | 4-5 | -17.48 |
| 153 | El Dorado | 4A | 1-8 | -19.36 |
| 154 | Oskaloosa | 2A | 3-6 | -20.36 |
| 155 | Colby | 3A | 2-7 | -20.53 |
| 156 | Remington | 1A | 4-5 | -21.11 |
| 157 | Wabaunsee | 1A | 4-5 | -21.46 |
| 158 | Onaga | 1A | 5-4 | -22.02 |
| 159 | Cherryvale | 2A | 4-5 | -22.80 |
| 160 | Marion | 2A | 2-7 | -23.34 |
| 161 | Wichita West | 5A | 1-8 | -23.46 |
| 162 | Moundridge | 1A | 5-4 | -23.60 |
| 163 | Kansas City Sumner | 4A | 7-2 | -23.74 |
| 164 | Pleasant Ridge | 2A | 3-6 | -24.29 |
| 165 | Ellsworth | 2A | 2-7 | -24.32 |
| 166 | Smoky Valley | 3A | 3-6 | -25.36 |
| 167 | Central Heights | 2A | 5-4 | -25.36 |
| 168 | Humboldt | 2A | 6-3 | -25.46 |
| 169 | Topeka West | 5A | 1-8 | -25.48 |
| 170 | Galena | 2A | 1-8 | -26.41 |
| 171 | Salina Sacred Heart | 1A | 4-5 | -27.13 |
| 172 | Prairie View | 3A | 5-4 | -27.65 |
| 173 | Lyons | 3A | 5-4 | -28.17 |
| 174 | Atchison County | 1A | 1-8 | -28.36 |
| 175 | Republic County | 1A | 3-6 | -28.79 |
| 176 | Kansas City Turner | 5A | 1-8 | -29.02 |
| 177 | Anderson County | 3A | 1-8 | -30.58 |
| 178 | Valley Heights | 1A | 6-3 | -31.07 |
| 179 | Maur Hill Prep | 1A | 3-6 | -31.11 |
| 180 | Topeka Highland Park | 4A | 4-5 | -31.32 |
| 181 | Parsons | 3A | 1-8 | -31.34 |
| 182 | Field Kindley | 4A | 0-9 | -31.49 |
| 183 | Belle Plaine | 1A | 2-7 | -31.50 |
| 184 | Russell | 2A | 1-8 | -31.89 |
| 185 | Larned | 3A | 1-8 | -32.28 |
| 186 | Minneapolis | 2A | 1-8 | -34.47 |
| 187 | Hiawatha | 3A | 1-8 | -35.43 |
| 188 | Jayhawk Linn | 2A | 3-6 | -36.18 |
| 189 | Horton | 2A | 3-6 | -36.26 |
| 190 | Southwestern Heights | 2A | 3-6 | -36.74 |
| 191 | Bishop Ward | 3A | 1-7 | -36.83 |
| 192 | Lakin | 2A | 1-8 | -37.39 |
| 193 | Ellinwood | 1A | 1-8 | -37.65 |
| 194 | Atchison | 3A | 3-6 | -39.33 |
| 195 | Wichita North | 6A | 0-9 | -40.13 |
| 196 | Mission Valley | 1A | 1-8 | -40.52 |
| 197 | Fredonia | 2A | 1-8 | -41.15 |
| 198 | Kansas City Wyandotte | 6A | 1-8 | -41.99 |
| 199 | Nickerson | 3A | 1-8 | -43.00 |
| 200 | Hutchinson Trinity | 1A | 1-8 | -43.59 |
| 201 | Kansas City Harmon | 5A | 4-5 | -44.08 |
| 202 | Osawatomie | 3A | 2-7 | -44.42 |
| 203 | Valley Falls | 1A | 1-8 | -44.99 |
| 204 | Doniphan West | 1A | 1-8 | -48.25 |
| 205 | West Franklin | 2A | 1-8 | -51.12 |
| 206 | Syracuse | 1A | 1-8 | -53.07 |
| 207 | Uniontown | 1A | 3-6 | -53.57 |
| 208 | Kansas City Schlagle | 4A | 2-7 | -54.75 |
| 209 | Eureka | 1A | 1-8 | -56.63 |
| 210 | Sedgwick | 1A | 1-8 | -57.32 |
| 211 | Northeast | 1A | 2-7 | -57.76 |
| 212 | Bluestem | 1A | 1-8 | -59.99 |
| 213 | Maranatha Academy | 2A | 0-9 | -63.90 |
Average rating by Class
| Class | Avg. Rating |
| 6A | +16.04 |
| 5A | +14.01 |
| 4A | +9.02 |
| 3A | -3.04 |
| 2A | -9.04 |
| 1A | -21.73 |
Playoff Predictions
After the first round of playoff games, here is who we see as having the best odds to win the State Title for each Class:
6A
5A
4A
3A
2A
1A
The first week of the playoffs made quite a few changes to the odds, as the increased cross-play between teams of different sub-regions and leagues helped us get a fuller picture of the relatives strengths of everyone.
6A now looks wide open, with perennial powers Mill Valley and Derby at the top but neither clearing a 21% chance. 5A is still Kapaun’s to lose, but they are only expected to win state a little over half the time. Miege in 4A has a little better chance but still not the easiest path, as they draw Aquinas in the second round. Andale should win 3A, as should Silver Lake in 2A. But it is 1A that has the best potential state championship game…a Rossville/Sterling matchup would be exciting.
Power Ratings for 2015. To compare teams, subtract one team’s rating from the other. This will provide an estimated skill difference in points per game.
| Rank | Team | Class | Record | Rating |
| 1 | Mill Valley | 5A | 12-1 | 66.91 |
| 2 | Bishop Miege | 4A-I | 12-1 | 63.71 |
| 3 | St. Thomas Aquinas | 5A | 9-3 | 57.72 |
| 4 | Derby | 6A | 12-1 | 55.97 |
| 5 | Blue Valley | 6A | 10-3 | 48.84 |
| 6 | Lawrence Free State | 6A | 8-4 | 48.33 |
| 7 | Junction City | 6A | 10-1 | 45.62 |
| 8 | Blue Valley North | 6A | 8-2 | 43.81 |
| 9 | Lawrence | 6A | 10-1 | 43.61 |
| 10 | Shawnee Mission East | 6A | 9-2 | 42.78 |
| 11 | Wichita Northwest | 6A | 10-1 | 41.78 |
| 12 | Olathe North | 6A | 9-3 | 41.54 |
| 13 | Bishop Carroll | 5A | 11-2 | 40.86 |
| 14 | Wichita Collegiate | 3A | 13-1 | 40.08 |
| 15 | Shawnee Mission West | 6A | 7-3 | 39.22 |
| 16 | Topeka | 6A | 8-2 | 39.08 |
| 17 | Pittsburg | 5A | 9-2 | 38.71 |
| 18 | Bonner Springs | 5A | 7-2 | 38.11 |
| 19 | Rossville | 3A | 14-0 | 37.44 |
| 20 | Hutchinson | 6A | 6-4 | 35.24 |
| 21 | St. James Academy | 5A | 9-2 | 35.23 |
| 22 | Eudora | 4A-I | 8-4 | 33.30 |
| 23 | Louisburg | 4A-I | 7-3 | 30.83 |
| 24 | Buhler | 4A-I | 10-1 | 30.83 |
| 25 | Garden City | 6A | 7-2 | 30.73 |
| 26 | Holcomb | 4A-II | 11-2 | 30.23 |
| 27 | Scott Community | 3A | 10-1 | 30.18 |
| 28 | Paola | 4A-I | 9-2 | 30.05 |
| 29 | Hoisington | 3A | 11-1 | 29.93 |
| 30 | Dodge City | 6A | 5-4 | 29.90 |
| 31 | Halstead | 3A | 12-1 | 29.48 |
| 32 | Olathe Northwest | 6A | 6-3 | 29.12 |
| 33 | Manhattan | 6A | 5-4 | 28.40 |
| 34 | Andale | 4A-II | 9-3 | 28.34 |
| 35 | Andover Central | 4A-I | 10-3 | 24.65 |
| 36 | Abilene | 4A-I | 9-2 | 24.22 |
| 37 | Blue Valley Northwest | 6A | 2-8 | 24.17 |
| 38 | Basehor-Linwood | 4A-I | 6-5 | 24.05 |
| 39 | Nemaha Central | 3A | 10-1 | 22.64 |
| 40 | Columbus | 4A-II | 11-1 | 22.59 |
| 41 | Washburn Rural | 6A | 5-4 | 22.55 |
| 42 | Lansing | 5A | 6-4 | 22.00 |
| 43 | Salina South | 5A | 5-5 | 22.00 |
| 44 | De Soto | 4A-I | 6-4 | 21.86 |
| 45 | Emporia | 5A | 4-5 | 21.67 |
| 46 | Maize South | 5A | 8-3 | 21.38 |
| 47 | Blue Valley West | 5A | 2-7 | 21.35 |
| 48 | Topeka Hayden | 4A-I | 10-2 | 20.90 |
| 49 | Silver Lake | 3A | 9-2 | 20.65 |
| 50 | Salina Central | 5A | 4-5 | 20.46 |
| 51 | Goddard | 5A | 6-4 | 20.08 |
| 52 | Wichita Heights | 5A | 7-4 | 19.87 |
| 53 | Norton | 3A | 9-3 | 19.18 |
| 54 | Ulysses | 4A-I | 8-2 | 18.84 |
| 55 | Phillipsburg | 2A-1A | 11-2 | 18.52 |
| 56 | Wichita West | 6A | 5-5 | 18.36 |
| 57 | Holton | 4A-II | 9-4 | 18.04 |
| 58 | Kapaun Mt. Carmel | 5A | 7-3 | 18.00 |
| 59 | Fort Scott | 4A-I | 7-3 | 17.64 |
| 60 | Wellsville | 3A | 10-3 | 16.44 |
| 61 | Great Bend | 5A | 7-3 | 16.43 |
| 62 | Atchison | 4A-I | 8-1 | 16.28 |
| 63 | Hesston | 3A | 8-2 | 16.13 |
| 64 | Gardner Edgerton | 6A | 2-7 | 15.80 |
| 65 | Mulvane | 4A-I | 5-5 | 15.00 |
| 66 | Smith Center | 2A-1A | 10-2 | 14.92 |
| 67 | Olathe East | 6A | 3-6 | 14.36 |
| 68 | McPherson | 4A-I | 5-4 | 13.50 |
| 69 | Wichita South | 6A | 5-4 | 13.08 |
| 70 | Blue Valley Southwest | 5A | 3-6 | 12.81 |
| 71 | Leavenworth | 5A | 2-8 | 12.24 |
| 72 | Augusta | 4A-I | 7-3 | 11.85 |
| 73 | Goddard Eisenhower | 5A | 7-5 | 11.35 |
| 74 | Ottawa | 4A-I | 5-4 | 10.72 |
| 75 | St. Mary’s-Colgan | 3A | 9-3 | 10.42 |
| 76 | Sabetha | 3A | 7-5 | 10.36 |
| 77 | Osawatomie | 4A-II | 7-3 | 10.20 |
| 78 | Jefferson West | 4A-II | 5-4 | 10.14 |
| 79 | Kansas City Piper | 4A-I | 4-6 | 9.70 |
| 80 | Shawnee Mission Northwest | 6A | 1-8 | 9.17 |
| 81 | Colby | 4A-II | 4-6 | 9.09 |
| 82 | Frontenac | 4A-II | 7-4 | 8.97 |
| 83 | Garden Plain | 3A | 9-2 | 8.02 |
| 84 | Perry-Lecompton | 4A-II | 4-5 | 7.86 |
| 85 | Hays | 4A-I | 2-7 | 7.61 |
| 86 | Pratt | 4A-II | 4-5 | 7.54 |
| 87 | Royal Valley | 4A-II | 6-3 | 7.28 |
| 88 | Hugoton | 4A-II | 5-6 | 6.99 |
| 89 | Baldwin | 4A-I | 2-7 | 6.95 |
| 90 | Maize | 5A | 1-8 | 6.89 |
| 91 | Southeast of Saline | 3A | 7-3 | 6.75 |
| 92 | Beloit | 3A | 7-3 | 6.71 |
| 93 | Campus | 6A | 2-7 | 6.69 |
| 94 | Valley Center | 5A | 4-5 | 6.61 |
| 95 | Meade | 2A-1A | 10-1 | 6.58 |
| 96 | Nickerson | 4A-II | 4-6 | 6.48 |
| 97 | Santa Fe Trail | 4A-II | 6-5 | 6.43 |
| 98 | Topeka Seaman | 5A | 2-8 | 6.37 |
| 99 | Galena | 3A | 7-4 | 6.22 |
| 100 | Olathe South | 6A | 1-8 | 5.99 |
| 101 | Wellington | 4A-I | 4-5 | 5.03 |
| 102 | Washington County | 3A | 10-1 | 4.56 |
| 103 | Shawnee Mission North | 6A | 3-7 | 4.35 |
| 104 | Concordia | 4A-II | 6-4 | 3.53 |
| 105 | Clay Center | 4A-II | 4-5 | 3.45 |
| 106 | Spring Hill | 4A-I | 2-7 | 3.21 |
| 107 | Prairie View | 4A-II | 5-4 | 2.88 |
| 108 | Larned | 4A-II | 4-5 | 2.87 |
| 109 | Kansas City Turner | 5A | 2-7 | 2.30 |
| 110 | Independence | 4A-I | 7-3 | 2.19 |
| 111 | Sedgwick | 2A-1A | 9-1 | 2.11 |
| 112 | Tonganoxie | 4A-I | 3-6 | 0.79 |
| 113 | Oakley | 2A-1A | 7-4 | 0.63 |
| 114 | Kingman | 3A | 4-5 | 0.23 |
| 115 | Wichita Trinity Academy | 4A-II | 6-3 | 0.20 |
| 116 | Wichita North | 6A | 1-9 | -0.69 |
| 117 | Troy | 2A-1A | 10-2 | -1.27 |
| 118 | Chaparral | 3A | 6-3 | -1.42 |
| 119 | Shawnee Mission South | 6A | 1-8 | -1.54 |
| 120 | Clearwater | 4A-II | 3-7 | -1.84 |
| 121 | Wamego | 4A-II | 5-6 | -1.87 |
| 122 | Labette County | 4A-I | 3-6 | -2.31 |
| 123 | Cherryvale | 3A | 8-2 | -2.43 |
| 124 | Rock Creek | 3A | 3-6 | -2.77 |
| 125 | Andover | 5A | 1-8 | -3.36 |
| 126 | Kansas City Schlagle | 5A | 4-5 | -4.30 |
| 127 | Parsons | 4A-II | 3-6 | -4.42 |
| 128 | Conway Springs | 3A | 6-4 | -4.65 |
| 129 | Girard | 4A-II | 6-4 | -6.25 |
| 130 | Riley County | 3A | 5-4 | -6.29 |
| 131 | Cimarron | 3A | 6-4 | -6.60 |
| 132 | Pleasant Ridge | 3A | 8-2 | -6.78 |
| 133 | Newton | 5A | 1-8 | -6.91 |
| 134 | Centralia | 3A | 5-5 | -7.06 |
| 135 | Cheney | 3A | 7-3 | -7.08 |
| 136 | Shawnee Heights | 5A | 3-7 | -7.79 |
| 137 | Riverside | 3A | 4-6 | -8.14 |
| 138 | Wichita East | 6A | 1-8 | -8.30 |
| 139 | Marysville | 3A | 4-6 | -8.89 |
| 140 | Wichita Southeast | 6A | 1-8 | -9.54 |
| 141 | Neodesha | 3A | 9-2 | -9.81 |
| 142 | Maur Hill Prep | 3A | 6-3 | -10.44 |
| 143 | Plainville | 2A-1A | 3-6 | -10.46 |
| 144 | Chanute | 4A-I | 2-7 | -11.26 |
| 145 | Liberal | 5A | 2-7 | -11.36 |
| 146 | Olpe | 2A-1A | 9-3 | -11.47 |
| 147 | Chapman | 4A-II | 4-5 | -11.50 |
| 148 | Salina Sacred Heart | 2A-1A | 5-5 | -11.94 |
| 149 | Wichita Independent | 3A | 4-7 | -12.85 |
| 150 | Ellis | 2A-1A | 6-4 | -13.35 |
| 151 | Iola | 4A-II | 3-6 | -13.39 |
| 152 | Arkansas City | 5A | 1-8 | -13.47 |
| 153 | Goodland | 4A-II | 3-6 | -14.16 |
| 154 | Caney Valley | 3A | 5-5 | -14.28 |
| 155 | Lyons | 3A | 3-7 | -14.58 |
| 156 | Jackson Heights | 2A-1A | 8-2 | -14.67 |
| 157 | Anderson County | 4A-II | 5-5 | -15.20 |
| 158 | Smoky Valley | 4A-II | 2-7 | -15.65 |
| 159 | El Dorado | 4A-I | 2-7 | -15.71 |
| 160 | Ellsworth | 3A | 5-4 | -16.57 |
| 161 | Winfield | 4A-I | 3-6 | -16.77 |
| 162 | Kansas City Sumner | 4A-I | 4-5 | -17.23 |
| 163 | Russell | 3A | 3-6 | -17.58 |
| 164 | Marion | 2A-1A | 7-2 | -17.78 |
| 165 | Council Grove | 3A | 6-3 | -17.78 |
| 166 | Sterling | 3A | 4-5 | -18.25 |
| 167 | Bennington | 2A-1A | 5-4 | -18.56 |
| 168 | Riverton | 3A | 2-7 | -18.86 |
| 169 | Northern Heights | 2A-1A | 6-4 | -19.43 |
| 170 | Hutchinson Trinity | 3A | 3-6 | -20.44 |
| 171 | Republic County | 2A-1A | 4-5 | -20.91 |
| 172 | LaCrosse | 2A-1A | 3-6 | -21.13 |
| 173 | Osage City | 3A | 4-5 | -21.34 |
| 174 | Topeka Highland Park | 5A | 0-9 | -22.08 |
| 175 | Mission Valley | 2A-1A | 7-3 | -22.14 |
| 176 | Fredonia | 3A | 5-4 | -22.15 |
| 177 | Lyndon | 2A-1A | 8-3 | -22.23 |
| 178 | Topeka West | 5A | 2-7 | -22.34 |
| 179 | Southwestern Heights | 3A | 4-5 | -22.37 |
| 180 | Burlington | 4A-II | 3-6 | -23.80 |
| 181 | St. Marys | 3A | 1-8 | -24.96 |
| 182 | Kansas City Wyandotte | 6A | 1-8 | -25.20 |
| 183 | Medicine Lodge | 2A-1A | 4-5 | -25.55 |
| 184 | Ell-Saline | 2A-1A | 3-6 | -25.81 |
| 185 | Jefferson County North | 2A-1A | 6-4 | -25.93 |
| 186 | Humboldt | 3A | 4-5 | -26.46 |
| 187 | Thomas More Prep-Marian | 3A | 1-8 | -26.67 |
| 188 | Oskaloosa | 3A | 4-5 | -26.71 |
| 189 | Rose Hill | 4A-I | 0-9 | -26.82 |
| 190 | Field Kindley | 4A-I | 0-9 | -27.90 |
| 191 | Haven | 4A-II | 1-8 | -28.89 |
| 192 | Doniphan West | 2A-1A | 4-5 | -28.90 |
| 193 | Bishop Ward | 4A-II | 0-9 | -30.02 |
| 194 | Valley Heights | 2A-1A | 2-7 | -30.56 |
| 195 | Wabaunsee | 2A-1A | 3-7 | -30.91 |
| 196 | Chase County | 2A-1A | 2-7 | -31.08 |
| 197 | Circle | 4A-I | 0-9 | -31.56 |
| 198 | Minneapolis | 3A | 0-9 | -32.22 |
| 199 | Baxter Springs | 4A-II | 2-7 | -32.43 |
| 200 | Lakin | 3A | 2-7 | -33.82 |
| 201 | Moundridge | 2A-1A | 3-6 | -34.00 |
| 202 | Kansas City Harmon | 6A | 2-7 | -34.51 |
| 203 | Inman | 2A-1A | 1-8 | -35.15 |
| 204 | Hillsboro | 3A | 0-9 | -35.32 |
| 205 | Kansas City Washington | 5A | 1-7 | -36.05 |
| 206 | Syracuse | 2A-1A | 4-6 | -36.32 |
| 207 | Jayhawk Linn | 3A | 5-5 | -36.98 |
| 208 | Atchison County | 3A | 3-6 | -38.50 |
| 209 | Southeast | 3A | 0-9 | -40.56 |
| 210 | Erie | 3A | 3-7 | -41.88 |
| 211 | West Franklin | 3A | 2-7 | -42.79 |
| 212 | Eureka | 3A | 2-7 | -42.80 |
| 213 | Douglass | 3A | 2-7 | -43.61 |
| 214 | Elkhart | 2A-1A | 4-5 | -44.38 |
| 215 | Onaga | 2A-1A | 1-8 | -45.16 |
| 216 | Hiawatha | 3A | 1-8 | -45.33 |
| 217 | Remington | 2A-1A | 1-8 | -45.89 |
| 218 | Yates Center | 2A-1A | 2-7 | -45.90 |
| 219 | McLouth | 3A | 1-8 | -47.09 |
| 220 | Northeast | 3A | 3-6 | -47.27 |
| 221 | Bluestem | 3A | 1-8 | -48.03 |
| 222 | Maranatha Academy | 2A-1A | 1-7 | -48.91 |
| 223 | Valley Falls | 2A-1A | 1-8 | -50.76 |
| 224 | Central Heights | 3A | 0-9 | -50.87 |
| 225 | Belle Plaine | 3A | 0-9 | -52.22 |
| 226 | Herington | 2A-1A | 0-9 | -52.79 |
| 227 | Horton | 3A | 0-9 | -54.64 |
| 228 | Stanton County | 2A-1A | 1-8 | -57.64 |
| 229 | Oswego | 2A-1A | 1-8 | -58.05 |
| 230 | Wichita County | 2A-1A | 1-8 | -59.79 |
| 231 | Sublette | 2A-1A | 2-7 | -62.08 |
| Class | Average Rating | State Champion | Runner-Up |
| 6A | 21.83 | Derby | Blue Valley |
| 5A | 12.86 | Mill Valley | Bishop Carroll |
| 4A-I | 9.19 | Bishop Miege | Andover Central |
| 4A-II | -0.20 | Holcomb | Holton |
| 3A | -12.85 | Rossville | Wichita Collegiate |
| 2A-1A | -26.62 | Phillipsburg | Troy |
Date of Projection: 7/20/2026
With the conclusion of the 2026 Major Championship Season as of yesterday, we now look ahead to 2027 and beyond. But before, here are the 2026 Major Champions and the expected major wins we had for them a year ago:
With 3/4 of the major champions coming from outside of the 25-most likely names, the 2026 major season proved that many from the field could still win a big event if things went right for him. This makes projecting actual major wins very difficult. Which is why our projection is more about what we think how the market will price a golfer’s odds come 2027 and future. While a golfer’s career can take many different paths, we want to estimate a median one given what said golfer has already shown us, which then can be calculated in terms of projected major championships.
2027 Season – Top 50
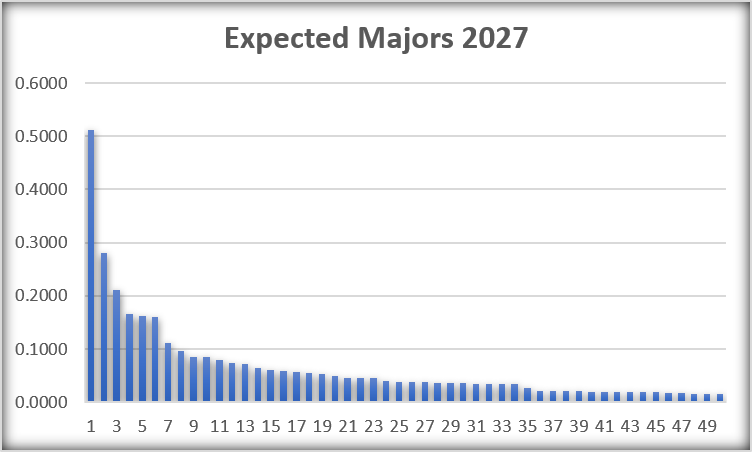
This chart shows the above table, with Scottie Scheffler’s chances at a major far higher than anyone else’s. There’s been some talk that Scheffler’s dominance is starting to wane (he’s only one once in 2026 and didn’t score a major victory), but Data Golf still has him as the best player in the world by a long shot. His true SG total is at +2.82 strokes for 2026, which is lower than either 2024 or 2025 yet still in front of both his 2022 and 2023 seasons.
Rory’s floor has continued to stay high, but next year will be his age 38 season and at some point there will be visible signs of age in his numbers. But given how solid he’s been, we don’t see that necessarily happening for a few years. The trio of Rahm, Schauffele, and DeChambeau are all prime candidates to win a third major within the next few years, but as all are in their 30’s, their best chances are going to come in the next 20 or so majors.
Cameron Young had a poor 2025, so his 2026 season might not be as replicable as people think. Or it might just have been the beginning of him truly reaching his prime years. It’s tough to know. Note that this list of 50 names is expected to win 83.6% of the majors, so don’t be too surprised if 2027 delivers another winner from outside this list, just as 2026 gave us Ryan Fox.
Projected Majors 2027 and Beyond
Now comes the fun part. By combining future projections from multiple seasons, we can better estimate what a player’s median career should be expected to be. Of course for many of these golfers, their careers will look nothing like what we show. Some longshots will win a major, while some solid players who give themselves multiple chances in majors might not ever win one. It’s tough to know now who those will be.
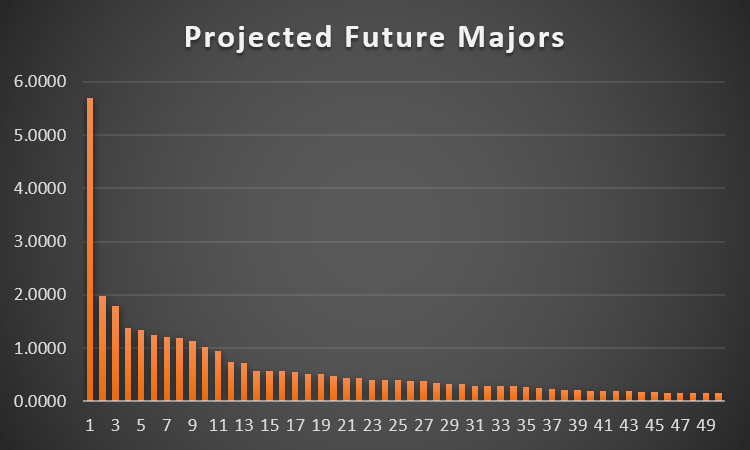
Once again, it is Scottie vs. the rest. At age 30, Scheffler is in his prime and should be for another decade or so. He’s shown enough of a floor in majors that bettors will continue to wager on him even seeing relatively low numbers next to his name. Could his game diminish enough to reduce this considerably? Of course. But the median look here sees him being the best player in the game for another 5+ years and still a force in the game well into his 40’s. Interestingly, Scheffler’s projected remaining career major total from a year ago was 5.83, meaning he only lost 0.13 expected majors in one year. While he didn’t win a major in 2026, it was yet another season which shows him to be the best golfer overall (he had finishes of 2, T14, T4, and T4 in the four majors). Expect more high finishes in 2027, with a possible victory or 2 in the grand slam events.
After Scheffler comes familiar names. Ludvig’s age and history help him. He is currently the 12th ranked golfer in Data Golf, shown himself to be a consistent ball-striker, and put up two top tens in majors in 2026. The market loves these numbers and will continue to bet Aberg in future years. Come five years and guys like Rory and Bryson and Tommy will be on the downslide of their age-curves. But Aberg will be at the peak of his. No guarantees, but he is going to be a legitimate contender in majors to come.
Five names among the next six are all more-or-less similar. Rahm, McIlroy, Morikawa, Schauffele, and DeChambeau. All multiple major winners. All still in their primes and will be contenders in 2027. But each will also be in his 30s the next time the Masters is played. As none are elite in the sense Scottie is, another victory isn’t guaranteed, but I’d wager it is more likely than not if betting on anyone of these guys individually.
Tom Kim and Akshay Bhatia show up due to their ages. Neither has shown himself to be an elite-level player yet, but given their ages and relative skill, they are expected to win about 1 major in their careers. Tom Kim has already posted some top finishes (T2 at 2023 British, 3rd at 2026 U.S. Open) while Akshay has only shown signs of yearly improvement while on tour.
Cameron Young is somewhere in the middle of these two groups of players. Still relatively young, he has time to win majors. But he’s also proven himself as capable in the big events, despite not winning one yet. He should receive the attention of the market during the times he is playing well. He doesn’t have any real weakness in his game, and also has the pedigree of being a bigtime player (won the Players and played well at the Ryder Cup).
After that, some call-outs include Tommy Fleetwood, who will turn 36 next year, still showing a solid chance to win a major. It may happen; it may not. Brooks Koepka, Jordan Spieth, and Justin Thomas are all multi-major winners in the same boat. About to age out of their primes within 3-5 years, not really contending in majors or other big events recently, etc. but still going to get attention from bettors. It just takes one week, and these guys have shown they can win while in contention. JT does have the T4 at this year’s PGA (which seems to be the only major he consistently plays well in), whereas Jordan’s last top 10 was the 2023 Masters and Brooks’ was his 2023 PGA Championship win.
Jackson Koivun makes it on the list as one of the up-and-comers. The 49th ranked DG player got good odds at the 2026 U.S. Open and is the real deal. His age and relative lack of experience on tour makes things difficult to project. I would love to say that in a couple years we will be projecting him to be a 2+ time major champion, but I also know to be cautious given there’ve been many can’t-miss stars that don’t pan out (Patrick Rodgers, Gordon Sargent come to mind). Others that are younger such as Miles Russell weren’t included at all as projecting their careers is even tougher. Also Blades Brown (87th in DG) has never played in a major.
That is it for the most part. Ideally we would update this projection more frequently, using pre-tournament projected odds as the events got closer while still forecasting out into the distance, using the ebbs and flows of professional golf to better fine tune our forecasts. For the moment we will have to live with this way.
Below is a list of seasons with statistical information about KU Baseball:
We’ve now entered the bracket portion of the World Cup, with 48 teams narrowed to 32 following the pool play.
To make things more relatable, I’ve positioned each match-up to its closest First Round NCAA Tournament seed-line game. For instance, because Canada had a 68.9% chance of winning against South Africa, this was closest to how a 5/12 game historically plays out, with the 5 seed winning about 2/3 of the time over a 12.
This will be updated as games are played and rounds are advanced to.
Round of 32
Completed Games:
The bracket round began with only 2 upsets out of 16, though the games weren’t without drama. The US was one of only five teams to win by multiple goals. Three of the games went to a shootout. The surprise run was from Cape Verde, who nearly sent the game into penalty kicks before losing 3-2 in overtime.
Round of 16
We will use potential NCAA Sweet 16 seed matchups as a comparison. These might not match 100% with historical results, but should still provide a good sentiment as to these team’s relative strengths:
Completed Games:
Quarterfinals
These games are Elite 8 contests, so we will match as close as possible to how Elite 8 teams have performed by seed.
Completed Games:
Semifinals
3rd Place Game
Championship Game
The 2026 World Cup bracket results (as corresponding to a NCAA Tournament) is here.
These rankings include the 2026 World Cup appearances but not the final results yet as the tournament is ongoing:
| Country | Points |
| Brazil | 8.3125 |
| Germany | 8.2396 |
| Italy | 6.2083 |
| Argentina | 6.0521 |
| France | 4.7917 |
| Uruguay | 3.3958 |
| Spain | 3.3333 |
| England | 3.0729 |
| Netherlands | 2.6146 |
| Sweden | 2.1146 |
| Hungary | 1.5833 |
| Belgium | 1.4792 |
| Serbia | 1.2917 |
| Croatia | 1.2917 |
| Mexico | 1.2188 |
| Poland | 1.0729 |
| Russia | 1.0417 |
| Switzerland | 1.0313 |
| Portugal | 1 |
| Austria | 0.9583 |
| United States | 0.9167 |
| Chile | 0.8125 |
| Slovakia | 0.8021 |
| Czech Republic | 0.7917 |
| South Korea | 0.7083 |
| Morocco | 0.6042 |
| Bulgaria | 0.5938 |
| Paraguay | 0.5938 |
| Romania | 0.5 |
| Colombia | 0.4479 |
| Scotland | 0.4271 |
| Turkey | 0.4167 |
| Peru | 0.3854 |
| Denmark | 0.375 |
| Japan | 0.375 |
| Cameroon | 0.3646 |
| Costa Rica | 0.3125 |
| Australia | 0.3125 |
| Norway | 0.2917 |
| Nigeria | 0.2813 |
| Ghana | 0.2813 |
| Ireland | 0.25 |
| Senegal | 0.25 |
| Northern Ireland | 0.25 |
| Iran | 0.2396 |
| Saudi Arabia | 0.2396 |
| Tunisia | 0.2396 |
| Algeria | 0.2083 |
| Egypt | 0.1979 |
| Ecuador | 0.1875 |
| Bolivia | 0.1667 |
| North Korea | 0.1563 |
| Wales | 0.1563 |
| Greece | 0.1354 |
| Canada | 0.1354 |
| Cuba | 0.125 |
| East Germany | 0.125 |
| Ukraine | 0.125 |
| Ivory Coast | 0.125 |
| South Africa | 0.125 |
| El Savador | 0.1042 |
| Honduras | 0.1042 |
| DR Congo | 0.0938 |
| New Zealand | 0.0938 |
| Haiti | 0.0833 |
| Indonesia | 0.0625 |
| Iraq | 0.0625 |
| Israel | 0.0625 |
| Slovenia | 0.0625 |
| Bosnia and Herzegovina | 0.0625 |
| Panama | 0.0521 |
| Qatar | 0.0521 |
| Kuwait | 0.0417 |
| United Arab Emirates | 0.0417 |
| Angola | 0.0313 |
| China | 0.0313 |
| Iceland | 0.0313 |
| Jamaica | 0.0313 |
| Togo | 0.0313 |
| Trinidad and Tobago | 0.0313 |
| Cape Verde | 0.0313 |
| Curacao | 0.0208 |
| Jordan | 0.0208 |
| Uzbekistan | 0.0208 |
As with our other rankings, this is done by taking how well a team finished in a certain tournament and calculating this finish as a factor of the champion (who earns 1 full point); and then accumulating the entirety of the event for each team. The champion gets 1 full point, the runner-up 1/2 point, the semi-finalists 1/4 point, etc. In this instance there is a third-place game, so third-place earns 1/3 point and the fourth-place finisher 1/4.
Brazil is the leading team all-time, but just barely over Germany. Brazil has 5 total World Cup championships, but also fewer trips to the semifinals or finals than Germany does. Brazil is also the only nation to qualify for all 23 World Cups. The first team outside of Europe or South America in this ranking is Mexico at 15th, and the United States is 21st. With 12 appearances, the U.S. has been to the World Cup more times than Portugal (9), Hungary (9), Paraguay (9), and Austria (8).
The Netherlands is the best team which hasn’t won the World Cup (9th), and Sweden sitting up in 10th is somewhat of a surprise. South Korea at 25th is the best team from Asia. Morocco at 26th is the best team from Africa. The best team not in the 2026 World Cup is Italy. The 3rd-best team all-time hasn’t made it to any of the last three World Cups.
There are 84 total countries listed on here with a potential for more to join, particularly now that the tournament expanded to 48 teams in 2026. In the footnotes1 is some information about where the results of former countries roll up into. Additionally, East Germany is the only currently defunct nation without a successor country on the list.

