
Although the season ended on a bitter note, the 2026 Kansas Jayhawks finished as Big 12 Regular Season Champions, Big 12 Conference Champions, and Lawrence Regional Champions. Their final record of 45-16 set a school record for wins. As in basketball, we’ve decided to take a deeper look at the numbers, attempting to quantify a value metric for each player in relation to a benchmark player. The benchmark player for baseball will be an average D1 player. The final metric will be AERAA, or Adjusted Expected Runs Against Average.
We will first take a look at KU’s Batting Stats.
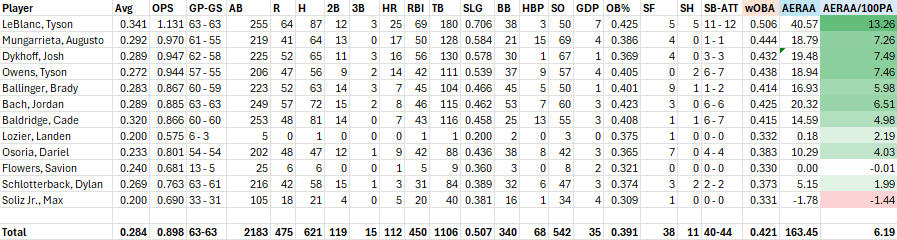
The first columns are all traditionally calculated numbers, with wOBA being similar to how it is calculated in other places. Then we arrive at AERAA, showing that Tyson Leblanc has given the Jayhawks 40.6 additional runs compared to an average D1 player. The final stat, which is color-coded, is AERAA rated per 100 plate appearances (including sacrifices) to help show how good the lesser-used players have done on a per PA basis.
Offensively, Kansas produced an estimated 163.45 runs above average on the year, or 2.59 runs per game (and 6.19 runs per 100 PA) better than an average D1 team would be expected to score given its schedule and innings played at bat.
Next is KU’s Pitching Stats.
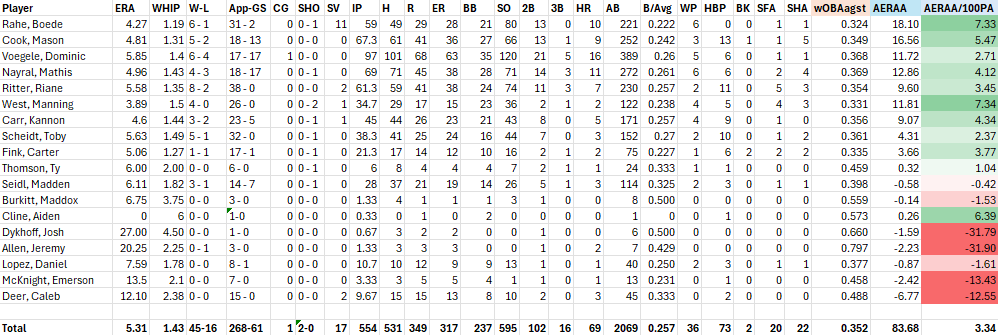
KU’s pitching wasn’t quite as solid as its offense was. The Hawks pitching was +83.68 runs all season, which works out to 1.33 runs per game (3.34 runs per 100 PA). Closer Boede Rahe had the highest estimated AERAA on the year, earning Kansas an estimated 18.10 runs (in 59 innings–fifth best on the team but often high-leverage).
Overall
Overall, this shows Kansas as a +265.43 team (+4.21 per game), which makes sense compared to the team’s PEAR Rating (north of 5, but is likely skewed toward more recent results).
Defense
Going back through the team’s play-by-play logs and available video, we’ve estimated that the Hawks added 18.30 runs defensively. The team’s normal catcher Augusto Mungarrieta was KU’s best overall defender, saving an estimated 7.02 runs defensively. Cade Baldridge was second with 6.51 runs saved. The rest of the team’s final defensive runs saved estimate can be seen in the below matrix.
Matrix
The final value metrics look like this. The table is sorted by Total runs of value from most to least:
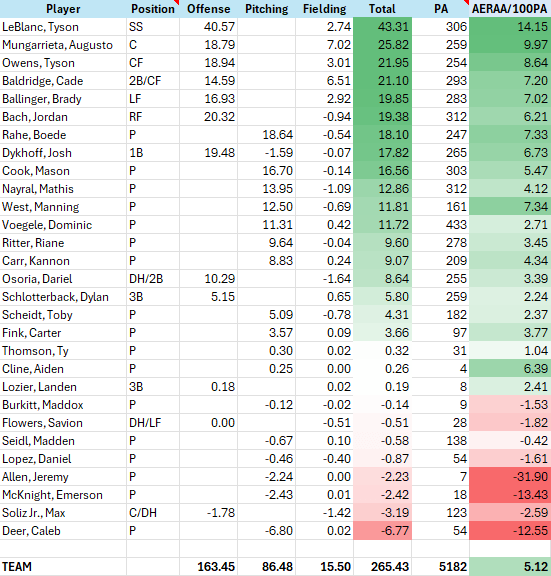
Positions listed are the most common for that player, and runs added are broken down by three primary categories: Offense (hitting + baserunning), Pitching, and Fielding. Plate appearances indicate how many PA’s a player faced either as a batter and/or a pitcher. This then allows us to rate how well a player produced value per his chances (AAERA/100PA).
SS Tyson LeBlanc remains the team’s MVP, playing decent defense at the second-hardest position in the field while hitting the ball like an All-American. After him was a lot of solid collegiate baseball players. Augie bolstered a solid offensive season with great defensive behind the dish. Tyson Owens became a very reliable centerfielder who had power and speed at the plate. Cade Baldridge was dependable wherever, but he became the starting 2B before an injury sidelined him for the Super Regionals. Brady Ballinger had good instinct in LF and was a tough out. Jordan Bach was a better offensive threat than defender, but overall a solid player. Josh Dykhoff at 1B wasn’t far behind. Rounding out the position players, both Osoria and Schlotterback were above replacement level.
Boede Rahe was KU’s best pitcher, though Manning West was slightly more valuable on a per PA basis. The team’s pitching wasn’t elite, but it was solid enough to win some games for a team that would host a Regional and Super Regional in the NCAA Tournament for the first time ever.
A Bit more About AERAA
AERAA is similar to how other one-number metrics (WAR) are made, but it also has some unique components, including looking at estimated runs generated by summing total bases (including baserunning plusses/minuses, sacrifices, etc.) against outs generated (grounded into double-plays, baserunning outs, sacrifices, etc.). We find it to be a solid estimate in terms of runs created per player.
Unlike WAR for MLB stats, a big component to AERAA is the opponent adjustment factor. The best and worst MLB teams are separated by a differential of net 3.5 runs per game…in D1 college baseball this number is 18.7. Of course MLB’s schedules are relatively balanced, unlike college baseball’s. Thankfully, PEARatings helps us estimate team strength for each opponent relative to the average D1 team. This allowed us to more reasonably estimate things.
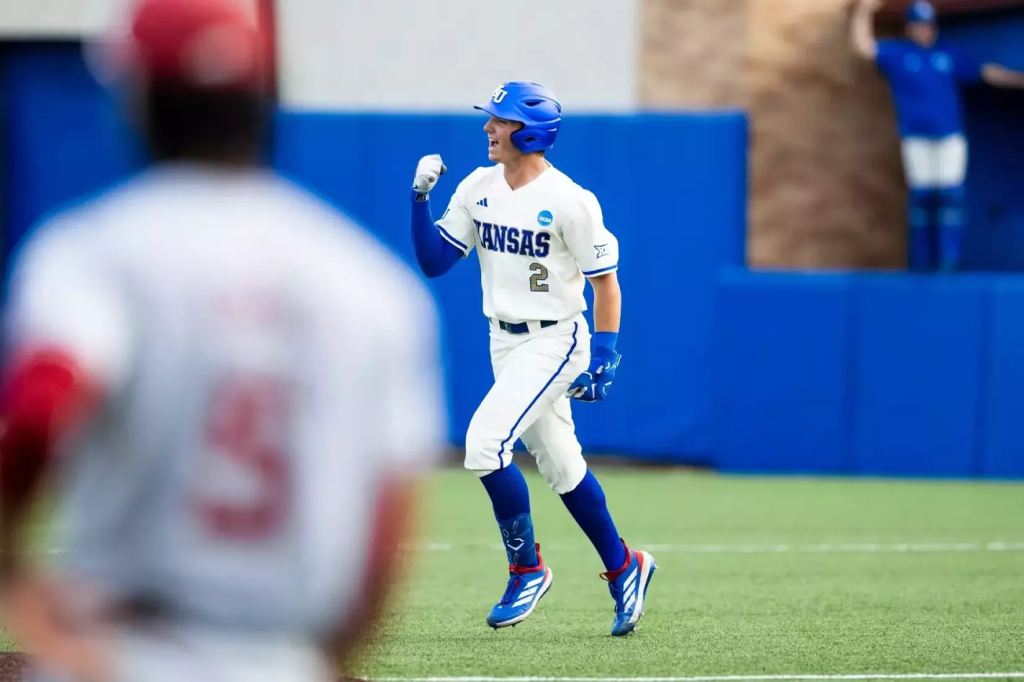
SS Tyson LeBlanc had a program-high 25 HR’s for the 2026 Jayhawks.

 Charting the Hawks
One thought on “2026 Kansas Jayhawks Baseball”