Wrapping Up the 2024 Season

Note: The value-metrics in this write-up might not match the final published numbers, as the 2024 college basketball season is still being played. But since KU’s season is complete, the only changes to value-metrics will be small and due to what happens with KU’s opponents and how their computer metrics trickle down.

The 2024 team came in with high expectations. Landed the best big-man transfer in the portal. Landed a sought-after portal wing and highly-athletic combo-guard. Returned three starters from team that earned a 1-seed in 2023. A McDonald’s All-American guard leading a decent recruiting class. A healthy coach. Pre-season AP #1. This took a bit of a hit when they lost Arterio Morris to a felony charge. Even still, on paper the team was expected to be good.

For the most part during the non-conference, Kansas lived up to expectations. Sure, its computer metrics took a when it failed to blow out certain teams it should have (Eastern Illinois, UMKC, Missouri). But it got huge wins against the likes of Kentucky, Tennessee, and Connecticut. At 12-1 heading into conference play, the team was trending toward another 1-seed.

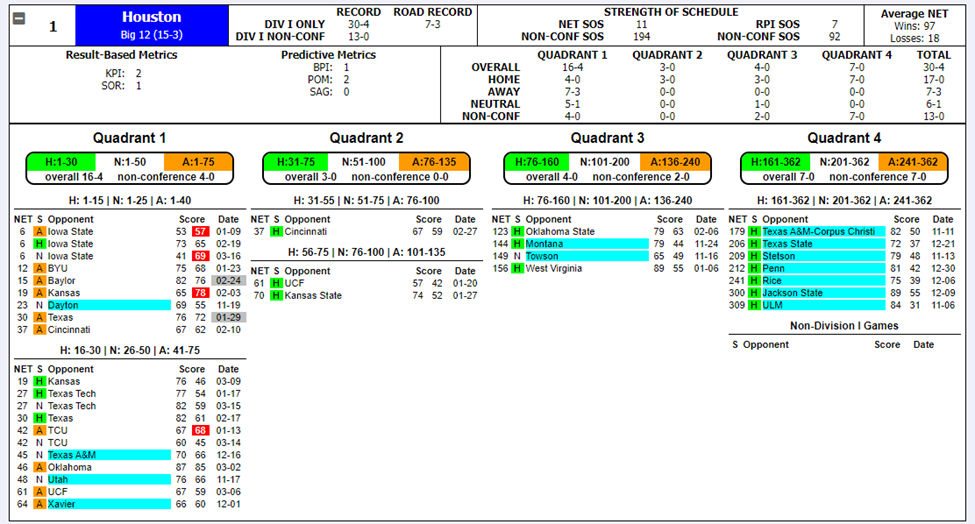
The conference schedule was back-loaded in terms of difficulty, so the Jayhawks knew they had to play well in January. Unfortunately, the team lost to UCF and West Virginia on the road (as well as Kansas State in early February). It did have nice home wins—including a 13-point win against Houston in early February—but after McCullar got injured Kansas struggled to find any consistency. Since January 1, KU didn’t win or lose more than 3 games in a row. The team couldn’t find any momentum on the season, although saying the wheels fell off does seem like a stretch.

With that said, the focus on the season recap will be to look at how the roster performed relative to value metrics that help us judge players across seasons. We will also look at how each player did compared to his pre-season expectation, and finally look at the team as a whole. The shooting splits will be listed in the order of FG%/3-pt%/FT%.

Dajuan Harris

Traditional Stat-Line: 8.5 PPG, 6.5 APG, 2.0 RPG, 1.5 SPG, 0.4 BPG on 35.7 MPG, 42.4%/38.4%/80.4%.

Pre-season Value Projection: +2.50 PPGAB, +4.20 Per100AB, +4.24 WAR

Actual Value Score: -0.14 PPGAB, -0.23 Per100AB, +1.57 WAR

Harris was projected to be KU’s second most-valuable player for 2024, as that’s what he was in 2023. But he got off to an awful start to the 2024 season. Aside from a stellar shooting night against Kentucky, he failed to reach double-figures in points until Indiana (11th game of the season). His defensive metrics were poor to begin the year. Through 10 games he was a -1.27 per game defender (in 2023 he was a +2.17 per game defender). This poor play wasn’t reflected much in the team’s overall record, but it did but Juan behind the 8-ball as far as his season-long performance.

By conference season, Harris would begin to play better, improving on the whole until he started playing near the level he had last season. Over his final 15 games, Harris was +2.54 per game, right where he was projected to be on the season. As these games included the stretch run and tournament play, it should be noted that he basically became the player KU was expecting him to be by the time the games really mattered. This makes his season a bit odd. KU played better during the part of the season where its point guard was playing worse. Given how polarizing he is as a player, this makes things even more confusing.

Harris will be back in 2025. There will be plenty of time to look ahead and forecast out his final season in a Kansas uniform. But in looking back at his 2024 campaign, Harris’ Per100 value metrics put him in the 34.5%ile of all Jayhawk rotation players since 1993. You want more from your starter than this. And while he can’t shoulder all of the blame on the team’s poor season, had he been as good as expected from Day 1, the team may have been a bit more competitive.
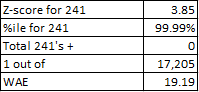
Elmarko Jackson

Traditional Stat-Line: 4.3 PPG, 1.7 APG, 1.4 RPG, 0.8 SPG, 0.1 BPG on 18.6 MPG, 40.6%/26.7%/76.9%.

Pre-season Value Projection: +0.10 PPGAB, +0.20 Per100AB, +1.44 WAR

Actual Value Score: -2.20 PPGAB, -6.83 Per100AB, -1.26 WAR

Freshmen are basically projected on a curve given their incoming class-ranking, so Jackson was expected to be about bubble-level given how the rating services saw him as a high school senior. Even during the off-season, 2024 NBA mock drafts had him as a possible lottery pick given his intangibles (explosive player, good size as a guard, decent-looking stroke, and so on). Nothing close to this potential developed in 2024. Jackson was given the starting spot in the backcourt to begin the season—in large part due to the poor play of others competing for that role—until he started to slump at the beginning of conference play as was replaced by Johnny Furphy.

Jackson’s season is at the bottom of the list in terms of KU history since 1993. He had the second-worst PPGAB score over the last 3+ decades (Quentin Grimes). His Per100 score was in the 3.85%ile of all rotation players, clearing only a hand-full of role-players and walk-ons who played minutes on past KU teams with depth issues (i.e. Jeff Hawkins and Moulaye Niang in 2003). His WAR, thanks to him playing so many minutes, was the worst in the 1993-2024 span.

It was a disaster of a season for Elmarko. He appeared in all 34 games, but only had an above-bubble impact in 8 of them. (Offensively, he was above-bubble in only 5 of 34). His non-conference play of -0.83 PPGAB looks relatively strong, compared to how he ended the season. Since the beginning of the conference season in early January, Jackson was a -3.05 PPGAB player.

Kevin McCullar

Traditional Stat-Line: 18.3 PPG, 4.1 APG, 6.0 RPG, 1.5 SPG, 0.4 BPG on 34.2 MPG, 45.4%/33.3%/80.5%.

Pre-season Value Projection: +1.71 PPGAB, +3.25 Per100AB, +3.23 WAR

Actual Value Score: +3.97 PPGAB, +6.71 Per100AB, +4.22 WAR

McCullar was a late-returnee for Kansas, coming back after nearly going pro. His return was certainly good news in the summer, but when he came out with an improved shot and stronger offensive game in the non-conference, KU was playing its best ball. Kevin cleared his PPGAB estimate by over 2 points and his Per100AB estimate by over 3 points. And even though he got injured and missed 8 ½ games, his WAR was over a win above expected.

McCullar had the highest PPGAB and Per100AB marks of any Jayhawk this season, and his WAR was third on the team but closely behind two players with 248 and 173 more minutes of game action. McCullar’s injury prevented him from adding to his legacy, as his efficiency waned during the part of the season he was trying to play through the pain.

Overall, Kevin’s jump in performance was a pleasant surprise in a season with few of them, and makes his injury and even more frustrating. When he was out there, he was an 85.1%ile Jayhawk, which is right on par with Ben McLemore’s lone season (2013).

K.J. Adams

Traditional Stat-Line: 12.6 PPG, 3.1 APG, 4.6 RPG, 1.1 SPG, 0.6 BPG on 33.5 MPG, 60.1%/0.0%/60.0%.

Pre-season Value Projection: +0.93 PPGAB, +1.90 Per100AB, +2.33 WAR

Actual Value Score: +2.88 PPGAB, +4.98 Per100AB, +4.42 WAR

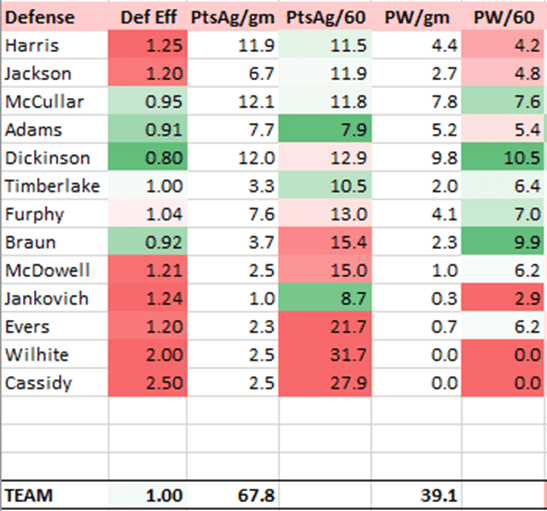
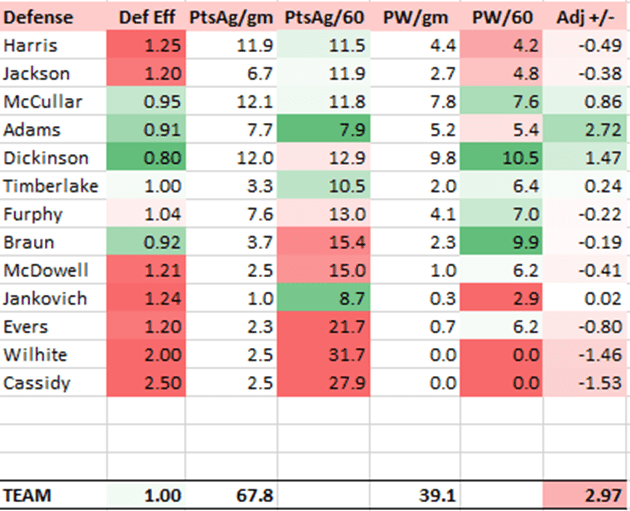
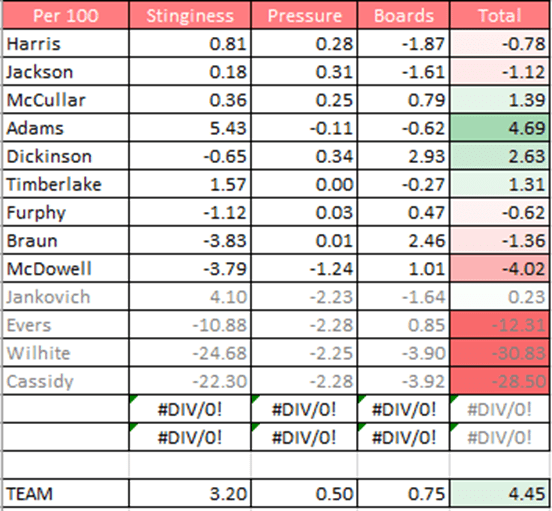
Alongside McCullar, K.J. Adams was KU’s most-improved player. He overachieved his PPGAB and Per100AB expected scores by 2 and 3 points respectively, and added 2 WAR above his projection. Adams’s offensive value was right where we thought it would be, it was his defense that made a huge leap. Adams was KU’s best defender, allowing 0.145 points per possession (or 8.7 points per 60 possessions). His strength, quickness, and ability to switch to both guards and posts helped KU put together a mostly acceptable defense for much of the season. Adams was also healthy and consistent, something no other Jayhawk from 2024 can really say. He was the team-MVP in 11 of KU’s 34 games, which led the team this year.

Another polarizing player, we will focus on 2025 and his role at a later date. But KU was barely a tournament team without Adams (even if McCullar/Dickinson were healthy all season). Unfortunately, he had his worst game of the season against Gonzaga, especially on the defensive end. For the season, he had a Per100AB at the 75.2%ile, which is very similar to the per possession value Julian Wright gave as a freshman (2006). And K.J. did this playing far more minutes and less rest. Adams’ value was very under-appreciated.

Hunter Dickinson

Traditional Stat-Line: 17.9 PPG, 2.3 APG, 10.9 RPG, 0.9 SPG, 1.4 BPG on 32.2 MPG, 54.8%/35.4%/62.4%.

Pre-season Value Projection: +5.18 PPGAB, +9.25 Per100AB, +6.88 WAR

Actual Value Score: +3.45 PPGAB, +6.19 Per100AB, +4.77 WAR

Hunter Dickinson had a good season, producing the second-highest PPGAB and Per100AB scores on the team and the highest WAR. Let’s start with that fact, so that the rest of the discussion will be in its proper context. Within this context, Dickinson very-much underachieved his projected totals, and his play worsened as the season progressed (even before his shoulder injury).

Hunt was a +5.40 PPGAB player through the home Houston game, when KU looked like it had turned a corner and was poised to have a strong February run building into March. After that game, beginning with the road K-State contest, Hunt was a -0.45 per game player. This was seen on both ends of the floor, but especially on defense. Over these last 11 games he played (he missed the Cincinnati game in Kansas City), Dickinson was a -2.41 per game defender. His shooting, particularly behind the 3-point and free-throw lines, got worse and hurt his overall offensive game. Even during his slumps, his offense was good enough to be value-adding.

On the season, Dickinson had 9 team-MVP games and had the best performance overall in his dominance of Tennessee’s big men during the third-place game at the Maui Invitational. But that seems like months ago because it was. He saw the likes of Samford take advantage of his propensity to over-hedge ball screens and recover slowly. Teams kept hurt the Jayhawks on this play, to the point that March Madness analyst Brendan Haywood pointed out that KU should think about dropping him into the lane to cover ball-screens this way. We would agree.

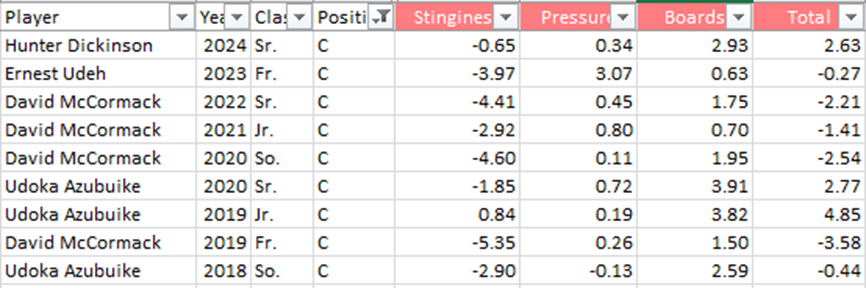
Dickinson was in many ways the anti-Harris. He started the season great but limped to the finish, unlike Harris who came around during the late push. But we don’t want to ignore Hunter’s 82.5%ile mark, second on the team and comparable to Nick Collison as a sophomore (2001). From a WAR perspective, Hunt’s season compared to the seasons of other big-men such as Perry Ellis as a junior (2015) or Jeff Withey either his junior or senior seasons (2012 or 2013). These are solid players, and show that Hunt added quite a bit of value.

Nicolas Timberlake

Traditional Stat-Line: 5.2 PPG, 0.6 APG, 1.9 RPG, 0.5 SPG, 0.1 BPG on 15.4 MPG, 38.3%/30.3%/78.6%.

Pre-season Value Projection: +0.32 PPGAB, +0.75 Per100AB, +1.50 WAR

Actual Value Score: -0.93 PPGAB, -3.50 Per100AB, -0.18 WAR

Timberlake had a rough season, producing 4 points worse Per100AB than expected. His poor play, particularly to start the season, also lowered his minutes volume…not something this KU team needed given its depth issues. And by the time Nick started to play better, KU had injuries to key pieces. We really never saw him filling his role when KU was at its best, although there were glimpses such as his senior-night performance vs. K-State.

In the non-conference, Timberlake played at a -1.78 PPGAB. Starting January 1, which was the beginning of conference play on through the NCAA Tournament, his performance was at -0.41 per game. This improvement was more pronounced on the defensive end, where he would grade out as a +0.27 per game player. He was able to move his feet okay, grabbed enough rebounds, and otherwise was a healthy and energetic player.

But his offense, unfortunately, never really clicked. He was officially credited with 22 assists on the season, which, as a 2-guard, is really terrible. We had him with 17 value-assists, which even if you doubled his minutes, would come to about 1 per game on 30 minutes. His shot didn’t consistently fall, which really hurt the value he provided to the team.

Timberlake was at the 14.0%ile of all Jayhawk rotation players since 1993. A close comp here would be 2010 Brady Morningstar or 2023 Joseph Yesufu. Given that Timberlake was meant to be a step-up from Yesufu, this was a major disappointment.

Positive moments Nick will be remembered for are his athletic dunks as well as drawing a late foul against Samford and knocking down 2 FT’s to put KU up 3 in the final seconds.

Johnny Furphy

Traditional Stat-Line: 9.0 PPG, 1.0 APG, 4.9 RPG, 0.9 SPG, 0.8 BPG on 24.1 MPG, 46.6%/35.2%/76.5%.

Pre-season Value Projection: -0.84 PPGAB, -6.30 Per100AB, -0.49 WAR

Actual Value Score: -0.23 PPGAB, -0.54 Per100AB, +0.90 WAR

Furphy was KU’s latest roster move, he joined the team so late he didn’t even play in Puerto Rico in August, and he wound up being the only newcomer to meet expectations. His were low, given limited information about him from recruiting services and the unknown about foreign players. Compared to Svi Mykhailiuk, Furphy had a much stronger season as a frosh than Svi did. After cementing his role as KU’s fifth starter (when the team was fully healthy), Furphy worked his way into an above-bubble player for the Jayhawks during the middle of conference play. He had some rough moments down the stretch of the season to finish below-bubble, but he was comfortably above D-1 average and therefore produced nearly 1 full win above replacement.

Furphy was at the 32.1%ile of Jayhawk players who crack the rotation, which was very close to Wayne Selden’s freshman season (2014). A career trajectory like Selden’s would be excellent news for Kansas. We shall see what happens with Johnny, a skilled scorer with clear pro potential.

Johnny’s offense ended up worse than his defense, which seems strange. Furphy’s defense wasn’t great, but he did add value by rebounding and just competing. His inability to break down defenses or generate points for others (only 28 value-assists on the season) took away from his solid shooting numbers.

Parker Braun

Traditional Stat-Line: 2.2 PPG, 0.3 APG, 1.6 RPG, 0.2 SPG, 0.6 BPG on 7.5 MPG, 66.7%/36.4%/66.7%.

Pre-season Value Projection: -0.39 PPGAB, -2.75 Per100AB, 0.00 WAR

Actual Value Score: -0.70 PPGAB, -5.44 Per100AB, -0.33 WAR

Parker was projected to be a replacement player, or average D1 guy coming in as a backup to Hunter Dickinson. The fact he didn’t get there is important, although he was never the guy who was going to make or break the season for Kansas. Parker knew his role, but his defense was never where it needed to be. He did shoot a high percentage, mostly on lob-dunks and layup attempts, but his lack of production hurt the team whenever he played.

Braun’s play registered at the 6.9%ile of all Kansas Jayhawk rotation players since ’93. He was about as good, per possession, as sophomore Mitch Lightfoot (2018), who played a similar role for a Final Four team when he backed up Doke. Braun played 18.6% of available minutes, close to the 20.1% that was projected for him.

Jamari McDowell

Traditional Stat-Line: 1.8 PPG, 0.5 APG, 1.2 RPG, 0.2 SPG, 0.1 BPG on 7.2 MPG, 30.8%/28.1%/84.2%.

Pre-season Value Projection: -0.72 PPGAB, -6.02 Per100AB, -0.40 WAR

Actual Value Score: -0.75 PPGAB, -6.01 Per100AB, -0.35 WAR

Jamari’s projection was the most accurate. We even nailed his minutes (he played 16.4%; projection was 17.1%). As a true freshman toward the lower-end of the Top 100, Jamari was never expected to be a huge contributor. With only 9 scholarship players, he filled a role as a back-up wing who was there to play defense first. McDowell’s play was at the 5.5%ile of all rotation players in KU history since ’93. He was about the same as Tristan Enaruna as a freshman (2020). Given how much better Enaruna has gotten (albeit at a low-major), there’s no reason to think McDowell can’t become a KU-level player as an upper-classman.

TEAM

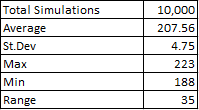
We projected KU to be a +8.51 team, meaning they would beat their opponents by 8.51 more points per game than a bubble-team would be expected to. This projection, independently arrived at, was quite close to how KenPom and Bart Torvik saw them. This number ended up being +3.62 by season’s end. This ended up being the worst team in the Self-era as well as the worst team since 1993 (1989 was likely the last Kansas team to be this bad from a computer-rankings/efficiency perspective).

In October we looked at different scenarios as to how the season could play out. A median case, worst case, and best case scenario. Look at what we wrote about what could happen if KU had a worst case type of season.

In this scenario, one of its key players struggles with an injury and this weakens an already depleted roster. KU’s offense could also struggle as teams force McCullar and Adams to make jump-shots while forcing the ball out of Dickinson’s hands. On defense, while it’s difficult to see KU being bad on this end, teams could put Dickinson in high-ball pick-n-rolls and take advantage of Self’s propensity to switch screens.

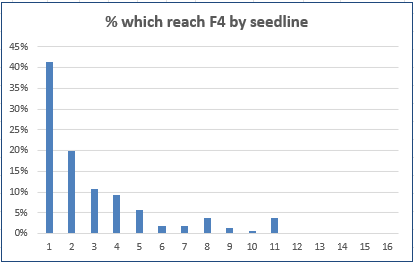
If KU were to struggle enough, it could lose games it was projected to win preseason and find itself slipping down into the 5-6 seed range. In this range, a First Round upset loss is more likely and a second-weekend in the NCAA’s less likely. For KU’s worst case scenario to be a comfortable NCAA Tournament team is something most teams can’t say a few weeks before the season starts.

This is basically what happened. McCullar’s injury proved to be too much. Jump-shots stopped falling, and Hunter had more difficulty avoiding double-teams. KU’s defense faltered when Hunt was put in high-ball pick-n-rolls. Kansas did get a 4-seed, making it slightly better than it could have been, but didn’t make the second-weekend. However, its tough to see the season playing out worse under any reasonable situation. KU’s floor is so high, that it makes rebuilding easier. We won’t look ahead until later posts, but there isn’t any reason to panic about the state of the program right now.

That about puts a bow on the 2024 season. Thank you and Rock Chalk.

Understanding the NCAA Tournament Committee

Note: This was written immediately following Selection Sunday 2024. If we can analyze what the committee values on Selection Sunday, it can help us understand what teams can do to make sure they have the best shot to get the seed they deserve.

Every year there is chaos, controversy, and confusion on Selection Sunday. 2024 is no different. Iowa State sits at #8 on the S-curve despite running through the Big 12 Tournament. Auburn, the SEC champ and advanced-metrics darling, got a 4-seed no one wants to face. At the same time, 14-loss Michigan State was comfortably in the field (9-seed) and bubble-team Texas A&M (also a 9-seed) comfortably avoided Dayton despite having 4 Q3/Q4 losses on the season.

What is going on? Is the committee schizo? Well, sort of. But it isn’t really their fault.

The NCAA Tournament committee’s job is to select and seed the best 68 teams for the bracket. To help it, it has certain principles as a guide. There are 32 automatic qualifiers and 36 at-large teams. So, they really only pick 36 teams. After the 36 are selected, they rank all 68. This two-part process is messy to a degree, as the AQ’s and at-larges mix until about the 12-seed or so (most years), after which the worst teams are always AQ’s.

For 2024, Championship Week saw numerous upsets and bid thieves, so the last four teams into the tournament (who make the play-in round in Dayton) were on the 10-line, which is the first time this has happened since the field when to 68. Before it has always been 11’s, 12’s, or even 13’s to make the First Four as at-large teams.

In order to help the committee decide who should be in the field, team sheets are used showing relevant information. This is what Houston’s looked like:

That’s quite a display of number and color. And this is just one team’s team sheet. Imagine going through nearly 100 of these, repeatedly, for hours if not days!

While we aren’t privy to the conversations of the committee, we do have the advantage of people doing bracket exercises which help us understand what the committee values. Believe it or not, bracketologists have some value to give us! Additionally, the committee chair normally hints or gives brief explanations regarding the committee’s decision after the release of the bracket. So we can make certain assumptions and guesses ourselves as we seek to understand the committee.

The Task at Hand

The exercise we’re engaging in is to attempt to quantify the committee’s preferences in terms of the information they have access to. For instance, what’s most important to the committee? Overall record? Quad 1 wins? Computer metrics? Strength of schedule?

There are a few types of criticism the committee sees. The first is that it fails to rank the teams as they truly are. This is a very difficult thing to assess, without first assuming some other metric which to judge the committee against. Instead, we want to study the consistency of the list. Based on the committee’s preferences; what numbers, metrics, etc. on the team sheets is it valuing?

To even get started, we have to identify what relevant numbers are even being evaluated, something we do using common knowledge of the sport of college basketball and clues from bracketologists and the committee chair. We’ve come up with 6 different categories:

  • Strength of Schedule
  • Overall Record
  • Performance Against the Best – Quad 1
  • Performance Against Good Teams – Quads 1 & 2
  • Avoiding Bad Losses – Quads 3 & 4
  • Advanced Metrics

Results

More detail will be provided later on how these are determined. But what we did was quantify these 6 categories by ranking teams in each, then weight each category based on its relative importance to come up with a weighted average score. We then ranked the field on this weighted average score and compared it to the committee’s own S-curve. We want the tightest correlation, so we played around with the weights of these 6 categories until we arrived at an R2 of 0.8793. The weights were as follows:

  • Strength of Schedule (6.5%)
  • Overall Record (0.0%)
  • Performance Against the Best – Quad 1 (25.5%)
  • Performance Against Good Teams – Quads 1 & 2 (9.5%)
  • Avoiding Bad Losses – Quads 3 & 4 (Multiple)
  • Advanced Metrics (58.5%)

There are some noteworthy things here. One, the raw winning percentage wasn’t factored in by the committee. This is to its favor. A team’s overall record shouldn’t matter per se, as the relevant numbers should be seen in other areas of the team sheets.

The next thing to note is that bad losses were calculated using a multiple. If a team has 0 bad losses, its overall weighted average goes down (improving its ranking). The more bad losses a team has, this affects its weighted average (worsening its ranking). Better to have 1 bad loss than 2, 2 bad losses than 3, and so on.

Finally, the advanced metrics accounted for a large proportion of what the committee valued. This isn’t necessarily terrible, as these advanced metrics taken into account what the committee looks for (i.e. good wins increase a team’s SOR, NET and KenPom ranking). But it is interesting, based on how closely the Quadrants are discussed, that just averaging a team’s computer metric component got you most of the way there.

Biggest Outliers – A Discussion of Certain Teams

Given how the committee viewed the importance of each item on the team sheet, let’s look at which teams were furthest from their final place on the S-curve. These outliers should generate the most controversy, because they are where the committee veered off most from their implied preferences.

Florida Atlantic

The Owls were the committee’s #31 overall team (earning an 8-seed), whereas the weighted ranking had them as the #46 team—just outside the at-large field. FAU’s resume was unique in that it had 3 Q3/Q4 losses. While the weighted ranking did indicate that the committee accounted for bad losses for most teams, it seemed to not do this for FAU. Though perhaps the weighted ranking over-penalized bad losses. Either way, FAU’s metrics were solid enough (all in the 30’s and low-40’s) and it played a solid schedule. But #31 is too high.

Colorado

The Buffaloes were the committee’s #39 overall team (earning a 10-seed and First Four game), 13 worse than their #26 weighted ranking. The Buffs could arguably be a 7-seed given their resume and what the committee valued most of the time. Colorado’s worst feature was its Non-Con SOS. Like Iowa State, this may have hurt it.

Boise State

The Broncos were the committee’s #38 overall team (and will face CU Wednesday night), but would have been #28 had the weighted ranking been used. Boise had good metrics across the board; nothing really stood out as being worthy of dropping them to the play-in game.

Kentucky

The Wildcats were “only” 8 spots off—the committee has them #11 while the weighted ranking has them #19—but since it is tougher to miss by many spots toward the top of the bracket, this was noteworthy. UK’s computer metric numbers were all between 18-21. It went 8-8 in Q’s 1&2. Whatever resume numbers you looked at in isolation; it was tough to place Kentucky as a 3-seed or top 12 team in any single of them. Yet they were given a 3-seed above teams such as Auburn or Duke or Kansas.

Others

These others, which were 8 spots off, will be listed in terms of boosted or screwed by the committee. Nevada was screwed. South Carolina was boosted. Colorado State was screwed, and is also a play-in team. Drake was boosted. Northwestern was also boosted.

Bubbles

Some bubbles have already been mentioned. The teams that were the most screwed out of making the tournament, given the committee’s implied preferences, were Oklahoma, Providence, and St. John’s. Virginia was boosted enough to get it in when it should have been out, but the boost wasn’t egregious. They were close given the committee’s preferences. FAU, as mentioned, would have been (barely) out. The other team that would have been out, if weighted average were used, was Northwestern.

What About…

Iowa State was actually only off by 1 spot given the committee’s implied preferences. With its computer metrics averaging over 5, ISU’s case for a 1-seed was always going to be dicey. But what hurt it most was undeniably its SOS score. Despite having the #16 NET SOS overall, its rank in this category was 63, far below the likes of UNC and Tennessee. What stuck out and pulled down ISU’s SOS was its #324 non-con SOS. One can argue that non-con SOS shouldn’t be considered (if we have overall SOS, what’s the point of looking at one portion of the schedule), but the committee sees that number and no doubt uses it in their considerations.

Michigan State, at 19-14, was thought to be gifted a Tourney bid. But the Spartans are actually only one spot off their implied rank given the committee’s preferences across the field. In other words, the same things the committee valued in seeding the rest of the field was applied to MSU. Michigan State had a great schedule overall (8th best according to this exercise) as well as solid computer metrics (being #18 in KenPom and BPI doesn’t hurt a team). This did enough to pull it up to an at-large berth without much sweat. Again, one can criticize what the committee values, but one can’t say it was being inconsistent by including Tom Izzo’s team in the 2024 Tournament.

Texas A&M had four bad losses but was the #34 team according to the S-curve. A&M earned a 9-seed, but maybe deserved a 10 given the committee’s preferences overall. Still, this team was getting in. It went 13-10 in Q’s 1/2 and had solid enough computer metrics.

And Finally… Not being talked about much is the fact Purdue dropped to the #3 overall seed, when many had it as the #1 overall for most of February and into March. The Boilermakers were the #1 overall ranked team according to the weighted rank, thanks to having the best SOS metrics in the nation and performance metrics right there with UConn and Houston. But the committee went with the Huskies and Cougars. Not that this matters much. The #1 overall seed hasn’t won March Madness since 2013, while 1-seeds from the other spots in the bracket have had success.

More Detail, How the Weighted Average Score was Calculated

All data was taken from what the committee had on Selection Sunday. The “Nitty-Gritty” info includes each team’s NET, Avg Opp NET Rank, Avg Opp NET, W-L record, Conf. Record, Non-Con Record, Road W-L, NET SOS, Non-Con SOS, and then results by Quads 1, 2, 3 & 4.

Additional data we needed to pull was each team’s computer metric scores (KPI, SOR, BPI, KenPom). All of these fields became the basis from which we ranked the field using the weighted average. As these categories are what the committee sees, we assumed these categories are what the committee uses to make its judgments.

The next step was the trickiest. How do we apply each of these data-points into sensible categories? After all, some of the information on the team sheets is redundant. After some thought, we came up with the six categories which were presented earlier. In more detail, here are these categories again.

Strength of Schedule

SOS ended up making up 6.5% of the weight. It wasn’t overly important, but it did affect teams like Iowa State. While overall SOS is included, the committee also saw SOS from a few other perspectives, including non-conference SOS. We calculated each team’s SOS sub-categories using percentiles, then found an average percentile, then ranked teams on that percentile. Purdue was #1, Kansas was #6, and Iowa State was #63. Of anyone in consideration for a 1-seed, ISU’s SOS was certainly the biggest outlier.

Overall Record

This is an appealing number, because it is prima facia easy to compare. A 23-9 record looks better than a 19-13 record. However, given SOS differences, this isn’t necessarily the case. To the committee’s credit, it didn’t utilize overall record at all according to the weighted average. This category was 0.0% weight.

Performance Against the Best – Quad 1

There’s no doubt the committee considers Quad 1 games in isolation, which was the gist of this category. They want to know how you did against the top teams in the nation. We looked at both overall wins in this quadrant as well as each team’s winning percentage in Q1 games. Weighting about 2 to 1 to overall wins (i.e. 11-5 is preferable to 8-3), we generated percentiles and rankings for this category. In total, 25.5% of the weight was put here.

Performance Against Good Teams – Quads 1 & 2

We didn’t think the committee looked at each Quad below Q1 in isolation per se, but because some teams don’t play a ton of Quad 1 games and once you get down the bracket not many teams have great Quad 1 winning percentages, we wanted to look to see how much the committee looked a teams’ records against “good opponents” broadly-defined. We had two sub-categories here, total wins from Quads 1&2 as well as the total net wins in these Quads (i.e. going 8-11 in Quads 1&2 mean a -3 net). Balancing these, we see that indeed the committee factored Q1&2 games into its ranking. In total, 9.5% of the weight was put in this category.

Avoiding Bad Losses

Quad 3/Quad 4 losses are seen as discounting a team’s ranking. But this wasn’t done by using weights as with the other categories. A team with 0 bad losses was given a multiple less than 1 (improving its weighted average score). From here, teams with 1 or 2 or 3 or more losses were given a multiple of increasing value (all over 1) which would increase their weighted averages and make them worse in the overall list.

Advanced Metrics

There are five computer ranking systems printed on the team sheets. NET, the NCAA’s performance evaluation tool; KPI, from Kevin Pauga; ESPN’s SOR, a resume-based metric; ESPN’s BPI, an efficiency-based metric; and KenPom, also an efficiency-based metric. The assumption, like with the other categories, was that these were employed by the committee as they were numbers the committee was seeing for each team. What’s clear is that the advanced metrics are being heavily used, and each is being used to some degree. In total, a whopping 58.5% of the weight was put here.

Calculating the Weighted Average

Teams are ranked in each category. From here, weights are applied in each category. Additionally, the bad loss multiple is applied to reward teams with no bad losses and punish teams with bad losses based on the number/severity of the bad losses. We then compare the weighted average ranking to the committee’s actual S-curve, and see how strongly the two lists align.

Using a simple correlation, we attempt to get the R2 as close to 1 as possible. For instance, if we applied 20% weight to each of the 5 categories (aside from the bad loss category, which is a multiple not a weight), we get a solid-enough R2 of 0.8265. After playing around with the weights, the highest R2 we got to was 0.8793 for the weights listed above. While not a perfect system, this is the best we could do without better coding skills.

In Closing

The committee’s preferred preferences matched the S-curve with a 0.8793 correlation. Is this good? Is it bad? Tough to say unless we compare it to other seasons. It clearly had some head-scratching calls, but also fit most teams close enough to what made sense. If we do this for other seasons, we can compare committees from different years to see which was the most and least consistent to its own preferences.

The flip-side is to analyze this from the perspective of teams looking to put themselves in the best possible place on Selection Sunday.

The best things for teams to do is to win games against good teams by as many points as possible. This will help your efficiency and resume metrics, which is what correlates most to the committee’s ultimate seed list (S-curve). Additionally, winning Quad 1 and 2 games (while avoiding bad losses) has a huge impact, and for a related reason. If you in Quad 1 and 2 games you are also improving your computer scores and if you are improving your computer scores it is likely due in part to you winning Quad 1 and 2 games.

What doesn’t help teams is to win “fluff” games. These do improve your overall record, but the committee admirably didn’t show any partiality for a team’s overall record. Sure, teams with great records tend to get great seeds. But this was due to these teams beating good (Q1 & Q2) teams, not just any team.

The last thing that affected a team’s S-curve spot was its SOS metrics. Remember that there are multiple SOS metrics the committee sees, including non-conference SOS. Having poor SOS marks had negative effects on teams’ S-curve ranks.

In wrapping this up, obviously a team wants to beat the best during the regular season so that it gets a top seed in the NCAA Tournament. But that’s easier said than done. Additionally, conference schedules are out of the control of the program, so teams have to do best with who they face in January and February. What coaches can do, on the other hand, is schedule difficult in the non-conference. The three reasons are straightforward: It doesn’t help to beat bad teams. It can only hurt if you lose to a bad team you schedule. A weak non-con SOS will be dinged by the committee. This is the lesson for Iowa State (and perhaps Texas Tech, Colorado, and Nevada).

Beware the Slides of March

Kansas has finished its pre-NCAA’s schedule, and now sits at 22-10 overall following a 13-1 start to the season. The Jayhawks are on a slide, performing as a -3.05 per game team in March (4 games) and below bubble-level (-0.43) over their last 10 games, in which they have a 4-6 record. This series of poor play can be assigned solely to the offensive end, where KU is performing as a -5.19 per game team over the last 10 contests. The struggles to score have coincided with injuries to 2 key players, first Kevin McCullar (who has missed 5 1/2 games over this period) and lately to Hunter Dickinson, who was in street clothes for KU’s 20-point loss in the Big 12 Tournament. Relatedly, KU’s poor shooting has plagued the team over this stretch. In the last 10 games, KU is shooting 24.2% from 3-point range, despite being selective on its outside attempts. There’s no denying it. Kansas is slumping.

Compared to their seasons overall, there are a few players who have not performed well in recent weeks, contributing to this decline in team strength. Hunter Dickinson, who has been a +0.19 per game player in recent weeks, has a +3.90 per game season value. Johnny Furphy (-1.86 recent, -0.38 season) and Kevin McCullar (+0.63 recent, +4.01 season) are the other two who have seen a sharp decline in their games. McCullar has the excuse of being injured during this period; certainly not 100% in the games he’s been able to play.

Of the others, its not like they’ve picked up their play in the absence of Kevin and Hunter. Back-ups like Jamari McDowell, Parker Braun, Nicolas Timberlake, and certainly Elmarko Jackson have struggled all season (aside from 1-off games here-and-there). K.J. Adams, for his part, hasn’t seen a dip in his solid play in recent games (he’s been steady all season). Only Dajuan Harris has turned up his game in recent weeks (+3.05 recent, -0.20 season), but this has primarily been due to his play on the defensive end, something less noticeable and more variable. We shouldn’t overlook Juan’s good defense by any means, but his offense over the last 10 contests is only slightly above-bubble (+0.30 per game).

What is the solution to this dilemma? It’s tough to say. But one thing is that KU needs its full roster available. Even despite the relatively poor play of Kevin and Hunter recently, having them healthy enough to provide 32+ minutes is crucial for the team, as their “D” games are way better than whatever the back-ups normally provide. More minutes from Jackson, Timberlake, and McDowell do not make the team better. Role player, such as Dajuan Harris and Johnny Furphy, likewise add more value when surrounded by stars like McCullar and Dickinson. Harris needs skilled scorers to find in good spots in order to generate assist-value. Furphy needs space to make 3’s or cutting lanes, something both Kevin and Hunter can provide by their ability to draw extra defensive attention and double-teams.

There’s been much discussion about injuries and poor shooting, and note that both have been the source of KU’s woes and both are related. KU’s been worse from 3 in games without Kevin (21.3%) than in games with him (27.2%) over the last 10, not to mention how much better of a shooting team they were when Kevin was 100%. In all games McCullar has missed (6 total), KU is a -0.44 team (+5.68 with him). Further, when KU doesn’t have a 7’2 skilled post scorer they can feed as part of their half-court offense, this hurts their FG shooting from inside the arc as well. If KU gets its two best players healthy by the NCAA Tournament, this will give its role players a better chance of making shots.

In closing, KU’s best team consists of its “main four” (McCullar, Dickinson, Adams, Harris) alongside whoever is playing best of the others. It may not always look pretty, but this line-up is most effective this season. If Furphy is hitting shots, he’s a great asset to the other four. But others have provided a spark as well, and as long as their roles are limited, the damage they will do to the team is not likely to be insurmountable. Still, KU will need consistent positive-value performances from its main four to make a deep run in the Big Dance. Benching K.J. this season because of “spacing” is a very dumb idea, and is probably only broached by the types of people who never played organized basketball past the third grade.

A Look Through the Bracket in the 64-Team Era

Through the 2025 NCAA Tournament, this post examines all 40 seasons of the 64-team bracket (which began in 1985)1, specifically focusing on how seed-lines have performed in comparison to each other. Yes, the bracket has technically expanded to 68 teams, but effectively it is still a 64-team format. It’s just that there are four extra, play-in games (two between the four worst automatics, two between the four worst at-large teams) to determine the final 64 teams.

Round of 64 Results

40 tournaments, with 4 regionals in each tournament, mean there are 160 total seeds in this time. 160 1-seeds (Kansas has 16 of these2), 160 2-seeds, etc. It also means that there have been 160 First Round games featuring seeds which add up to 17 (1 v. 16, 2 v. 15, etc.). Here’s how these match-ups have turned out over the past 40 tournaments.

The 1-seeds average 84.23 points and allow 59.70, for an average difference of 24.53 points. They have gone 158-2 overall, winning 99% of games against the 16-seeds. From here, we see a drop-off for the favorite as the seeds converge until we get to the 8/9 match-up which is virtually even.

There appears to be a steady drop-off in success by favored seed until you get to the 5-seed, which doesn’t even win 2/3 of its games against the 12. The next chart compares each Round of 64 favored seed to the next seed down and produces a multiple. For instance, how much more likely is it that a 1-seed wins than a 2-seed? Or rather, how much more likely is it that a 2-seed gets upset than a 1-seed?

This shows that the biggest drop-off in terms of avoiding a First Round upset is from the 1-line to the 2-line. 1-seeds are 5.83x more likely to make it to the Second Round than 2-seeds. After that, there are smaller differences when you step down a seed-line. Because these are multiples, one can multiply down the line to compare seeds that aren’t next to each other. For instance, in order to find out how much more likely a 12/5 upset is than a 15/2, simply times 2.27 by 1.55 by 2.19. This gets 7.70. In other words, a 2-seed is over 7 times more successful at winning in the Round of 64 than a 5-seed is.

KU Focus R64

KU has earned 16 1-seeds, 7 2-seeds, 5 3-seeds, 6 4-seeds, 1 5-seed, 2 6-seeds, 1 7-seed, and 1 8-seed in the modern tournament era. This accounts for 39 out of 40 years, as the Jayhawks didn’t make the 1989 NCAA Tournament. In that time, KU has won 36 games (36-3). It’s projected record, given its seeds, is actually 34.3-4.7. So, KU has overachieved in this round. People may remember Bucknell and Bradley, but in terms of big upsets, that’s all there’s been. Don’t take for granted how good KU has been in avoiding opening round disappointments.

Round of 32 Results

The Second Round features games that can only be between these pods of seed-lines:

  • 1/16 v. 8/9
  • 4/13 v. 5/12
  • 3/14 v. 6/11
  • 2/15 v. 7/10

Of these possible matchups, only the 16 v. 8 game has never occurred. In the only two times the 16-seed defeated the 1, the 9-seed won its matchup against the 8. The winning percentage by seed-line in this round is as follows:

  • 1-seed: 86%
  • 2-seed: 68%
  • 3-seed: 61%
  • 4-seed: 61%
  • 5-seed: 54%
  • 6-seed: 48%
  • 7-seed: 30%
  • 8-seed: 21%
  • 9-seed: 10%
  • 10-seed: 40%
  • 11-seed: 43%
  • 12-seed: 38%
  • 13-seed: 18%
  • 14-seed: 9%
  • 15-seed: 36%
  • 16-seed: 0%

This trend begins reasonably enough, with the 1-seed being more successful than the 2-seed and so on. But once we get to the 10-seed, the winning percentage spikes back up. Even the 15-seed has won 36% of its Round of 32 games. Sure, it doesn’t get there that often, but it is 4-7 in this round (while the 9-seed is 8-75).

This is where the structure of the bracket has an effect on how seeds perform. 8’s and 9’s are generally better teams than the double-digit seeds below them, but have a tougher opponent as they face the 1-seed 99% of the time in this round. This causes the 8/9 winner to lose its Second Round game at such a high rate.

One way to look at the Round of 32 is to see which teams get through this round by grouping. We will look at each pod of teams and hope to gain some clarity.

1/16/8/9

  • 1-seed: 136 (85%)
  • 16-seed: 0 (0%)
  • 8-seed: 16 (10%)
  • 9-seed: 8 (5%)

4/13/5/12

  • 4-seed: 77 (48%)
  • 13-seed: 6 (4%)
  • 5-seed: 55 (34%)
  • 12-seed: 22 (14%)

3/14/6/11

  • 3-seed: 84 (53%)
  • 14-seed: 2 (1%)
  • 6-seed: 47 (29%)
  • 11-seed: 27 (17%)

2/15/7/10

  • 2-seed: 102 (64%)
  • 15-seed: 4 (3%)
  • 7-seed: 29 (18%)
  • 10-seed: 25 (16%)

Looking at all these pie-charts next to each other, we can see how much more likely it is for the 1-seed to win than for any other of the better seeds in these First Weekend pods. In terms of getting to the Second Weekend, it better for a team to be a 10 or 11-seed rather than an 8 or 9-seed.

KU Focus R32

This round has infamously been a difficult round for Kansas. In the Self-era, KU is 11-7 in the Round of 32 and 1-4 since 2019. Since 1985, KU is 23-13 in this round, and has failed to make this round 3 other times (2 R64 losses, 1 NCAAT miss). Given KU’s seeds, we’d expect KU to have been to 24.8 Sweet 16’s, indicating that KU is underperforming its seed-line through the First Weekend. Since we know that KU outperformed its First Round record by 1.7 games, we come to the calculation that KU has underperformed in the Round of 32 by 3.5 games. In other words, KU’s 23-13 record should be something like 26-10. Specifically, its multiple losses as a 1-seed (’92, ’98, ’10, ’23) and a 2-seed (’90, ’14, ’15) in this round have been major disappointments and contributed to the gross underperformance.

Sweet 16 Results

The Sweet 16 games begin the Second Weekend, with the bracket starting to winnow down as we approach the Final Four. It is when games tend to get tougher for 1-seeds (who will likely face a 4/5), and where a variety of potential match-ups can occur. The 2 vs. 3 matchup is the second-most-common (behind 1 vs. 4), but it has only happened 31.9% of the time in 160 regionals since 19853.

In order to best understand this round, we’ll consider which seeds make the Elite 8 what percent of time.

  • 1-seed: 67%
  • 2-seed: 45%
  • 3-seed: 26%
  • 4-seed: 16%
  • 5-seed: 8%
  • 6-seed: 11%
  • 7-seed: 6%
  • 8-seed: 6%
  • 9-seed: 3%
  • 10-seed: 6%
  • 11-seed: 6%
  • 12-seed: 1%
  • 13-seed: 0%
  • 14-seed: 0%
  • 15-seed: 1%
  • 16-seed: 0%

Somewhat illuminating is the fact that only the 1-seed is more likely than not to make it past the Sweet 16. And while the 2-seed is close to a 50% chance, this number drops to 1-in-4 for the 3-seed. Of the 640 seeds between 13-16 since 1985, only 1 has made the Elite 8 (2022 Saint Peter’s).

Let’s look at this Sweet 16 match-up from the perspective of the 1’s and 2-seeds. In other words, if a 1-seed makes this round, which seeds are they likely to face?

  • 4-seed: 46%
  • 5-seed: 37%
  • 12-seed: 15%
  • 13-seed: 3%

A full 82% of the time the 1-seed gets to the Sweet 16 it will face a 4 or 5-seed. For the 2-seed, here are its opponents by likelihood.

  • 3-seed: 50%
  • 6-seed: 31%
  • 11-seed: 19%
  • 14-seed: 0%

Similarly, 81% of the time it makes it through to the Sweet 16, a 2-seed faces off against a 3 or 6-seed. Only rarely will it get a double-digit seed in the Sweet 16.

KU Focus S16

KU is 16-7 in this round, which is better than its record in the Round of 32. For Bill Self at Kansas, his teams have a 9-2 record, further cementing the idea that he excels in the tournament games he has more time to prepare for. KU has won its last four in a row playing in this round. Only 2 of these wins were when KU was a 4-seed or worse (1988, 2004), and only once has KU won in this round as a seed-line underdog (1991). One of KU’s most devastating losses happened in this round as well (1997). Overall since ‘85, KU has outperformed seed-expectation by 1.3 games in Sweet 16 contests.

Elite 8 Results

There have been 160 Elite 8 games since 1985. The Elite 8 is the last round to ensure that no two teams of the same seed-line face each other. 107 of these games include a 1-seed, which is the most-likely seed (by far) to make this round. The 2-seed is also frequently at this game, having been there 72 times since 1985.

However, the 1 v. 2 match-up has only happened 51 times, or 31.9% of the time. There have been years when it didn’t occur at all (such as 2022 and 2023). Other oddities of this round include the fact the only 15-seed to make the Elite 8 faced not a 1, 4, or 5-seed but an 8-seed. Since the 14-seed has never made this round, the 1-seed has never faced it either. Here are a list of seeds that each seed-line hasn’t faced in this round that are possible (italics indicate seed has never made E8):

  • 1-seed (14-seed, 15-seed)
  • 2-seed (13-seed, 16-seed)
  • 3-seed (12-seed, 13-seed, 16-seed)
  • 4-seed (14-seed, 15-seed)
  • 5-seed (7-seed, 11-seed, 14-seed, 15-seed)
  • 6-seed (9-seed, 12-seed, 13-seed, 16-seed)
  • 7-seed (5-seed, 9-seed, 12-seed, 13-seed, 16-seed)
  • 8-seed (10-seed, 11-seed, 14-seed, 15-seed)

The 11-seed, which has made a surprising number of Elite 8’s (10), has faced the 1-seed (8 times) a 4-seed and a 9-seed once, but never the 5. The most likely match-up to occur that hasn’t yet is the 5 v. 7. 7 v. 8 is also somewhat likely to occur for the first time in the Elite 8, although it has occurred in later rounds.

Looking at Elite 8 win results is the same thing as showing Final 4 appearances, so we will include the following table:

We’re again struck by the 1-seeds’ relative dominance. While it is more likely than not the 1-seed gets upset before it makes the Final Four, over 2 in 5 1-seeds have made the National Semifinals. More 1-seeds have made the Final Four as have seeds 3 or worse.

KU Focus E8

This is another stressful round for KU fans due to recent history. Since 1985, KU is 10-6 in the Elite 8, having won its most recent two games. Self is 4-5 overall in this round, with Brown and Williams going a combined 6-1 before Self took over. Given KU’s seed-lines, KU has out-performed the Elite 8 round by 1.2 games. Even with Self’s struggles, KU has been a solid Elite 8 team overall in the modern NCAA Tourney era.

Final 4 Results

The Final Four is the first round in which seed-lines can face off against each other, something that happens with some frequency with 1-seeds and almost never with other seeds. Let’s look at who the 1-seeds face when they make the National Semis:

  • 1-seed vs. 1-seed (15 times, or 30 total 1-seeds)
  • 1-seed vs. 2-seed (12 times)
  • 1-seed vs. 3-seed (7 times)
  • 1-seed vs. 4-seed (7 times)
  • 1-seed vs. 5-seed (2 times)
  • 1-seed vs. 7-seed (3 times)
  • 1-seed vs. 8-seed (1 time)
  • 1-seed vs. 9-seed (1 time)
  • 1-seed vs. 10-seed (1 time)
  • 1-seed vs. 11-seed (2 times)

Counting each contest, being sure to count the 1-seed vs. 1-seed games twice, this reconciles us with the 66 total 1-seeds to make the Final Four. 1-seeds have obviously gone 15-15 against each other in these matchups. In the other 36 matchups, where a 1-seed faced a worse seed, the top seeds went 26-10 (72.2%). The last time a non-1-seed defeated a 1-seed in the Final Four (National Semifinal round) was in 2014 (Connecticut over Florida). Since that time there have been 10 straight wins in this round by the top seed when facing a worse seed.

In addition to 1-seeds playing each other 15 times; 2-seeds have faced each other 3 times, 4-seeds once, and 5-seeds once. 3-seeds have never faced each other in the National Semis.

In terms of winning percentage during the Final Four, the seeds with the best success are the 6-seeds (2-1, 67%) and the 8-seeds (4-2, 67%). The 1-seeds win 62.1% of their National Semifinal contests, in large part due to the fact they often play each other (as we showed above, 1-seeds are 72.2% winners against non-1-seeds) whereas 6 and 8-seeds don’t.

A different way to look at the Final Four round is to look at how many of each seed makes the Championship Game. Of the 78 teams to have won in the Final Four (and thus made it to Monday night), 50% of them have been 1-seeds. Here is the rest of the break-down by seed-line:

  • 1-seeds: 41 (51%)
  • 2-seeds: 13 (16%)
  • 3-seeds: 11 (14%)
  • 4-seeds: 4 (5%)
  • 5-seeds: 4 (5%)
  • 6-seeds: 2 (3%)
  • 7-seeds: 1 (1%)
  • 8-seeds: 4 (5%)

After the top 3 seeds, there isn’t much difference between the remaining seeds. The 8-seeds appear to be overrepresented, especially when you consider that no 9-seeds have made the Title Game.

An all 1-seed Final Four has occurred twice (2008, 2025), while a no-1-seed Final Four has occurred three times since 1985.

KU Focus F4

KU has made 10 Final Fours in the modern tournament era. This puts it third, behind Duke (14) and North Carolina (12). KU has gone 6-4 in this span, and it has won 4 of its last 5 National Semifinal contests. Interestingly, KU has faced only 6 different teams in this round since 1985. It has played North Carolina three times, Duke twice, Villanova twice, and Maryland, Ohio State, and Marquette once. And this is just in relation to the Final Four round. The Championship Game has seen KU face off against Duke and North Carolina as well during this time period. Given its seeds over the years, KU’s 6-4 record has put it 0.0 games against normal in this round.

National Championship Results

The National Championship game is distinct from the Final Four or National Semifinal round despite being played at the same place. Many get this confused for some reason, or ignore the magnitude of winning a Final Four game just to get to the National Championship game. There have been 40 National Championship games in the modern tournament era. Here are the teams who have won (total titles in parentheses):

  • Connecticut (6)
  • Duke (5)
  • North Carolina (4)
  • Kansas (3)
  • Kentucky (3)
  • Villanova (3)
  • Florida (3)
  • Louisville (2)
  • UCLA (1)
  • Indiana (1)
  • Syracuse (1)
  • Michigan State (1)
  • Michigan (1)
  • Arkansas (1)
  • Arizona (1)
  • Virginia (1)
  • Maryland (1)
  • Baylor (1)
  • UNLV (1)

What we should first note is that the 1-seeds have dominated National Championships. 1-seeds have collectively won 65% of the Titles, or 26 of 40. The other 14 titles were won by 2-seeds (13%, 5 titles), 3-seeds (10%, 4 titles), 4-seeds (5%, 2 titles), 6-seeds (3%, 1 title), 7-seeds (3%, 1 title), and 8-seeds (3%, 1 title). The 5-seed has never won.

1-seeds have faced off against each other 10 times, obviously going 10-10 in these contests. In the other contests, those of a 1-seed against a non-1-seed, the 1-seed’s record has been 16-5 (76.2%). This dominance is quite significant and helps to explain why 1-seeds appear to be overachieving their National Title numbers. However, this holds if we look at Title Games without 1-seeds.

In the 29 National Championship games which saw two different seeds face off against each other, the better seed’s record is 22-7 (75.9%). This seems to be remarkable. In the first four rounds of the entire tournament since 1985, seed-favorites have only won 71.5% of their games. In other words, seed-upsets are more common the first two weekends than in the final weekend, even though there are multiple seed-lopsided games in the earlier rounds of the tournament (1 v. 16, 2 v. 15, etc.). One would expect more 2-seeds and 3-seeds to defeat 1-seeds, or more 3-seeds and 4-seeds to defeat 2-seeds in the National Title game. But it happens relatively rarely. It was mentioned that 1-seeds have faced each other 10 times in the National Championship game since 1985, but we should add that once have 3-seeds faced each other for the Title (Michigan/Seton Hall in 1989). In 40 64-team Tournaments, never have two 2-seeds faced each other in the National Championship game. This seems almost impossible.4

The average game margin has been 8.7 points. The closest games were 1-point differences (1987, 1989), and the 2008 game was an overtime game decided by 7 points after 45 minutes. The biggest blow out was 30 points (1990). Of all rounds, the National Championship round has seen the closest end-of-game margins, so there’s an argument to be made that the best games have been in this round.

KU Focus NC

KU has played in 6 National Championship games since 1985. These games, in order, are as follows:

  • 1988. (6) Kansas 83, (1) Oklahoma 79
  • 1991. (3) Kansas 65, (2) Duke 72
  • 2003. (2) Kansas 78, (3) Syracuse 81
  • 2008. (1) Kansas 75, (1) Memphis 68
  • 2012. (2) Kansas 59, (1) Kentucky 67
  • 2022. (1) Kansas 72, (8) North Carolina 69

KU has gone 3-3 in the National Championship game in the 64-team era. All 6 of its games have been decided by single-digits. These games have been exciting.

If we consider KU’s seeds over the years, we’d expect them to have won 3.0 National Championship games in this span, which is right where they are. In spite of disappointing losses, “coulda, woulda, shoulda” games, and upset defeats; KU’s 3 national championships are no underachievement. In total, KU overachieves in getting past each round except the Round of 32 and Elite 8. Combined with the fact KU already gets great seeds to begin with, KU’s achievements in March Madness since 1985 have been elite.

3 NCAA Tourney MOP’s in the 64-team era.

  1. Seeding began in 1979 for a 48-team tournament, so there is more data that could be used. However, we will stick with 1985 as the beginning of our exercise for a few reasons. One, the bye-game that the top 4-seed received into the Round of 32 did affect the bracket. If seeds 1-4 had to play First Round games in these seasons, there would have been upsets that would have reverberated throughout the tournament. Two, 1985 is a great starting point because it closely aligns with two other modern innovations. The shot-clock was first used for the 1986 Tournament, and the 3-point line was first introduced for the 1987 Tournament. Therefore, the past 39 years mostly have what we would consider the modern game. A shot-clock, 3-point line, and 64-team bracket. ↩︎
  2. The 2018 season, in which KU officially vacated both their 1-seed and Final Four appearance, is included throughout the numbers in this post. While we don’t include these achievements when comparing KU’s status to other college basketball programs, we are keeping the 2018 results in this exercise for a few reasons. One, KU competed that season with the belief that their results were legitimate. Two, it makes things easier for our dataset. Three, the violation (money from Adidas rep to Silvio De Sousa’s guardian) is hardly a huge violation. Four, there’s a chance these vacated games get revalidated given the NCAA’s recent troubles in the court system. ↩︎
  3. The 1 vs. 4 Sweet 16 matchup happens 37.8% of the time. ↩︎
  4. If we accept that 2-seeds independently have a 16% chance of making the National Championship game, which is their actual total, then we’d expect 2-seeds to face off 3% of the time. In 40 seasons, we’d expect this to occur with a 65.7% chance. So, apparently it isn’t impossible for this not to occur yet. Still, we might expect 2-seeds to make the Title game more frequently than 16%, which if they did would improve their odds of having two 2-seeds face off in the NC game. Bump the 2-seed odds to 25% for a NC appearance, and there’s a 93.4% chance two 2-seeds would face each other in 40 National Title games. ↩︎

The Final Push

The 2024 Kansas Jayhawks finished the regular season portion of the schedule at 22-9, with a 10-8 conference record. Both of these marks are disappointments for a team which came into the season as the #1 team in the AP poll. To add injury(ies) to insult, KU’s two-best players on the season (Kevin McCullar and Hunter Dickinson) are questionable moving forward as the Jayhawks attempt to navigate the treacherous postseason waters.

Worst Case Scenario: No McCullar, No Dickinson

If KU were without the services of McCullar and Dickinson for the season, the team would have played below a bubble-team. Its other 7 rotation players average -2.13 points per 100 value. Even if you could manage the minutes to play the best players more (Adams, Harris) and the worst players less (Jackson, McDowell); the team would still struggle to be bubble-level with this 7-man squad. One glimmer of hope is that this collection of 7 players has performed better of late. In the last 10 games, these 7 players have been collectively a +2.46 per game team. While there’s no guarantee they can play this way without Hunter/Kevin (i.e. some of this value has been due to getting assists on baskets by these players), the team is actually more balanced now than it’s been anytime this season.

Possible Case: Getting 1 of them Back

Quite possibly, KU could get either Hunter or Kevin back but not the other. If Kevin’s out, this would look much like it has earlier in the season when he couldn’t go. Hunter would get a heavy diet of touches and look to score against or pass out of double teams. In the 5 games where KU played without Kevin, the Hawks averaged a +3.15 game score (+5.67 with him).

Getting Kevin back but not Hunter would be better than getting neither back, but there’s less info on how this would play out (the only time KU hasn’t had Hunter in is when he’s getting a breather, but that’s quite a big difference than not having him for a whole game or games). Kansas with Kevin but without Hunter would play smaller and likely attack defenses differently.

Best Case: Both Come Back

If both come back by the First Round of the NCAA Tournament, this KU team has a decent chance of making the second weekend. If KU can limit the minutes of Jackson, Braun, and McDowell to about 10-15 total per game, the other 185 will be filled by guys who are all better-than-bubble or trending near bubble-level. In conference play, Nick Timberlake is actually an above-bubble player (+0.02 per game). He defends adequately and has rebounded well for a wing-guard. His shooting has been a disappointment, but he limits his turnovers and doesn’t force a ton of bad shots. Johnny Furphy has dropped off in the last few games, but he is still near bubble-level for the season (-0.16 per game). Dajuan Harris has made the biggest climb in recent weeks, as he’s finally starting to defend at an all-conference level again. In total, his +1.42 per game value-score in conference play (+2.71 per game over last 10) puts him where he is adding value most nights. These three, alongside Adams/McCullar/Dickinson, make for a solid-enough team that can hang with any team on a neutral court. It may need a few breaks along the way, but this team would be worth paying attention to.

Assessing the Regular Season

KU was projected to be a +8.51 per game team, and it finished at +5.26 per game. This was a miss of 3.25 ppg, which is quite large in the grand scheme of things. At different points of the season the Jayhawks have had problems with guard-play, incoming players, depth, road games, injuries, and outside shooting. At the moment, all of these factors are contributing to what is looking like a disappointing season.

Big 12 Tournament

The Conference Tournament begins for Kansas on Wednesday, and the Jayhawks will likely face Cincinnati (could face West Virginia). As it’s looking more and more likely that both Hunter Dickinson and Kevin McCullar will miss this week to recover for the NCAA Tournament, KU is down to 7 scholarship players (of whom only 1 has produced above-bubble value this season). We will deign this group the “Scrub Squad.”

Utilizing the value-scores produced by each player, but looking at this from a per game and per 100 possession basis (while estimating minutes played), and additionally looking at the value-scores both from a season-long perspective and a recent-game perspective; we predict the per game value of each player should be around this:

  • Dajuan Harris +1.26
  • Elmarko Jackson -2.83
  • K.J. Adams +3.48
  • Nicolas Timberlake -0.70
  • Johnny Furphy -0.60
  • Parker Braun -0.83
  • Jamari McDowell -0.57

The TEAM score is -0.80. Given Cincinnati is playing a touch above bubble-level, but also that the game is in Kansas City, our objective prediction is that this is a 50/50 matchup. Cincy will be hungry to make a run if it wants to make the NCAA Tournament (it may need to win 3 or 4 games in the B12 Tourney). However, the Bearcats aren’t a great outside shooting team. KU has a chance to outscore them from the perimeter, something the Jayhawks haven’t done to an opponent since…the Kansas/Cincinnati game in January. If KU faces West Virginia, KU should be an 8-point favorite.

Beware of the Phog

Earlier drafts are here and here.

For a detailed look at KU’s excellent job of getting late-game defensive stops when the Jayhawks need them, click here.

It’s not exactly a secret that KU has a great home-court advantage. Since 2010, the Kansas Jayhawks have gone 227-12 in Allen Fieldhouse (95.0%). In conference play during these 15 seasons, KU’s record is 124-9, a 93.2% winning rate. For reference, in all 2-seed/15-seed match-ups in the NCAA Tournament since 1985, the 2-seed has a winning percentage of 92.8%. If this feels absurd, it’s because it is.

These records are a feature of three different things. First, Kansas has been very good in this span. Here is a list of accomplishments for Kansas in that span:

  • 2022 National Champions
  • 3 Final Four apperances
  • 14/14 seasons1 receiving a 4-seed or better
  • 14/14 seasons making the Round of 32 or further (includes ’24)
  • 11 Big 12 regular season titles
  • 7 Big 12 tournament titles

So, a huge reason for KU’s success has been its strength. It has had consistently great teams.

The second reason KU has been so good at home is due to generic home-court advantage. In college basketball, the median home-court advantage is 2.9 points (according to KenPom)2. Teams play better at home in a quantifiable way, one that will lead them to have more wins than if they faced the same opponents in neutral or true road games. Even if KU played home games at just an average gym, by virtue of it being the home arena, KU would have some advantage.

But, once we take into account KU’s strength through the years and the generic home-court advantage, we still see that Kansas has won more games in Allen Fieldhouse than expected. For instance, since the beginning of 2010, Kentucky has had 25 losses at Rupp Arena and Duke has had 23 losses at Cameron Indoor. Given that these three programs have, for the most part, also been consistently excellent, that’s quite a gap.

The third reason KU wins so often at home is because of “THE PHOG,” an effect we classify in ALL CAPS in homage to the sign that hangs in the Fieldhouse. And we can show this effect is real.

Utilizing KenPom’s subscription services, we note that it provides pregame estimates for each game since 20103 (which is why we focus on 2010-present and not a different sampling of seasons). These pregame estimates will serve as our main data-points in order to prove that THE PHOG is indeed a magical place.

Pomeroy’s pregame estimates are devised by his algorithm and take into account each team’s relative strengths, the location of the game, and the broader data of all college basketball games to estimate the pregame win probability for each game. What makes this important is that it is neutral to any non-quantifiable factors, such as the mysterious PHOG of Allen Fieldhouse. Even though Allen Fieldhouse is special, Pomeroy’s algorithm treats it as any other gym, and because it does so, we can test to see if the Fieldhouse accounts for more wins than the Pomeroy algorithm predicted.

As we said earlier, KU has played 239 games in Allen Fieldhouse in the 15 seasons from 2010 to 2024. In each of these games, Pomeroy has made a pregame prediction. For instance, against Kansas State last night (March 5, 2024), Pomeroy’s algorithm gave KU a 84.4% chance of winning at the tip. After recording each pregame prediction in a spreadsheet, all we need to do is add up the cumulative estimated wins to see how many wins THE PHOG is worth. After all, we can confidently say that Pomeroy’s algorithm has accounted for KU’s high team strength as well as a generic home-court advantage.

Since 2010, Pomeroy’s pregame predictions have estimated that KU should have won 207.59 games, which is 19.41 games fewer than what KU actually won (227). This comes to 1.29 wins per season. THE PHOG effect is real.

To better show this, we tested to see how likely it was for KU to overachieve its home win total by 19.41 games over this period. Using the KenPom pregame predictions for each of the 239 games, we simulated these home games 10,000 times to see if we could reach 227 wins just by random chance. The results are below:

The average number of wins was 207.56, very close to the 207.59 total that was the sum of all KenPom pregame predictions. This shows that the 10,000 simulations was high enough to produce meaningful results. From here, note that the maximum number of wins produced through randomness was 223. Using the dataset of 10,000 simulations, we next show that the z-score for 227 wins is 4.09! or in the 100.00th percentile. A better way of understanding this is that we expect to have 227 wins or better only 1 time out of 46,123. This is further confirmation that THE PHOG is real and all must pay heed.

Betting Odds, A Free Lunch?

Betting on Kansas to win at home has consistently proven to be a winner. Using data going back to 2008, we estimate that if a bettor placed a $10 money-line bet on each home game4 since (276 total games), he’d have $224.81 today. This is a 20.7% annualized return. Additionally, one wouldn’t have gone negative at any time. Only twice in 15 years would this bettor have had a negative profit for that season (2011 & 2018). Betting on Kansas to win in Allen Fieldhouse has been more profitable and safer than the stock market.5

This shouldn’t be possible according to conventional theory. At some point, KU’s home-court advantage should be priced into the market. However, this strategy has only gotten more profitable in recent years. Since 2019, the average season has netted $21.24 (using $10 money line bets), more than the $13.22 average season net since 2008.

The market is likely doing the same thing as KenPom’s algorithm. It prices in the fact KU is usually the better team, and it sees a strong home-court advantage. Still, the market is trying to account for the fact that road teams do occasionally pull the upset but is still falling for seemingly-attractive prices for the road team that nevertheless aren’t equal bets due to how strong THE PHOG is.

Comparing Other Arenas

UPDATED FOR 2025

The fact Allen Fieldhouse continues to produce wins is a testament to its status as the world’s largest home court advantage.

In order to make this study more robust, we’ve begun to look at how much aura there is at other home court arenas. As this takes time to gather the data, so far only the following schools (and arenas) have been examined. These are ranked by z-score. In addition, we list Kansas and Allen Fieldhouse.

TeamHome ArenaWLW%WAEz-scr%ileWAE/100
KansasAllen Fieldhouse2411594.1%19.193.8599.99%7.50
PurdueMackey Arena2253586.5%12.492.3098.92%4.80
UCLAPauley Pavilion2164782.1%11.601.9797.57%4.41
Iowa StateHilton Coliseum2066077.4%8.541.4392.36%3.21
KentuckyRupp Arena2492889.9%7.671.5593.97%2.77
North CarolinaDean Smith Center62114084.1%4.110.7777.96%1.64
GonzagaMcCarthy Athletic Center72341892.9%2.080.3362.79%0.50
DukeCameron Indoor Stadium2412490.9%0.750.1957.36%0.28

The teams selected are traditionally successful and have home courts which have reputations for being tough venues for opposing teams to win at. As these teams play different schedules and have unique strength-levels, comparing z-scores is the best way to isolate out the effects of the home courts themselves. While venues like Hilton Coliseum and Mackey Arena are quite strong (matching their reputations), none compares to Allen Fieldhouse.

The far-right column normalizes home games played in terms of 100 games. In other words, Allen Fieldhouse is responsible for 7.50 wins per 100 games KU plays there. Contrast this with Cameron Indoor, which has only earned Duke 0.28 wins per 100 games over the last 16 seasons (2010 – 2025).

Update Following 2025 Season

The Kansas Jayhawks did not have the best 2025 regular season, and ended up losing 3 home games for the first time since 2018. This tied the team’s highest number of home losses in the Bill Self era.

Overall, KU went 14-3 in Allen Fieldhouse in the 2025 season, or -0.219 games worse than KenPom expected (looking at his tip-off win percentages). So even though KU underperformed at home this season, it wasn’t by a whole lot.

Including the 2025 data and rerunning the simulations, we see the PHOG effect slip a bit but it is still very pronounced.

This shows that if you ran 10,000 random scenarios of KU basketball at Allen Fieldhouse since the 2010 season, you’d expect the team to win 237 games at most, and that only 1 time out of 17,205 would you expect KU to win the 241 total games it actually has at the Phog over this period. KU’s total Wins Above Expectation (WAE) is now 19.19, or 1.19 wins per season. So on average the PHOG is worth over 1 win per season when compared to an otherwise good college home court advantage.

Betting in 2025

Going 14-3 at home would have lost the hypothetical bettor taking KU with the money line each game. Had he bet $10 at the start of each game on the money line, he’d have lost $11.73 in the 2025 season. Now he’d still be up $213.08 since 2010 using this strategy.

Had he bet 10% of the pot each time (a strategy that would have turned $100 into $829.63 from 2010 – 2024), he’d have lost 12.3% of his incoming stake during the 2025 season (but would still be at $723.58 at season’s end if he started with $100 in the 2010 season). This would be a 13.17% annualized rate of return.

  1. The 2020 season was cancelled a few days before Selection Sunday, and no official bracket was released. However, KU was a consensus #1 seed regardless at that point. ↩︎
  2. KU’s generic home-court advantage on KenPom is 3.8 points, or 31st in D-1. ↩︎
  3. KenPom users may wonder where the 2010 season’s pregame predictions are as Fan Match only goes back to 2011. However, KenPom’s win probability charts for each game go back to 2010, and we can see what the win probabilities were at tip off. ↩︎
  4. Some of the buy-games didn’t offer a money-line option, and more recent ones are something like -100000 (meaning you’d have to lay down $10 to win $0.01) ↩︎
  5. One difference is that you have to keep betting $10 even if you are negative, which makes this strategy inherently riskier than typical diversified stock market investments. An alternate suggestion would be to bet 10% of the portfolio (i.e. start with $100, bet $10, if you win [say $3 back], you have $103 in the portfolio and bet $10.30 for the next game). This strategy, since 2008, gets you to a $829.63 portfolio. This is an annual return of 13.6%. ↩︎
  6. Since 2010, UNC has also played 2 home games at Carmichael Arena ↩︎
  7. Since 2010, Gonzaga has played at least 1 home game at Spokane Arena ↩︎

NCAA Tournament

Each linked post has to do with college basketball’s biggest event, the NCAA Tournament.

Guards and March

A Look Through the Bracket in the 64-Team Era

KU’s NCAA Tournament Paths by Difficulty

Understanding the NCAA Tournament Committee – 2024

Grading the NCAA Tournament Committee – 2025

NCAA Tournament Selection – 2026 Pre-Tourney Case Study

Bracketology 2026 – Weighting Team Sheets

Grading the NCAA Tournament Committee – 2026

2026 NCAA Tournament – First Round Preview

Guards and March

Note: This post is one in a series in which we examine the NCAA Tournament in some specific detail. Terms such as “the NCAA’s,” “Tournament,” “Tourney,” “March Madness,” or “March” refer primarily to the NCAA Tournament. Today’s installment looks at the relative importance of guards in the success of NCAA Tournament teams. Initial date of publication: 2/23/2024.

The purpose of this post is to examine if guards really do win in March. There are many claims college basketball fans make that are to the effect that good guards are primarily what matters in the Tournament. Some say that Cinderella runs are fueled mostly by great guard-play, others will extend this to better-seeded teams and say that Final 4 or National Championship teams tend to have elite guards. Others will take this idea even further and claim that interior-based teams which rely on post-play are destined for early exits due to their playing style, regardless of how good they were in the regular season.

Logically this doesn’t really make sense. If a team wins during the season with elite big-men who dominate in the post, why can’t it do so in the NCAA Tournament? After all, it’s the same 40-minute game in the Tournament as it was all year. Sure, maybe there are factors which make March basketball distinct (perhaps the games are officiated slightly differently, etc.), but for the most part the game is mostly the same game it was all season. We should see all types of playing styles work in March.

At the same time, the idea that guard-play is of heightened importance in March does seem to have a hint of truth to it. Looking back to last season’s Tourney (2023 NCAA’s), the Purdue Boilermakers Zach Edeys were a dominant regular season team which earned a 1-seed only to fall in the First Round to 16-seed Fairleigh Dickinson as 23-point favorites. FDU was a guard-oriented team1 that attacked Purdue from the perimeter. Although less-remembered, the 2023 Arizona Wildcats earned a 2-seed on the backs of a strong front-line (with weaker guards) and got bounced by a veteran Princeton team. Other forward-dominant teams also underachieved, whereas strong guard-play propelled Miami and Florida Atlantic to Final 4 appearances. 5’8 point guard Markquis Nowell single-handedly lifted K-State to an Elite 8, averaging 23.5 PPG and 13.5 APG on efficient shooting during his four-game run.

These anecdotes aside, it would be better if we could test to see if a guard-based style is better than a forward or interior-based style in March. But how could we do this? Let’s first by defining the problem and then introduce some terms that will help.

Guards to Posts – A Continuum

We will conceive of how teams play as a playing Style. Teams which feature guards for higher-than-normal minutes or rely on guards for higher-than-normal production will be classified as having a more guards-based style. Teams that rely on interior players to eat minutes or produce value will have a more interior-based style. This metric will be on a continuum. Certain teams will be very guard-heavy; others will be very interior-heavy. And in the middle there will be a bunch of teams with a more-balanced attack.

Terms

In discussing Style, we are attempting to understand where a particular team falls on this guard to post continuum. Style can be used to describe teams in other ways; such as fast vs. slow tempo, man-defense vs. defense with zone-concepts, and so on, but for our purposes in this post when style is used it is referring to how guard-dominant or forward-dominant a team is.

Relatedly, the two poles of this spectrum are guard-oriented and post-oriented. We will use other terms to describe these extremes, such as guard-based or guard-led or guard-dominant. The same terms will be used for the other pole, just with post or interior or forward used instead of guard.

Other terms will be defined when we get to them, but for the rest of the blog-post, keep the above continuum in mind when considering a team’s playing style.

Problem

Teams clearly play different styles, but how do we quantify these differences? What makes a team guard-based or forward-led? In order to classify teams into playing styles, we will need to get each team’s roster of players and classify each player into a certain position. From here, we will need to find a way to appropriately weight each player’s contribution to the team’s style. For instance, a team which has a slew of walk-ons that are all guards but relies on and plays a forward-heavy rotation is better defined as forward-dominant.

Data

We used Bart Torvik to collect the data, including player positional data. Torvik has already classified each player into a position based on his own algorithmic criteria. We will use his data and trust his insight on a basis from which to build our own analysis. Getting to player position, Torvik has classified players into 8 different positions. Using the 1-5, PG-C basketball-position concept, we will assign each position into a numeric role so that a quantifiable analysis can be achieved. These roles, and corresponding numbers are below.

  • Pure PG (1.0)
  • Scoring PG (1.0)
  • Combo G (1.6)
  • Wing G (2.0)
  • Wing F (3.0)
  • Stretch 4 (3.7)
  • PF/C (4.3)
  • C (5.0)

Some of these positions are hybrid-roles, so their numeric value is in between two positions. Torvik doesn’t list anyone as a pure PF (4), but many of these types are filled in the PF/C role with some getting a Stretch 4 role. Stretch 4’s aren’t traditional 4-men, but instead a hybrid between a 4 (bigger, good defensive rebounder) and Wing F (can hit outside shots).

We limited data to include only the 68 NCAA Tournament teams. We then gathered the following information from Torvik for each player that earned 10% of minutes for his team.

  • Player Name
  • Team
  • Role (position)
  • Min%
  • Box Plus-Minus (BPM)

Analysis

There are two different ways that team style can be calculated. One is what we call Style-Value. Style-Value (S-V) is when a team’s style is determined by how much value its guards bring in relative to how much value its interior players bring in. Value itself is calculated through using BPM and converting it to Wins Above Replacement (WAR)2.

The other way to determine team style is by Style-Minutes. Style-Minutes (S-M) calculates style by seeing how many minutes each position plays. Guard-heavy teams will often have multiple point-guards or play 4-guard lineups. Forward-heavy teams will be more traditional in terms of minutes allotment, often having two PF/C types on the floor and/or multiple Wing F’s at times.

These two styles have some correlation to each other, but it isn’t super-strong. We will consider both S-V and S-M in our analysis.

After normalizing style, we see that these teams were the most guard-like in terms of S-V among 2023 NCAA Tournament teams:

  • Penn State (-2.22 z-score, 10-seed, R32)
  • Baylor (-1.92 z-score, 3-seed R32)
  • Kansas State (-1.83 z-score, 3-seed, E8)
  • UCLA (-1.58 z-score, 2-seed, S16)
  • Miami FL (-1.28 z-score, 5-seed, F4)

Compare this list to the most guard-like teams in terms of S-M:

  • Nevada (-2.38 z-score, 10-seed, R64)
  • Fairleigh Dickinson (-2.20 z-score, 16-seed, R32)
  • Vermont (-1.70 z-score, 15-seed, R64)
  • Missouri (-1.69 z-score, 7-seed, R32)
  • Colgate (-1.53 z-score, 15-seed, R64)

The top list shows the teams that had elite guard-play, particularly relative to their forwards. The second list shows mid and low-major teams that relied on guard-play, although it wasn’t necessarily that they had elite guards. When we deal with teams in the NCAA Tournament, you have to understand that each team has different goals. For a top seed, making the Final 4 is a reasonable goal. For double-digits seeds, the more likely goal is just an upset win. So we will use both lists, S-V and S-M.

There were different ways to analyze the relative success of guard-oriented teams. We first looked to see how strong the correlation was between style and overall success. We looked for correlation between style and relative success (to seed). There was only a tiny correlation between guard-oriented style and team success, with S-M seeing stronger correlation than S-V.

After viewing correlation, we looked to see if the most guard-oriented teams fared better than the most forward-oriented teams. We filtered out only the styles that were a SD more guard-like than the mean or a SD more forward-like than the mean. Using S-V, we saw that the most guard-like teams won +2.1 games more than expected overall and the most forward-like teams won -3.6 games than expected overall. This was an advantage of 5.7 wins in favor of the guard-heavy teams and worked out to 0.3 wins per team. This isn’t a small difference.

We did the same thing for S-M, and got a difference of +4.4 wins for the heavy-guard teams relative to the forward-heavy teams (which worked out to about 0.2 wins per team). Again these results are in the direction of supporting the conventional wisdom regarding guards and March.

Next we looked at head-to-head results. Previously it was just records overall. But we wanted to see if having a heavier guard-based style was advantageous in head-to-head contests. In the NCAA Tournament there were 67 games played, and the more guard-based S-V team won 36 of these games. For S-M, the more guard-based team won 29/67. These results may seem conflicting, but they actually will lead us to a later insight.

Looking at head-to-head contests but considering Wins Against Expectation (WAE), we see that guard-oriented teams overachieve on the whole. Teams that are more guard-oriented than their opponents won +2.07 more expected games (S-V) or +2.43 more expected games (S-M).

If we look at head-to-head contests from the perspective of the underdog, we see that guard-based underdogs have a +1.80 WAE and forward-based underdogs have a -0.86 WAE in terms of S-V. This comes to a difference of +2.66 in favor of guards-based teams. Looking at the same thing from S-M, this is +1.57 and -1.76 WAE, or a difference of +3.33 in favor of guards-based teams. This doesn’t seem insignificant. Playing a guard-oriented style seemingly helps underdog teams overachieve in March.

We will look at final margin. Using S-V, we see that the more guard-based team is better than its opponent by 0.7 points per game. Using S-M, this is nearly 2.0 points per game better for the guard-based team. It makes sense that if the guard-based team is winning more than expected it is also doing better on expected margin.

So far in head-to-head results, we’ve been considering which team was relatively more guard-oriented to its opponent. But it isn’t like teams can schedule which style on the bracket they get to play against. They can, of course, determine the make-up of their own style. So what happens if we look at the relative success for guard-based teams regardless of opponent?

There were 30 games which faced a guard-oriented team against a forward-oriented team (using S-V). Paradoxically from what we’ve seen from earlier results, the results viewed this way favor forward-based teams. When we look at how guards-based teams fare against forward-based teams, the guards-based teams underachieve, with -2.53 WAE and -1.6 points per game (forwards-based teams are the inverse).

But when we do the same exercise on Style-Minutes, we see that guards-based teams overachieve by +6.05 WAE and are +5.1 points per game better than expected. This shows the importance of defining style. If we say a team is guards-based by looking at the relative value that team’s guards provide, it can give a whole different answer than if we say a team is guards-based by looking at its minutes distribution by position.

Making Some Conclusions

So where does this leave us? Is style important? Do guards win in March? And if so, how can this be used by coaches to gain competitive advantage?

Based on evidence so far, we would conclude not that interior-based styles are doomed to fail, but that guards-based styles are more likely to overachieve in March Madness. While there are weak correlations seen when we regress a team’s style against its success in the 2023 NCAA Tournament, when we filter out the most guard-heavy and forward-heavy teams, there is a clear bias in favor of the guard-heavy teams (relative to pre-Tournament expectation).

Likewise, when we view head-to-head results, the team that is more guard-oriented outperforms the team that is more forward-oriented on the whole. If we look at guard-based teams in head-to-head results (regardless of opponent-style), there is a contradictory answer based on if we base style upon value (Style-Value) or minutes (Style-Minutes). In all assessments, the Style-Minutes view showed stronger benefit for guard-based teams.

Overachievement is the key word. Guards-based styles displayed a better chance of winning when looking at pre-game or pre-Tournament expectation.

However, it isn’t clear how much coaches can use this to their advantage. Particularly because they do so already. Low and mid-major teams looking to pull the upset off are already more likely to be more guard-oriented than their favored opponent. In fact, of all the correlations we ran, the strongest one we found was between a team’s pre-Tournament computer strength and its style as a forward-based team. The best teams heading into the 2023 NCAA Tournament were more likely to be interior-based when compared to the average Tourney team.

But if low to mid-major teams gain a March advantage by playing guard-based styles, can this be neutralized by favorites looking to stave off an upset by playing small themselves? This is tough to say. In one sense, coaches of top teams are best to stick with the style that got them to a good seed in the NCAA’s, as they are still the favorite against the guard-based underdog. A favorite changing its playing style to become more guard-focused might help in some areas but hurt in far more areas (such as dominating the glass and paint). This trade-off might not be worth it.

Additionally, and this hasn’t been analyzed, but favorites might already be changing up their styles during March Madness, and this is partially to blame. Perhaps forward-based teams are going away from what got them to the Big Dance once things get tight in a early-round game, and this is being reflected in the data! We just don’t know.

We’ll close this section with examining the biggest upset in the 2023 Tourney. Purdue’s loss was blamed on its guards, and it strengthened the claim of those who say guards win in March. At the same time, this ignores how well Zach Edey played. Edey had 21 points, 15 rebounds, and 3 blocks. He drew fouls and made FDU work on the defensive end. While it wasn’t enough, had Purdue escaped the upset it would have been due to the team’s interior play. The point is that Purdue wouldn’t have benefited from changing up the style of play that earned it a 1-seed. Rather, it just needed its guards to not choke. The guards/wings went 5-26 from 3. Purdue had 16 turnovers but forced only 9. It lost the game on the perimeter for sure. But if Edey didn’t play, it wouldn’t have had the big advantage inside either, which would have made things worse.

More to Come

With the 2024 tournament coming up, it will be interesting to see if these patterns hold and if this information can be used in filling out a bracket. Picking guard-based top seeds to make deeper runs (using S-V) or double-digit upsets (using S-M) might be a successful strategy. We’ll fill out a few brackets using these principles and see how they do.

Beyond this, we will want to see if this is consistent across tournaments. 2023 had quite a few upsets, so this could have been the reason guards-based teams overachieved. Maybe 2019 (all but one S16 team was a 5-seed or better) or 2008 (all Final 4 teams were 1-seeds) will show the reverse. Maybe upsets or deep-runs are more memorable when a team is led by its guards, and this clouds our view on how style plays into Tournament success.

  1. FDU was certainly guard-oriented from a minutes-played perspective, but in terms of player-value, FDU was not a team which featured even average guard-play during the 2023 season. FDU wasn’t good at all during the 2023 season, and entered the NCAA Tournament somewhere in the mid-200’s in computer rankings. If anything, it could be seen as having better forwards than guards as its interior players were less-bad than its guards. ↩︎
  2. WAR multiplies BPM by Min% by a set # of games by a multiple to estimate a player’s contribution to team wins. ↩︎

K.J. Adams’ Defense

After Jalen Wilson departed for the NBA and KU picked up 7’1 center Hunter Dickinson in the portal, K.J. Adams shifted his position from the 5-spot to the 4-spot in KU’s starting line-up. This shift has been seen on both ends of the floor. Offensively, he’s posting up less and making more plays on the perimeter as a creator (where he’s third on the team in assists). And while he doesn’t have what one would call “range,” he’s been making some mid-range jumpers and push-shots with Hunter underneath to rebound, which is what a traditional 4-man does when he is playing with a true 5-man.

But it is K.J. Adams’ defense which has been the most-valuable part of his game with his switch to the 4-spot. Last season, as someone primarily guarding the opposing 5-man at a height and length disadvantage, Adams was basically a neutral-value defender, finishing with a Per100 points-against bubble of -0.22. He gave up 12.7 points per 60 possessions (worst among the starters) as he had to battle inside. (Adams was able to benefit by having a slower player on him on the offensive end, so he did finish as a positive-value player overall (+0.49 per game)). In 2024, Adams is KU’s strongest defender, with a +5.01 Per100 value. And while his rebounding hasn’t really improved, he is giving up only 7.7 points per 60 possessions now that he’s guarding mostly wings and forwards. This defensive stinginess not only leads the team, but is close to the range of what KU’s best defenders have allowed over the past decades.

Since 2018, we have tracked defensive value at detailed-enough level to estimate which players were the best at not allowing points to be scored. This is seven seasons of data, including 2024. In this time, only three times has a player been a stingier defender than K.J. Adams this season. Marcus Garrett (2020 and 2021) accounts for two of these seasons. The other, which you wouldn’t probably guess correctly if you had 20 chances, was Isaiah Moss. While Moss didn’t rebound or force turnovers, he stayed close to his man and didn’t overhelp. Overhelping, particularly off wing shooters, is where many teams lose defensive value. Completely leaving one’s man should only be done to prevent an uncontested layup or wide-open 3 by a good shooter. Moss wasn’t overly athletic, but he had a high BBIQ as a veteran defender.

But back to K.J. K.J.’s value on the defensive end is estimated to be +5.01 points above that of a bubble-level player Per100 possessions. If we look at this from a per game ratio, then Adams is producing an estimated +2.91 points of defensive value above a KU-caliber replacement. According to current information, this would put him as having the 7th-best defensive season in the last 32 seasons (there have been 453 player-seasons in that time. K.J.’s 7th of 453).

That’s rather incredible. Whenever K.J.’s defense is talked about by fans, it’s often derided due to him not getting enough rebounds or having “short arms.” It’s true he doesn’t add value through rebounds or forcing turnovers. But he does an excellent job of not giving up easy scoring opportunities. He uses his strength to guard bigger players and his quickness to stay in front of guards. This versatility means he can easily switch positions 1-4 (and as we saw last season, can also play some against 5’s without being dominated). In turn, this forces teams to over-pass or take a less-than-ideal shot on certain possessions. All of this shows up in the numbers when we chart each defensive possession.

Note that these value estimates aren’t an exact science. Other sources don’t see him as having this much defensive value. Hoop-explorer doesn’t see much difference (although it relies on On/Off data which is very noisy and probably not wholly accurate). Evan Miya, which uses On/Off data and attempts to normalize the relative strengths of the other 9 players on the floor, has him as KU’s fourth-best defender. Without being overly critical, this seems to discount the on/off method for assessing player value. It isn’t K.J.’s fault if another teammate blows a defensive assignment when he’s in the game. While, with enough of a sample size, this “noise” would eventually even itself out (theoretically leaving you with just the player’s impact), it doesn’t seem to be the case unless there is a much larger sampling of minutes played. While K.J. has played 840 minutes so far, this only leaves 165 which he is on the bench. On/Off here isn’t really helping.

In 25 games this season, K.J. has posted positive defensive-scores in 21 of them. Teams aren’t attacking him much (like they would last season if they had a capable big). This means he’s doing his part. KU’s had defensive lapses, particularly among ball-screen coverage, but this is mostly due to Hunter being out of position (KU would do better to drop him rather than have him hard-hedge) or a separate wing/guard not being good at rotating over. K.J.’s fewest minutes in a game came against Chaminade, after he arrived following the death of his mom and didn’t start. He wasn’t expected to play, but did get on the court for 26 minutes and produced a small positive amount of defensive value. Self clearly wanted him on the court despite the opponent being a Division II team. This is further evidence that his defense warrants playing time, and is thus valuable.

Hunter Dickinson’s Defense

All KU fans agree that Hunter Dickinson is a skilled and valuable offensive player. Some argue that Dickinson’s defensive deficiencies (they take for granted he’s a poor defender) severely undercut his offensive value. This post will examine Hunter’s defense by comparing him to other players on this season’s roster as well as KU centers in seasons past.

A player can be a plus defender in one of two broad ways. He can either do so by limiting the amount of points his man scores or he can be a good defender by getting the ball back for his team (such as rebounding). Note that these are related. A defender getting a rebound is also preventing his man from scoring on a putback attempt. The very best defenders are good at both aspects–they limit their opponents’ good looks and they get the ball back for their team.

Applying this to Hunter in particular, we want to examine how often he is most responsible for the other team scoring (compared to others) and how often he wins possession back through a block, rebound, steal, or forced turnover (compared to others).

Using the Charting methods, we calculate that Hunter has allowed 276 points in 23 games this season (12.0 ppg). When we convert this to a 60-possession basis, this comes to 12.9 per 60. This conversion is done to compare Hunter to other players.

Next, we can count the number of stops KU gets because Hunter gets the ball back through either a block, rebound, steal, or forced turnover. As rebounds are most common way a defense gets the ball back after a stop, Hunter’s importance is mostly by being a great rebounder. He averages 10.5 possessions “won” over 60 defensive possessions.

For the 2024 team, we can consider this table.

Looking at the Points Against Per 60 column, this shows that Hunter (allowing 12.9 per 60) is worse than the other starters save Furphy (13.0 per 60). However, he is better than his backup Parker Braun (15.4). Additionally, only K.J. Adams (7.9) is significantly better than Hunter at disallowing points. Harris and McCullar have been in the middle-of-the-pack.

If we move to the far-right column, we see possession winners per 60. In this case, Hunter is clear-and-away the best at getting the ball back following a miss or through a forced turnover.

When some think of defense, they mostly consider the first aspect of this, or on-ball defense. And this aspect is very important. Not getting beat, not fouling, closing out on shooters, forcing a player to pick up his dribble and pass, etc. are all ways a defender can make it more difficult for the opponent to score. But the second aspect, or coming away with the ball, is also important. First-shot defense that doesn’t win the ball back will lead to second and third chances that can allow points. A player who might not be a great first-shot defender can still add value if he prevents opponents from getting second-chances. So, we need a way to combine these elements of defense into one number that estimates player value.

Using theory regarding the relationship to points and possession in basketball, we can calculate how valuable these defensive metrics are. We will now include the defensive value metric in the final column of the table.

This final column estimates, in points per game, how valuable a certain defender is when compared to a replacement (bubble-level) player. Due to his stingy on ball-defense, K.J. has graded out as KU’s best overall defender. But the second-best defender has been Hunter Dickinson–not because he is always great at disallowing points–but because he limits teams’ second-chances. Imagine KU without Hunter on the floor. Teams would get many more baskets through second-chance opportunities.

This is common among bigs in today’s game. The prevailing offensive strategy involves getting opposing 5-men away from the basket (to clear driving lanes and cutting angles). As Hunter is involved in ball-screen defense and plays on the perimeter at times while on defense, he is often put in situations where he can find himself out of position. This leads to breakdowns, rotations, and open shots for opponents. But this isn’t always what happens. Other times he defends fine, and the possession ends with a missed shot that he has a great chance of rebounding due to his height and good rebounding technique.

We can break down the defensive value provided by 2024’s roster further, using 3 categories and a Per 100 possession basis. These three categories are: Stinginess (or points allowed), Pressure (forced turnovers/steals), and Boards (rebounds).

Hunter’s Stinginess score is below-bubble, but at -0.65 points we estimate that it only costs KU less than a point per 100 possessions. His Pressure (+0.34) and Boards (+2.93) make up for it, leading him to be a +2.63 player over 100 possessions. This is nearly 4 points better than his backup, Parker Braun has been. He is also better defensively than all other players save K.J. Far from being a liability, Hunt’s been a valuable asset for the 2024 defense.

We can also compare Hunter to 5-men of past seasons. Below is a table of all players labeled center who’ve played 10% of minutes on the season or more since 2018. This includes 9 player-seasons.

Here we see a pattern. 8 of the 9 centers on this list have negative Stinginess value, showing that they are allowing points more often than the average defender. This makes sense. Teams are attacking the slowness of the big men to find an advantage that leads to points. However, once we move right, we see that the 5-men can Pressure and Board better than average. So while your guards are likely to be better at preventing open shots, they struggle to get the ball back. Hunter’s rebounding better than any recent center not named Udoka. Additionally, his overall defense is 3rd best out of 9 centers since 2018, again only behind 2019 and 2020 Azubuike.

We can expand this more, just with less detail. Since 1993, there have been 192 players who have played at least 40% of the team’s minutes during the season. Of this 192, only 45 have had a per game defensive value as good as Hunter’s having this year. He’s objectively around the 76th percentile of defensive players in recent Kansas history. Ignore people who don’t know how to track defensive value and fail to consider all relevant factors of defense.

In addition to tracking individual defense, we can confirm these general findings by looking at proxy metrics. One such metric would be points in the paint. This season, for reference, KU’s offense is averaging 40.1 points per game from paint scoring. That’s what a good offense does. A large chunk of this is from Hunter (although K.J. and Kevin are also doing well at the rim). So let’s use KU’s offense as a comparison to KU’s defense. The thought would be that if Hunter’s offensive-value is being wiped away by poor defense, then KU will be allowing nearly as many points in the paint as it is scoring.

This isn’t the case at all. KU is only averaging 25.8 points per game in the paint. This is a difference of 14.3 points, which is more than the overall point difference (10.9). KU is winning points in the paint but losing in all other areas (that is FT’s + 3’s + 2’s outside the lane). This is just further confirmation of Hunter’s value.