2013 Kansas Jayhawks

The 2013 Kansas Jayhawks finished with a record of 31-6 (14-4), winning the Big 12 Regular Season and Conference Tournament. The team earned a 1-seed in the NCAA Tournament, reaching the Sweet 16 before losing. The team’s Sports Reference link is here.

Offense
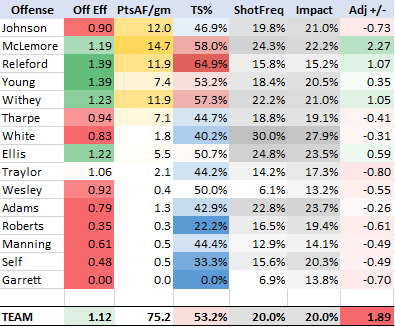
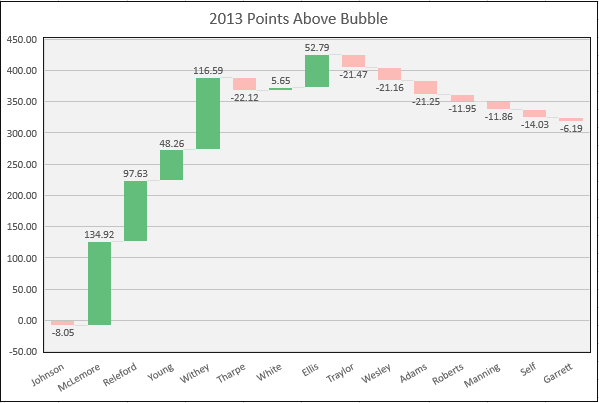
Losing leading scorers Thomas Robinson and Tyshawn Taylor from the prior year, the 2013 offense struggled compared to other Jayhawk teams. Redshirt freshman Ben McLemore was KU’s most talented scorer, contributing 14.7 points of offense per game while shooting a nice percentage on good volume. He was the only Jayhawk who provided over 2 points of value on offense for the season.

Seniors Travis Releford and Jeff Withey had solid offensive seasons, with Releford contributing an excellent 1.39 Offensive Efficiency at the wing position. Both Perry Ellis and Kevin Young were complimentary offensive players as well. Senior PG Elijah Johnson’s poor offensive season was due primarily to poor shooting.

Defense
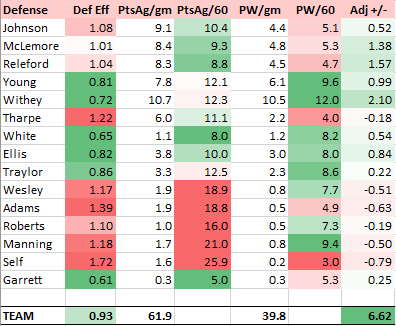
The 2013 team was very defensive-oriented. In fact, of its top-9 players, only Naadir Tharpe failed to provide above-bubble value. The defense was anchored inside by Jeff Withey who finished with a defensive score above +2.00 for the second straight season. Ben McLemore’s defense was underrated, as he graded out as a near-peer defender to senior Travis Releford. The 2013 team was Bill Self’s 8th consecutive team to reach a defensive Adj. +/- score of +5.00 or better, a mark that only 2 KU defenses have reached since (2016, 2020). The 2013 team was a classic, early Bill Self team that hung its hat on defense.

Adj. PPG +/-
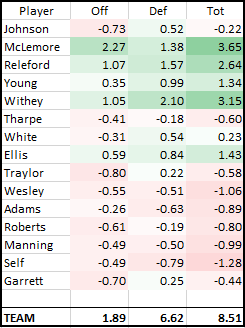
Ben McLemore was KU’s most valuable player in 2013, followed by Jeff Withey and Travis Releford. The team had nice balance with Young and Ellis also providing over +1.00 of value per game. The PG position was the team’s weakness, with Elijah Johnson battling injury all year and Naadir Tharpe struggling in moments. The TEAM score of +8.51 is actually a full point below KU’s average score since 1997. What’s amazing is that this team was still good enough to earn a 1 seed. The veteran play from its four seniors won it many close games.
Season Memories:

The 2013 team had multiple nice wins. Going into Columbus and beating a good Ohio State team for the third-straight time over the past two seasons. Smoking K-State by 21 after going through a rough three-game losing streak. But most memorable for this team are its two regular season wins against Iowa State. The first was in Allen Fieldhouse, when Ben McLemore banked in a 3 with 2 seconds left to send the game to overtime. He would torch the nets in the extra session as well, finishing with 33 points on 6-6 3’s for the game to lead the Jayhawks to victory.

The other Iowa State game will always be remembered as the “Elijah game.” With the Jayhawks needing a miracle to win in Ames, Johnson hit big shot after big shot to get the game to overtime, where he would then win it single-handedly. Johnson finished with 39 points and had a season-high game score of +19.78.

These moments proved to be huge for a Kansas program looking to extend its Big 12 Conference Title streak. KU would go on to share the regular season crown with K-State as each team had 14-4 records, though KU won both regular season meetings. In the conference tournament, KU would establish itself as the best team in the league by beating K-State for a third time in three tries, taking home the tournament trophy.
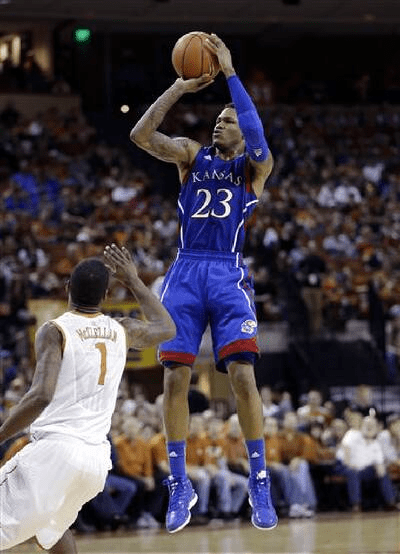
Stud frosh Ben McLemore shot 42% from 3 on the season
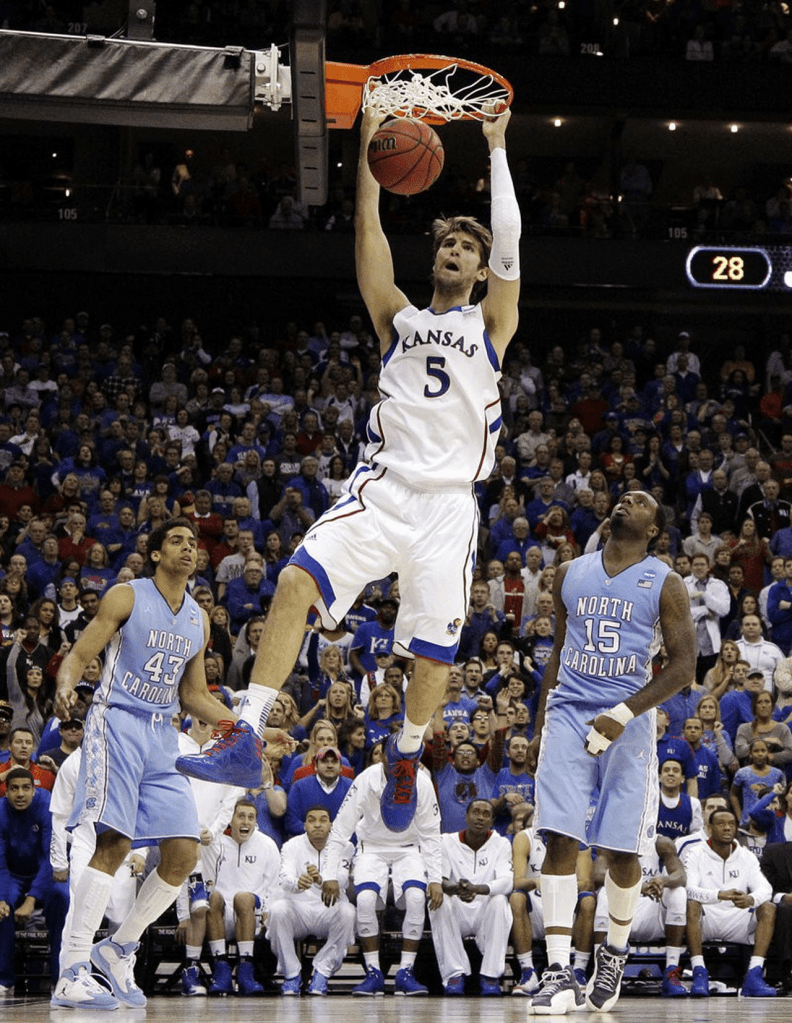
Jeff Withey spurred a huge second-half comeback in the Sprint Center to advance KU to the Sweet 16

Information Availability Analysis for 2013 season

Charting the Hawks looks to estimate player value for Kansas Jayhawks teams and players by using as much information as is publicly available. In order to get the most accurate player value data, game video must be available. For seasons past, this isn’t always possible for each game KU has played. When a certain game isn’t available to watch, supplemental information is used (play-by-play data, video replay highlights, scouting videos, radio coverage, box score info, postgame write-ups, game-feed discussions, etc.). This supplemental information allows for a better estimates, which can be amended whenever better information comes available. However, this necessarily means that each season has different amounts of info which can be used. More recent seasons have every play (or 99.9% of plays) on video. These estimates are the best. The further we go back, generally there are fewer games available for rewatch and less supplemental info.

To account for this discrepancy, CtH has a system which can analyze how complete the info is for a given season. This scale is set to 100%, with 100% meaning that each available possession during the season was watched on video. If no games were on video and the only information that was available were box scores, we would have an estimate of around 67%. This means that box score data can get us player value estimates that are about 2/3 as good as having each game. Thus the range of options for a given game, going back from the mid-90’s to today, tends to be around 67% to 100%, again with that number more likely to be closer to the high end the nearer to the present we are.

For the 2013 Kansas Jayhawks season, the info availability scores are:
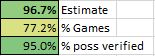
The Estimate number best estimates the average accuracy of each possession over the course of the season. For plays that weren’t able to be recorded (such as defensive points allowed), an educated guess is used, divided among the players in the game. There is a scale which determines how certain we are of player-value for that possession. At 96.7%, we have good confidence that the 2013 player value scores listed above are accurate to within a small range. With more information, the player value scores would change, but probably not by much.

The % Games shows the number of full games that were available to watch for that season during the time CtH was charting these games for player value. At 77.2%, this means that 28 of the 37 KU games for the 2013 were available. Thanks to those who upload archived games, whether on YouTube or elsewhere.

The % Poss verified number looks at all possessions, and counts only the ones that were recorded either through video or through a play-by-play transcript. While play-by-plays aren’t 100% accurate, they are mostly reliable and excellent supplemental information to use. They are missing a few important player value components, most notably defensive points allowed, but for offensive stats and rebounding/steals, they help make things more accurate. At 95.0%, only 1 possession out of 20 is below a 90% confidence level of estimating player-value.

In summary, the take-away is this. For the 2013 player value numbers, resubmitted below, there is a high confidence level that these values are within +/- 0.25 points per game. The info availability for 2013 is quite good, and while the true CtH player value would be somewhat different if we had 100% info availability through all possessions being on video when charted, there wouldn’t be much change in all likelihood. Note this doesn’t say anything about the CtH system itself. So even at 100% info availability, these numbers would still best be considered quantitative estimates of player value.
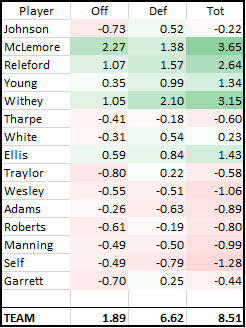
The 2013 Kansas Jayhawks player value table. At Adjusted PPG +/-, Ben McLemore is considered to be +3.65 points better per game than a bubble-level replacement would be at his position and minutes. This value score is an estimate, but one that is backed up by a solid amount of information (96.7%) and a logically-based system that seeks to balance all elements of a basketball game in order to show one value-score.
2014 Kansas Jayhawks

The 2014 Kansas Jayhawks finished with a record of 25-10 (14-4), winning the Big 12 Regular Season. The team earned a 2-seed in the NCAA Tournament, reaching the Round of 32 before losing. The team’s Sports Reference link is here.

Offense:

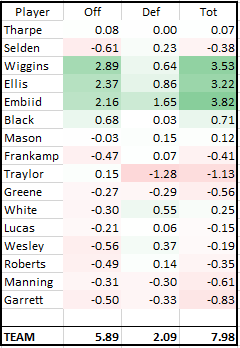
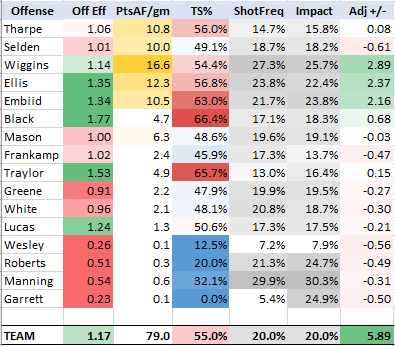
Andrew Wiggins led the Jayhawks’ offense in 2014, accounting for 16.6 points per game on 54.5% true shooting. He was joined by strong interior scoring from Perry Ellis and Joel Embiid. KU was a strong interior team this year, as both Tarik Black and Jamari Traylor also had positive value seasons in the interior. KU’s five starters all produced over 10 points a game. Naadir Tharpe shot the ball well on a limited frequency. The two biggest offensive letdowns were off-ball freshmen guards in Wayne Selden and Conner Frankamp.

Defense:

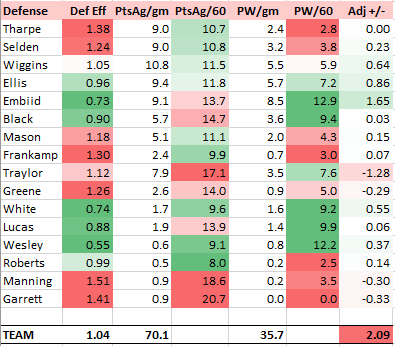
The team’s defense was Coach Self’s weakest to this point while at Kansas. The best defender was Joel Embiid, an excellent shot blocker and rebounder. Both Perry Ellis and Andrew Wiggins played good enough defense, but what was most disappointing was the effort from role players on the roster. KU didn’t need guys like Naadir Tharpe or Jamari Traylor to focus on scoring. They both should have done better on this end.

Adj. PPG +/-

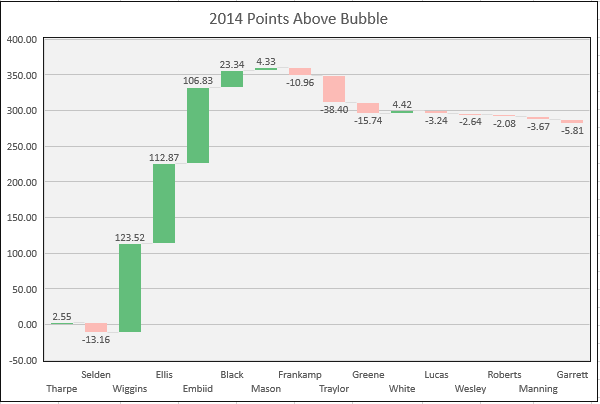
Kansas was led by three star players; Embiid, Wiggins, and Ellis. Two of these three would be top-three picks in the 2014 NBA draft, and Ellis would go on to have an excellent college career. The guard play was noticeably mediocre. Starting PG Naadir Tharpe had some excellent shooting games in 2014, but also had down games as well. His average score was right at bubble-level. Tharpe would be benched during the tournament due to poor play, and his two replacements in Frank Mason and Conner Frankamp would go on to post slightly-above and slightly-below replacement seasons. Wayne Selden would also produce a below-value season as a freshman.

The TEAM’s offense-defense value-difference of +3.80 (meaning its offense was 3.80 points better relative to its offense) was the widest offense-dominant team that Self had to this point (2017, 2018, and 2022 would all be wider). This was likely due to a prominent number of skilled scorers and large number of underclassmen who hadn’t learned to defend yet.

Two Lottery Freshmen, Two Value Leaders

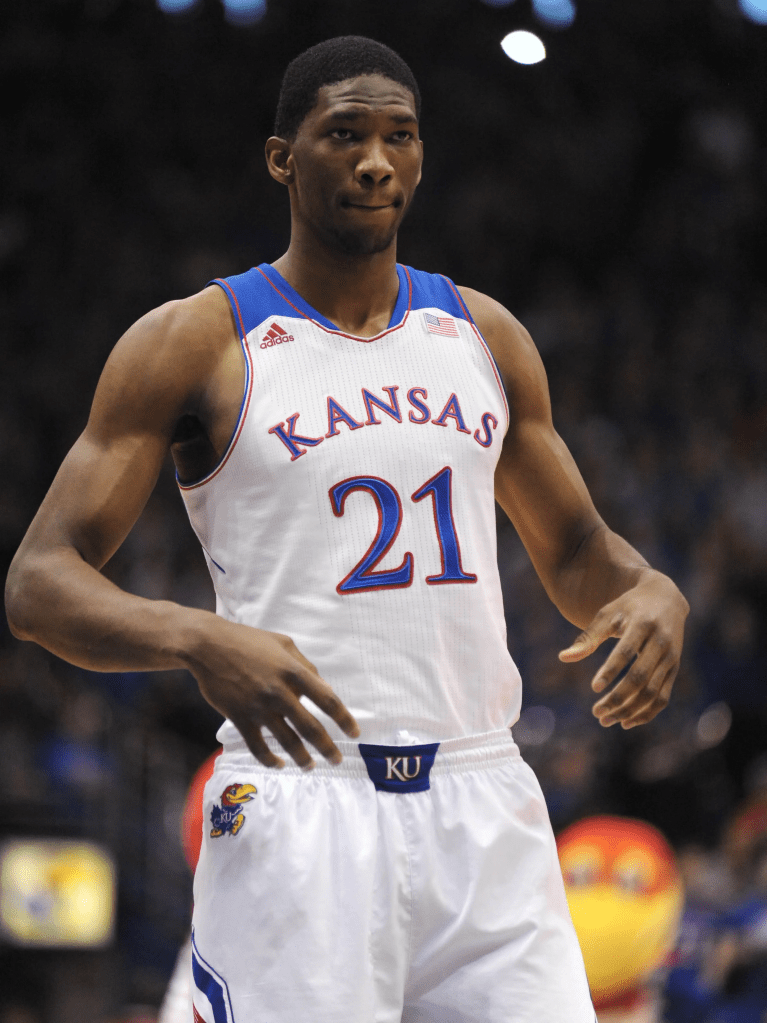
Joel Embiid was KU’s most valuable player on a per-game basis, thanks to his efficient scoring and strong interior defense. He added positive, above-bubble value in 22 of the 28 games he played in (78.6%). His best game in a Jayhawk uniform was against New Mexico in the Sprint Center.

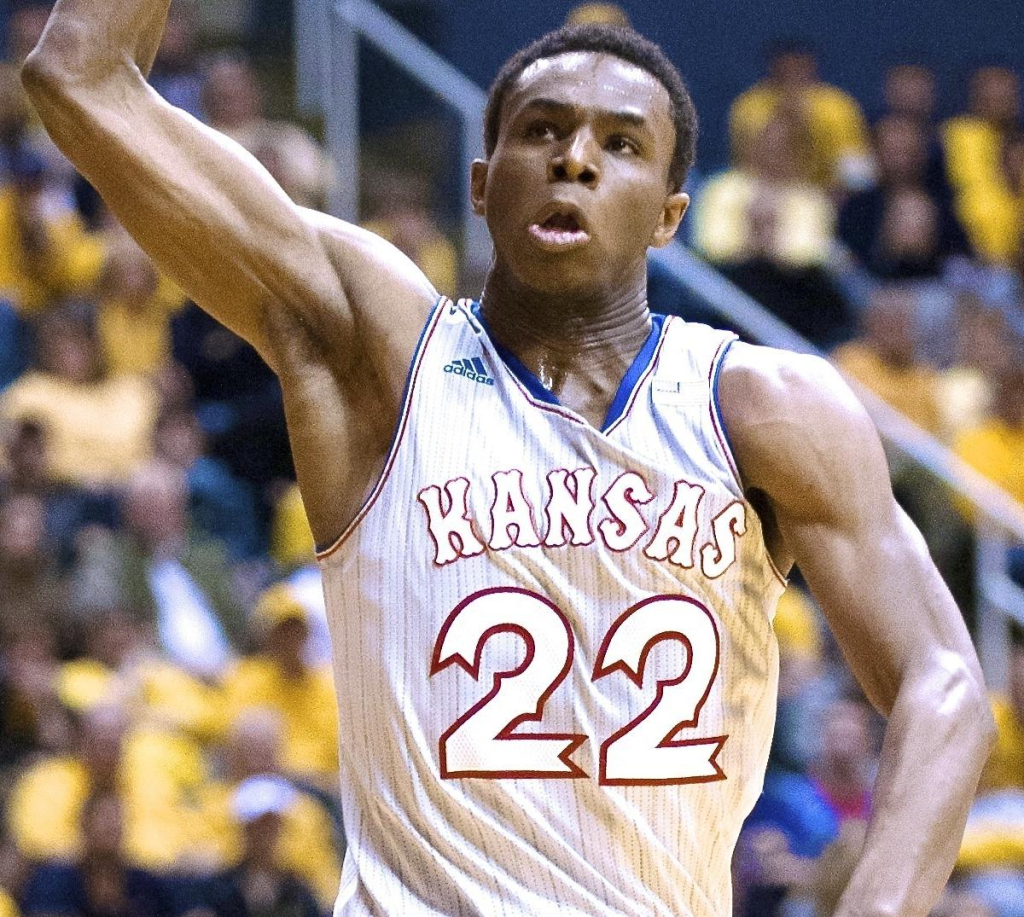
However, Andrew Wiggins was more durable. He played in all 35 of Kansas’ games, providing the most value from a total perspective. He also had the best game of any Jayhawk in the 2014 season, posting a +18.83 value score in his 41-point performance against West Virginia in Morgantown in the final regular season game of the season. Wiggins would also lead the team with 11 game MVPs.

The 2014 team in retrospective:

The 2014 team came in with a lot of hype, and although it wasn’t to live up to it, it’s two best prospects were. The negatives are obvious. Not getting past the first weekend. Poor guard play. Double-digit losses. But on the flip side, this team extended the conference-title streak to 10. When healthy, the team was very tough to beat. It had incredible depth and a number of guys who might have been overlooked during this season would go on to have great careers at Kansas.

WAR rankings. Here are the Wins Above Replacement for the 2014 season:

  • Andrew Wiggins +5.08
  • Perry Ellis +4.54
  • Joel Embiid +3.92
  • Naadir Tharpe +1.45
  • Tarik Black +1.27
  • Wayne Selden +1.04
  • Frank Mason +0.91
  • Andrew White +0.28
  • Landen Lucas +0.06
  • Conner Frankamp 0.00
  • Justin Wesley -0.03
  • Niko Roberts -0.04
  • Evan Manning -0.09
  • Christian Garrett -0.15
  • Brannen Greene -0.20
  • Jamari Traylor -0.33

NCAA Tournament:

The 2014 team earned a 2-seed and drew 15-seed Eastern Kentucky in a closer-than-expected game. In the end, KU turned to the effort and energy of Jamari Traylor to win the game down the stretch. Traylor would go for 17 and 14, adding 6.29 points of value above bubble for the game in his only team-MVP game of the year. This game is sometimes overlooked, but it was good to win because of how bad of a loss it would have been. Unfortunately, Kansas didn’t play well in its next game as it would fall to 10-seed Stanford.

2015 Kansas Jayhawks

The 2015 Kansas Jayhawks finished with a record of 27-9 (13-5), winning the Big 12 Regular Season. The team earned a 2-seed in the NCAA Tournament, reaching the Round of 32 before losing. The team’s Sports Reference link is here.

Offense

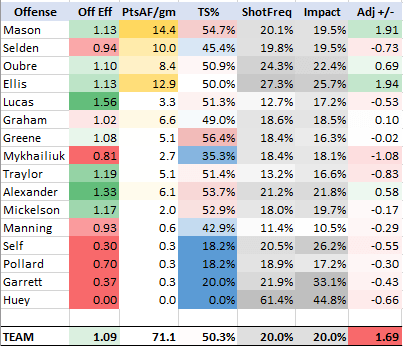
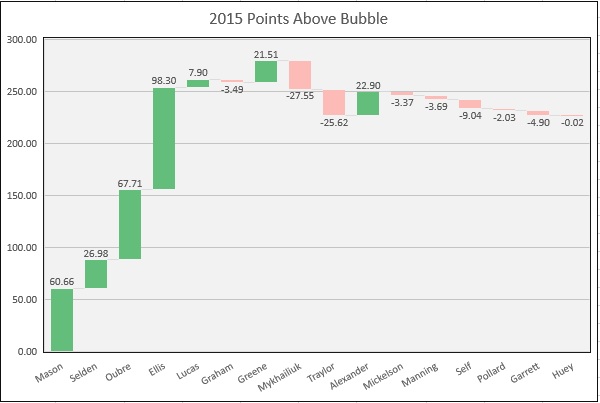
The 2015 Offense struggled to score, producing only about 1.69 points per game above a bubble offense. Both Frank Mason and Perry Ellis were solid contributors, each just a shade under +2.00. Freshmen Kelly Oubre and Cliff Alexander will likewise positive on the offensive end of things. Aside from that, players were either bubble-level or worse.

Defense

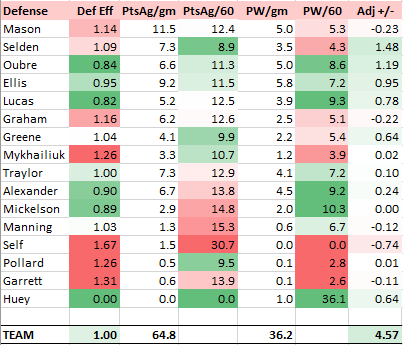
The 2015 Defense was the better side for Kansas, ranking 9th in KenPom adjusted defensive efficiency. Wayne Selden graded out as KU’s strongest defender, allowing only 9.0 points per 60 possessions. Both Kelly Oubre and Perry Ellis were also above 1.00 PPGAB in defensive value. The defense didn’t have a weak spots opponents could exploit, although the younger guards (Mason, Graham) would improve on this end as their careers developed.

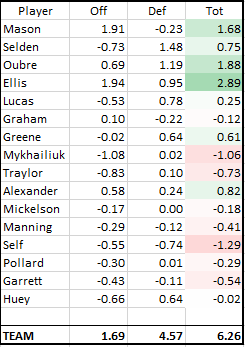
Perry Ellis was the team’s most valuable player in 2015, averaging over 3.00 PPGAB in value before his knee injury (he would struggle for the first few games when he returned, which dropped him to the final PPGAB mark he’s showing). Despite a slow start to the season, Kelly Oubre added nearly 2.00 PPGAB in value, with sophomore PG Frank Mason not far behind. Wayne Selden, Cliff Alexander, Brannen Greene, and Landen Lucas were other players with positive impact on the season.

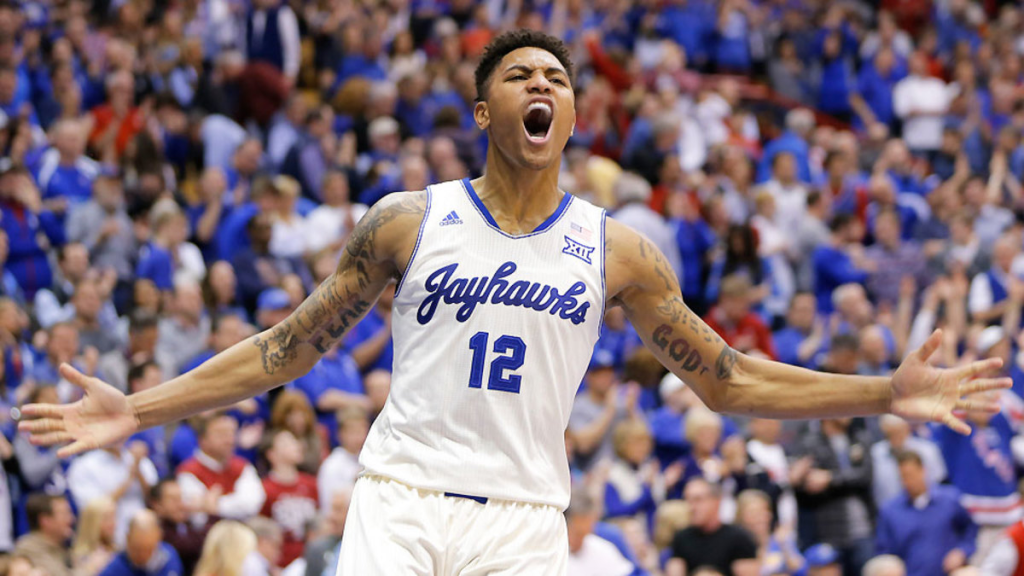
Kelly Oubre and the 2015 Jayhawks went undefeated at Allen Fieldhouse (15-0).

KU had a nice rotation for much of 2015, but this got weaker after Cliff Alexander was held out and Perry Ellis suffered his knee injury.

Data Fulfillment

For the 2015 season, 23/36 games were able to be watched in their entirety. The other 13 games were charted using video highlights, radio broadcasts, play-by-play box score information, and other sources to most accurately record what happened. This led to a Coverage score of 96.93%, which is very good. Over 71.2% of the season’s plays were available on video, with 95.5% of all possessions having at least a 90% confidence rating.

What this indicates is that the value-stat estimates from this season are not prone to much data-absence error. These value scores aren’t likely to be too far off what they would be had we the entire season, since only a small percentage of overall possessions are in question.

2021 Recap

The final 2021 stats have been published. Below is a brief look at the value provided by this season’s roster. Note that the assessments are in relation to a KU-level talent for how they performed this season. It is not a prediction on what they will be later in their careers.

2021 Value Scores

STARTERS

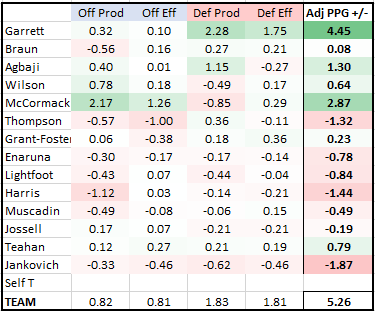
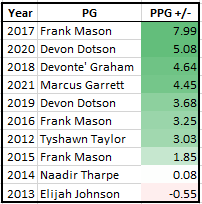
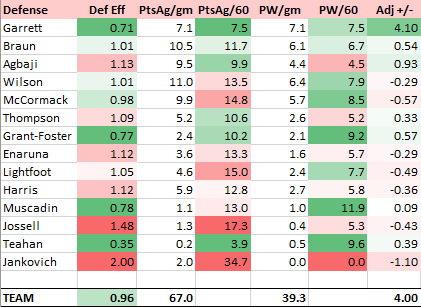
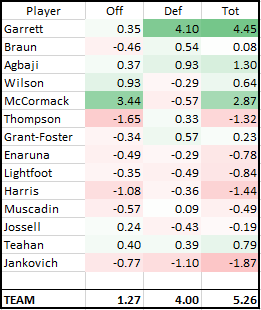
Marcus Garrett led the team with a +4.45 score. He provided the most-valuable defensive season on record (20 seasons) with a +4.03 Def PPG +/- score. The scores confirm what the eye-test tells us, Garrett’s defense was outstanding. Additionally, Garrett provided +0.42 value on offense. Not great, but above replacement-level. Since 2012, Garrett was KU’s fourth-best starting point guard, and not too far below Devonte’ Graham’s 2018 season.

KU PG’s over past 10 seasons

KU has been spoiled with outstanding PG’s in recent years. Don’t blame Garrett for having to play out of position in 2021, blame those around him for not elevating their games. Assessment: KU-level star (A+).

Christian Braun finished barely in the green, with a +0.08 score. He had some excellent games but was an inconsistent shooter. He also had trouble generating his own offense, so he was the least productive starter on offense. His defense was not bad, but not great either. He is a good rebounder for a guard, and an okay on-ball defender. Looking at his total value, he likely doesn’t start most seasons at KU. But he was still the team’s fifth-best player, and will be a vital piece moving forward should he improve like most KU players do who return for a third season. Assessment: KU-level reserve (C).

Ochai Agbaji was the team’s leading scorer at 14.1 ppg, and finished with a +1.30 score. His offensive efficiency declined throughout the season, and he didn’t grab many rebounds or steals on defense either. Still, he did a good job of outscoring his man, and he graded out as the team’s second-best defender. I don’t see him being anywhere near an NBA-level talent yet. His junior season was a clear jump over his underclass years, but he still has room to grow as a player. Assessment: KU-level starter most years (B-).

Jalen Wilson finished with a score of +0.64, with his value coming on the offensive side of the ball. At times he was a very good scorer, and his rebounding skill made KU less of a “small ball” team than was predicted. His defense was poor, particularly when he was in a mismatch against a quicker player. If he can improve his shooting and on-ball defense, he can be a very good college player. Assessment: KU-level reserve (C+).

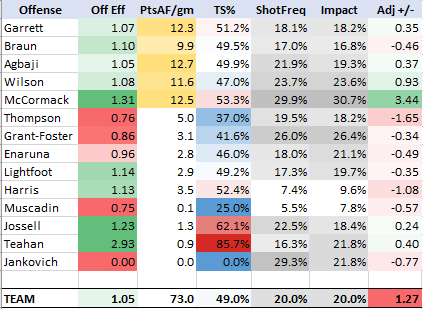
David McCormack had a dominant offensive portion of the schedule, which elevated him to a +2.87 score. He graded out as a better offensive weapon than Doke last season due to his production, free throw shooting, and ability to take care of the ball while playing against a tougher schedule. He was a versatile scorer. McCormack’s defense, while better than his underclass years, was nevertheless quite poor. He struggled against versatile players whether underneath or (especially) on the perimeter. Assessment: KU-level starter (A-).

ROTATION BENCH PLAYERS

Bryce Thompson finished his freshman season at -1.32. This is actually far more respectable than how he played at the beginning of the season. Thompson’s offense was the worst on the team, and he never outscored the 12 points he put up against Gonzaga in the first game of the season. His defense was slightly positive, and he showed flashes of the talent that brought him to Kansas. I don’t doubt he can improve. Assessment: Not KU-level (D-).

Tyon Grant-Foster was the only rotation bench guy to have a positive score, at +0.23. He was not an efficient offensive player, which hurt his minutes. But he defended, rebounded, and made the occasional athletic play when he was in the game. He should have been given more minutes given what he did do. His lack of minutes will end up hurting his grade, as we don’t know if he would have been able to maintain his value playing more minutes. Assessment: KU-level reserve (C-).

Tristan Enaruna did perform slightly better than last season, but across the board he was negative on all categories. His total score was -0.78. He did some things well, but he was a bit soft on both ends of the court. Assessment: Not KU-level (D).

Mitch Lightfoot did not put up a score as high as he should have, given his status as a 5th year senior. He finished at -0.84. His minutes were mostly due to KU not having a viable back-up at the 5, unlike in years past. His inability to develop offensively is surprising, given how athletic he is and how competent his shot looks. Assessment: Not KU-level (D).

Dejuan Harris made many nice plays last season, but also wasn’t much of an offensive factor. This is why his score was so low at -1.44. Harris has a nice game; he takes care of the ball, sees the floor well, can make an open shot. He needs to improve his scoring and on-ball defense. Assessment: Not KU-level (D-).

DEEP BENCH PLAYERS

Gethro Muscadin didn’t see the court much, and when he did he showed how his size could be of value but not much of his skill. His score was -0.49 while only playing 2.7% of possible minutes. With him transferring out, there’s not much else to say. Assessment: Not KU-level (N/A).

Latrell Jossell also didn’t play much, but his quickness and ball-skill weren’t bad. He is undersized, so might have trouble defending should he get more minutes. His score of -0.19 included some deep jump-shots, showing range. Assessment: Undetermined (N/A).

Chris Teahan was money, and had a score of +0.79 thanks to multiple made shots and decent defense. He could have played 5-10 minutes against most opponents and been fine. Assessment: KU-level walk-on (N/A).

Michael Jankovich was injured for most of the season and played in one game (USC), finishing with a score of -1.87. Assessment: KU-level walk-on (N/A).

To reiterate, the assessments and grades relate to the 2021 season only, and are not a reflection of the player’s potential or a prediction of the player’s value moving forward. Before next season, a prediction of the 2022 season will be published, using players’ historic numbers and historic trends of player improvement over the years.

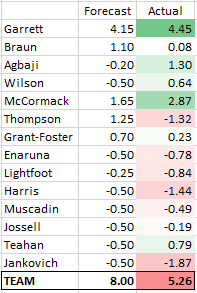
Having said that, let’s take a look at how close this season’s forecasted Value scores (Adj PPG +/-) were to the actual results. Note that the forecasted numbers weren’t published before now, so you’ll just have to trust these predictions were made before the season:

2021 Player Forecasts vs. Actual PPG +/- scores

The sum of the five starters exceeded their collective forecast by around 3 ppg. Looking back, it is easy to see I should have flipped Braun and Agbaji. In 2020, however, Braun was nearly a full point better than Agbaji, who had a poor season as a sophomore. Agbaji’s sophomore to junior jump was impressive even if we want more out of Och. Wilson was a nice surprise, and McCormack elevated his offensive production as the team’s main interior scorer. KU’s five starters weren’t the problem.

The bench was a major disappointment. Thompson’s forecast was ridiculously off in a bad way, but it was a prediction made after believing much of the hype around him. To a similar extent, this happened on Tyon Grant-Foster. Lightfoot not improving from 2019 was discouraging, and the rest of the bench was tough to predict. Part of Harris’ low score was him getting more minutes than expected. Either way, not a single bench player was able to consistently produce at a level that should warrant considerable time on the floor in a Kansas uniform.

Looking at the team score, the team underperformed what I thought it was capable of. However, the initial form of this team included Silvio De Sousa. De Sousa was a good interior defender in 2020, so his place on the roster would have helped the team immensely on that end. As much as I’d like to predict the 2022 team right now, we’ll let the roster finalize and make forecasts in the fall. There are many moving pieces at the current stage.

Season Stats: Interpretation

Below is a summary of how to interpret the stats published on this website. These stats will differ from the ones traditionally offered.

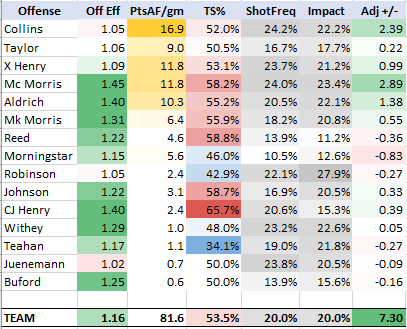
We will use the 2010 season numbers as a guide. Below are the offensive stats for the 2010 team.

2010 Offense

First, let’s start with how the players are sorted. The primary starting five are the first five listed, from point guard to center, 1-5. From here, bench players are listed in order of importance, with the sixth man listed sixth, seventh man listed seventh, and so on until the walk-ons are at the bottom.

Next, let’s look at Offensive Efficiency. Each player’s individual efficiency is calculated, as well as the team’s, and is shown as points per possession (used). For instance if a player produces 110 points and uses 100 possessions, his Off Eff is 1.10. Clearly, higher is better. The color formatting from red to green (bad to good) reflects the efficiency of what a replacement-level KU rotation player should show at average usage. For 2010, most of the team shows green or very faint colors because the team was well-above replacement level offensively.

The third column is Points Accounted For per game. This stat accounts for all plays in which a player creates points: the player scoring unassisted, the player scoring from an assist, as well as the player assisting a teammate’s score. Senior PG Sherron Collins led the team by accounting for 16.9 points per game, which was north of the 15.5 points per game he scored. Guards which tend to create more scoring opportunities–for themselves and others–produce more points for the team than what they actually score. In contrast, some wings and post men score a large portion of their points by finishing plays set up by others, so their PtsAF/gm numbers tend to be less than what their points scored per game is. The nice thing about this stat is that it combines points and assists into one number.

The fourth column is True Shooting Percentage. TS% is calculated by other sources, but the calculation here takes into account that assisted baskets are (or should be) easier to convert than unassisted baskets. It is takes into account actual possessions used on shots (instead of estimating them). This number won’t differ much from other sources, but it should more accurately reflect what occurred when the player shot the ball. The color formatting is from blue (cold) to red (hot). 50% is set as the neutral mark for formatting. Guard C.J. Henry led the team in this stat.

The fifth column is Shot Frequency, which looks at how often that player shot the ball while he was on the floor. The darker the gray is, the more frequent that player took the shot in comparison to his teammates. Looking down the list, one can see that KU relied more heavily on Collins, Marcus Morris, and Xavier Henry to take shots. With five players on the court at once, the average ShotFreq is exactly 20.0%.

The sixth column is similar to the last, and is called Offensive Impact. First, let’s confirm firm that the average Impact number is 20.0% for the same reason as above. But what exactly is Offensive Impact? As the name implies, it looks at how large each player’s impact was on the offensive end in comparison to his teammates. Knowledgeable fans will know what offensive usage is, and this stat is similar. However, Impact uses offensive rebounds differently. Instead of ignoring offensive rebounds or using them against offensive usage, we include them in calculating Impact just as we would a shot. Last, note that this stat and the one above aren’t a measure of value. In other words, Impact calculates all offensive plays–good and bad–that a player has during his minutes. Freshman Thomas Robinson was KU’s most impactful offensive player (28.0%) on a per possession basis, even though he graded out as a negative offensive value player.

The final column is Adjusted PPG +/-, or the value score for each player on the offensive end. This number includes all the information from the previous categories and puts it together in a way that balances offensive production and efficiency. It is also schedule-adjusted to account for the relative strength of opponents. Marcus Morris led the team in this category for 2010 at +2.89. Looking back at earlier columns, we can see he is at or near the top of each offensive stat. The +2.89 number means that he was 2.89 points per game better on offense than a KU-level replacement player at his position. The team score of +7.30 is also very good.

2010 Defense

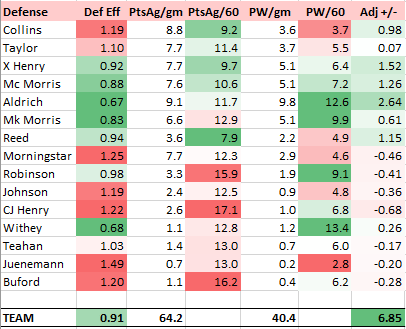
The Defensive stats published on this website far exceed what an official box score can provide. The primary difference is that each point scored by the opponent is counted against the KU defender who was most responsible. This will be explained further below, but it allows us to better grade individual defense instead of having to guess each player’s defensive impact, as other advanced statistical models do.

The Defensive Efficiency column is like its offensive counterpart…points allowed divided by possessions won. The color formatting is inverse offense, with higher numbers being worse. To explain another way, take a look at Sherron Collins’ 1.19 score. This is saying that for every defensive possession that Collins was responsible for, his opponent scored 1.19 points. Def Eff will be tend to be better among big men who grab far more rebounds than small guards.

The next two columns are similar, Points Against per game and Points against per 60 possessions. These stats are carefully charted by observing game film (among other methods) to assign points allowed by individual defenders. Because of the differing minutes played for each player, the PtsAg/60 offers the best look at scoring defense. The color formatting, from green (good) to red (bad) indicates that Tyrel Reed was the team’s best at not allowing his man to score, followed by Collins and Xavier Henry.

The following two columns are likewise similar to each other, Possessions won per game and Possessions won per 60 possessions. To “win” a possession, a player must rebound, block a shot, steal the ball, or force a turnover so that his team gets the ball back without the other team scoring. As one can see, big men excel at winning possessions. This is primarily through rebounding numbers, although blocked shots and forced turnovers also play a part for big men with active hands.

The final column is Adjusted PPG +/-, or the value score for each player on the defensive end. It takes into account a player’s points allowed along with his possessions won, awarding more value to defensive plays that occurred before a shot (steals, forced turnovers) than those that were the result of a miss (rebounds). It is schedule-adjusted to account for the relative strength of opponents. Cole Aldrich led the team at +2.64, bolstered by his rebounding and shot-blocking prowess. Of note might be the large difference between Tyrel Reed and Brady Morningstar. Reed was an underrated defender; whereas Morningstar was the opposite.

2010 Value Scores

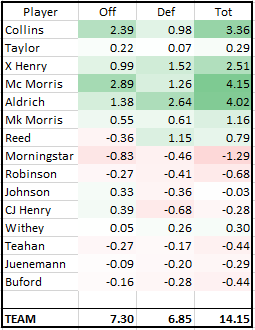
The last box combines the offensive and defensive PPG +/- stats into one total number. 0.00 is replacement level (think 7th or 8th man on a KU roster), someone who doesn’t help his team much but doesn’t hurt their chances either.

For 2010, Marcus Morris led the team with a +4.15 score, although Cole Aldrich at +4.02 was statistically identical. The 2010 had tremendous balance and depth, though the bulk of the value was from the top seven players. The team’s score of +14.15 was the third best since 1993, with only the 2008 and 1997 teams scoring higher.

2021 Kansas Jayhawks

The 2021 Kansas Jayhawks finished with a record of 21-9 (12-6), earning a 3-seed in the NCAA Tournament. They made the Round of 32 before losing. The team’s Sports Reference link is here.

OFFENSE

Looking at the offensive side of the ball for the 2021 team, center David McCormack led the team in nearly every important category. He accounted for the second-most points on a per game basis, and was also the team’s most efficient shooter while taking a large volume of shots. His impact and efficiency were bolstered by strong offensive rebounding rates. When combined, his +3.44 value on the offensive end grades out as a top 20 individual season in the 25-year timespan of 1997-2021. Other starters provided solid offensive seasons in more complimentary roles. Jalen Wilson had multiple 20+ point scoring outings against a difficult schedule, and could make the marginal shot the team needed him to. Ochai Agbaji was the team’s best at finishing a play set by an assist (think lob dunks and kick-out 3’s). Despite playing out of position, Marcus Garrett’s offensive numbers as the leading PG was comfortably above replacement-level. The only negative-value starter on offense was Christian Braun, but on a per possession basis he was still better than each rotation bench player.

DEFENSE

The defensive side of the ball was where the 2021 Jayhawks were more competitive, and this was primarily due to Marcus Garrett’s record-setting season. Not only did he give up a paltry 7.5 points per 60 possessions, he balanced this solid on-ball defense by winning possessions through defensive rebounds, steals, and forced turnovers. The unseen adjustment was that of the average strength of opponent, which in 2021 was the toughest KU has ever faced. Garrett wasn’t shutting down lesser offensive talents, he was doing it against skilled opponents. Other positive-value defenders were Ochai Agabji who played solid on-ball defense, Tyon Grant-Foster who was an excellent rebounder as a wing, Christian Braun who added small but accumulated value from all phases of defense, and Bryce Thompson who defended the perimeter adequately.

Total Adjusted PPG +/-

Marcus Garrett led the team with a +4.45 value score, and each of the other starters proved themselves to be capable KU-level players. Both McCormack and Agbaji made big leaps from the prior season. The newcomers mostly struggled to perform. Only Tyon Grant-Foster produced positive value of rotation non-starters, but his minutes were limited due to inconsistency. Chris Teahan played 18 minutes all season, yet still produced +7.9 points of value over 10 games. While not a large sample size, he played well when called upon.

The team’s offense and defense were both below KU expectation. The defense was Self’s 5th lowest in 18 seasons; the offense was his worst while at KU. Overall the team had the lowest value score of any KU team since 1999, but was comparable to these other teams (2019, 2015, 2004, and 2000). The team was 5-1 in games decided by four points or fewer, which probably helped bump it up a seed line or two.

Kansas 51, USC 85

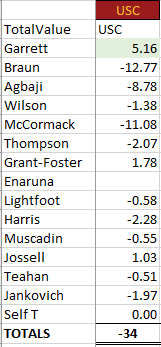
A horrible way to end the season; with Braun, Agbaji, and McCormack having either their worst or second-worst individual games. Some of this was due to USC shooting well, yet much of that was due to poor defense by these starters. USC got whatever shot it wanted.

On the positive side, Tyon Grant-Foster provided instant offense and made some nice defensive plays. Michael Jankovich, in his first minutes of the season, got in the scorebook. Lattrell Jossell got KU over the 50-point mark after getting fouled in transition.

Once again, Marcus Garrett scored team-high honors. He was the only Jayhawk in double-figures with 15 points, and guarded USC’s lottery-pick for much of the contest before succumbing to foul trouble. Even though it was a down defensive game by his standards, Garrett was the only KU starter who did anything well on either end and did so giving up seven inches of height. He is a legitimate player and competitor, one who should be appreciated for the defensive value he provides. If this was his last game as a Jayhawk, it should be noted that he had nothing to do with the final score being what it was.

Kansas 93, Eastern Washington 84

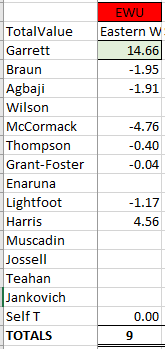
This was a weird game, with EWU using the Groves brothers to generate most of their offense. Basically whoever was guarding the Groves brothers gave up a lot of points. McCormack had an excellent offensive game, but got outscored by Tanner Groves’ career day. Christian Braun started out playing solid defense, but gave up a few 3’s late in the first half. He also had his hand at playing a small-ball 5 during the second half, in which he gave up multiple buckets inside. Ochai Agbaji also had a poor defensive game, particularly early. He got beat on back-cuts and lost his man on more than one occasion. On the flip side, Bryce Thompson balanced out a rough shooting day (1-6 FG’s, all 3’s), with a solid defensive performance. He only gave up 3 points in 19 minutes, and also added 2 defensive rebounds and drew a charge.

But the stars of the game were Dejuan Harris, and primarily Marcus Garrett. Harris chose the right time to score in double-figures, reaching 13 on 5-8 (3-4) FG shooting. He also had 4 assists, 0 TO’s, and 2 steals. He only allowed 9 points while playing 35 minutes. It was his third-best overall game on the season, behind the St. Joe’s and first Texas Tech games.

Garrett had his third consecutive “+” game, or game where his PPG +/- was greater than the team’s margin of victory. KU’s season is likely done without Garrett. He put up 20 points on highly efficient numbers, and only gave up 4 on the defensive end. For the season, he is +4.35 on Adj PPG +/-, a full point higher than David McCormack’s score for best on the team. If this Kansas team is going to make a run over the next few weeks, it will be because Marcus Garrett continues to play at the highest of levels.

2021 NCAA Tournament Program Rankings, continued

East Regional:

1.            Michigan (#13)

16.          Norfolk State (#235)

8.            LSU (#43)

9.            St. Bonaventure (#109)

5.            Colorado (#47)

12.          Georgetown (#17)

4.            Florida State (#56)

13.          UNC Greensboro (#251)

6.            BYU (#61)

11.          UCLA (#3)

3.            Texas (#31)

14.          Abilene Christian (#271)

7.            Connecticut (#8)

10.          Maryland (#28)

2.            Alabama (#79)

15.          Iona (#238)

The East is the region with the most cumulative championships: UCLA (11), Connecticut (4), Maryland (1), Georgetown (1), Michigan (1). However, it also has a handful of other Top 100 teams which have Final 4 appearances; including Texas, LSU, Colorado, and Florida State. BYU and Alabama have never made it past the Elite 8 round, and BYU at #61 is the best program in the tournament which has never made a Final 4.

Sub-100 teams with some tournament success include St. Bonaventure, which did reach the Final 4 in 1970. Norfolk State is at #235, tied with UMBC as they have exact equal tournament history. Each has made two tournaments, earning a #15 seed and #16 seed. And each has won one First Round game, UMBC as a #16 seed and Norfolk as a #15. Should Norfolk win Saturday, it would jump over UMBC. But assuming they don’t, these two programs will remain tied until one or the other makes a future tournament. UNC Greensboro has been to three tournaments and lost Round of 64 games as a #16, #15, and #13 seed. Abilene Christian has made back-to-back tournaments (2019, 2021), and bumped up a seed-line from #15 to #14 in its second go-around.

West Regional:

1.            Gonzaga (#42)

16.          Texas Southern (#255)

8.            Oklahoma (#21)

9.            Missouri (#63)

5.            Creighton (#86)

12.          UC Santa Barbara (#208)

4.            Virginia (#29)

13.          Ohio (#101)

6.            USC (#70)

11.          Drake (#104)

3.            Kansas (#5)

14.          Eastern Washington (#248)

7.            Oregon (#39)

10.          VCU (#96)

2.            Iowa (#40)

15.          Grand Canyon (#293)

Kansas is easily the best program in the West. It has the potential to jump Duke and reach #4, but it would take a Final 4 appearance to do so. Other past title-winners include the NCAA Tourney’s first title winner and the most recent winner, Oregon and Virginia. Oklahoma is the best program in this year’s field to have never won a national championship. A Sweet 16 appearance would elevate it above Kansas State, the team who currently holds this dubious honor.

The region’s top two seeds, Gonzaga and Iowa sit very close. Since 1999, Gonzaga has been the nation’s 9th best program, whereas Iowa was its best as a program in the 80’s and 90’s. Missouri and Creighton are other Top-100 teams which have never made a Final 4, whereas VCU is in the Top 100 solely because of its Final 4 run in 2011. Ohio and Drake look to win a few games to put them into the Top 100. UC Santa Barbara won a First Round game in 1990, but Eastern Washington, Texas Southern, and Grand Canyon are looking for their first Round of 32 appearances. This is Grand Canyon’s first NCAA tournament appearance, but is already at a tie for #293 (out of 324 programs which have qualified for at least one tournament) because it earned a #15 seed. There have been 18 programs which have qualified for at least one NCAA Tournament but earned nothing better than a #16 seed.

College Basketball Team Rankings, beginning in NCAA Tournament era (1939 – present):

The ranking system used below is a mathematically-objective system based around the bracket structure of the NCAA Tournament. The NCAA Tournament is a bracket tournament, in which each successive round has half the teams of the prior round until a champion is crowned (64…32…16…8…4…2…1). The important concept here is that each successive round is twice as difficult to reach. The system awards points to a program based on its tournament success for that season, a team which advances to the Sweet 16 is awarded double the points of a team that only reached the Round of 32 and half the points of a team that makes the Elite 8. Seasons accumulate together, so a team that has a lot of NCAA tournament appearances can build up its program ranking with even a little bit of tournament success.

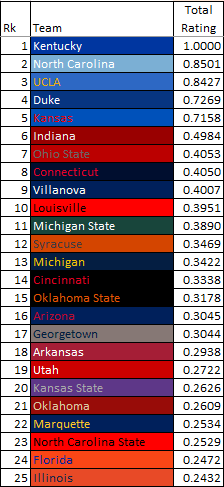
Regular season success is also incorporated in the formula, utilizing seed-line win-expectations as the gauge for how well a team did during the regular season. 2021 regular season scores are included. The standard-bearer with the best NCAA Tournament and regular season success in college basketball since 1939 has been Kentucky, which has a total rating set at 1.00.

Top 25 Programs (1939 – present)

To calculate the relative dominance of one team over another, simply divide Team A’s Total Rating by Total B’s Total Rating. For example, dividing (.7158/.4984) tells us Kansas as a program is 1.44 times better than Indiana as a program from 1939 – present. Although Kansas has fewer NCAA championships (3 vs. 5), it makes up for this by having more runners-up, Final 4’s, Elite 8’s, tournament appearances, better seed-lines, etc.

Below are the program rankings for the 2021 tournament teams in the South and Midwest regionals. West and Midwest Regional rankings will be published after the Round of 64 is set following Thursday night’s play-in games.

South Regional:

  • 1. Baylor (#49)
  • 16. Hartford (#314)
  • 8. North Carolina (#2)
  • 9. Wisconsin (#27)
  • 5. Villanova (#9)
  • 12. Winthrop (#205)
  • 4. Purdue (#33)
  • 13. North Texas (#249)
  • 6. Texas Tech (#66)
  • 11. Utah State (#80)
  • 3. Arkansas (#18)
  • 14. Colgate (#263)
  • 7. Florida (#24)
  • 10. Virginia Tech (#115)
  • 2. Ohio State (#7)
  • 15. Oral Roberts (#155)

The South region has the second-best college basketball program (North Carolina) along with a program making its first tournament appearance (Hartford), and three of the top ten programs of the NCAA Tourney era (Ohio State, Villanova). Baylor is the lowest-rated program of the four #1 seeds, but is still easily in the upper quintile of college basketball programs. Wisconsin and Purdue look to continue climbing, as each is just outside the Top 25. 2019 National runner-up Texas Tech and Utah State are in the Top 100 and looking to climb; while Virginia Tech, Oral Roberts, Winthrop, and North Texas start the tournament outside the Top 100. As an example of how quickly a lower-ranked team could rise if it made a run, North Texas could jump all the way up to #199 if it made the Sweet 16 by winning 2 games this weekend.

North Carolina (6), Villanova (3), Florida (2), Wisconsin (1), Ohio State (1), and Arkansas (1) are national title winners; the South region has the most programs with at least 1 prior NCAA Tournament title of all regions in this year’s bracket.

Midwest Regional:

  • 1. Illinois (#25)
  • 16. Drexel (#218)
  • 8. Loyola Chicago (#74)
  • 9. Georgia Tech (#51)
  • 5. Tennessee (#68)
  • 12. Oregon State (#55)
  • 4. Oklahoma State (#15)
  • 13. Liberty (#216)
  • 6. San Diego State (#125)
  • 11. Syracuse (#12)
  • 3. West Virginia (#38)
  • 14. Morehead State (#135)
  • 7. Clemson (#120)
  • 10. Rutgers (#119)
  • 2. Houston (#32)
  • 15. Cleveland State (#197)

The best program in the Midwest is Syracuse with one national championship, but Oklahoma State is not far behind with its two titles. Loyola Chicago is the third team from this region to have a national title, and is the most recent Final 4 team in the region.

The string of years from 2003 to 2005 were good to teams in this region. Illinois was national runners-up in 2005, Georgia Tech defeated Oklahoma State in the 2004 Final 4 in its runner-up season, and the prior-mentioned Syracuse Orangemen won in 2003. Houston has also competed for a title, in fact two of them, but came up empty in both championship game appearances. West Virginia’s best appearance is a national runner-up as well. Surprise Pac-12 winner Oregon State has made two Final 4’s. Tennessee has underperformed its seed-lines in the NCAA tournament, having made only one Elite 8. The winner of the Rutgers/Clemson game has a chance to crack the Top 100 with a Final 4 run. Morehead State is in its eighth NCAAs, and Cleveland State has gone 3-2 in its prior two tournaments (as a 13 and 14-seed), making it unbeaten in the First Round. Liberty and Drexel would also jump multiple spots with a win on Friday.