
The Kansas Jayhawks statistics pages have been published for seasons 2006 through 2026.
2026 2025 2024 2023 2022 2021 2020 2019 2018 2017 2016 2015 2014 2013 2012 2011 2010 2009 2008 2007 2006
The 2016 Kansas Jayhawks finished with a record of 33-5 (15-3), winning the Big 12 Regular Season and Conference Tournament. The team earned a 1-seed in the NCAA Tournament, reaching the Elite 8 before losing. The team’s Sports Reference link is here.
/cdn.vox-cdn.com/uploads/chorus_image/image/57217787/516200186.0.jpg)
OFFENSE
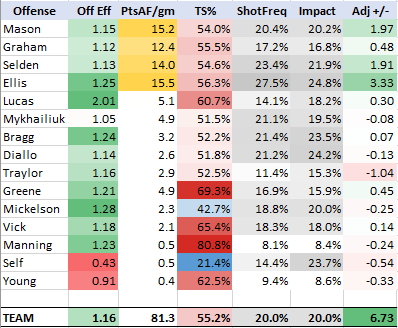
Senior Perry Ellis was the team’s leading scorer, combining high efficiency with a high shot frequency. He was followed by Frank Mason, the leading assist-man but also a good scorer in his own right. Wayne Selden also added nearly 2 points of offensive value above replacement. Devonte’ Graham was the team’s fourth most valuable offensive player. Close behind him was Brannen Greene, who shot an incredible percentage (49% from 3, 62% from 2, 84% from FT) in limited minutes. The +6.73 value score the team produced was the best a Bill Self offense had to that time.
DEFENSE
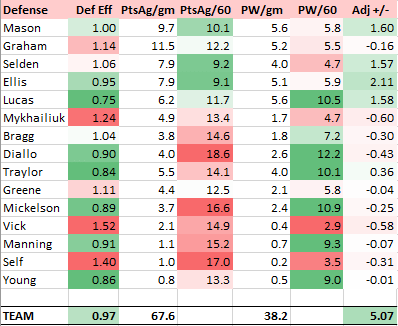
Perry Ellis was also the team’s most valuable defender in 2016. In allowing 9.0 points per 60 possessions, he defended his man better than others did. His rebounding numbers and shot blocking numbers were low for a 4-man. Landen Lucas did have great rebounding numbers, and also didn’t give up easy baskets to opposing centers. The team hit their stride when Lucas emerged as the fifth starter. Both Wayne Selden and Frank Mason had successful defensive seasons as juniors, however Devonte’ Graham gave away too many points and was slightly below replacement. Jamari Traylor was the only other Jayhawk who provided positive defensive value.
Adjusted PPG +/-
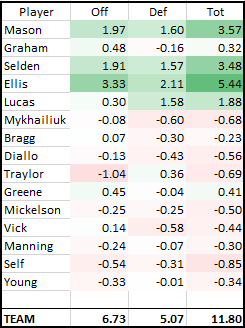
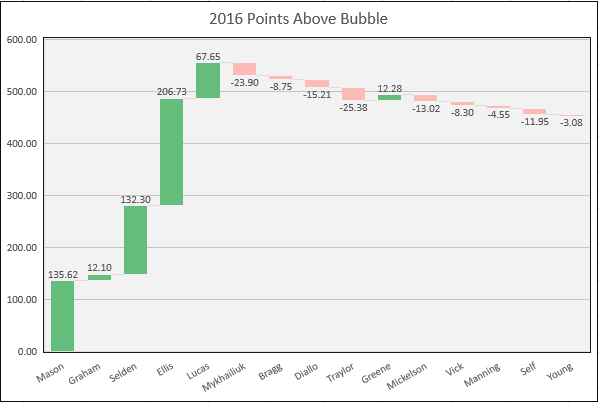
In total, the 2016 team was a very good team that rightfully earned the overall #1 seed. The team was balanced throughout its starting rotation, and had a talented bench however one that didn’t provide much value. The team was good on both ends of the court, and hit its stride during the back-half of conference play and produced a 17-game winning streak.
Data Fulfillment

For the 2016 season, 24/38 games were able to be watched in their entirety. The other 14 games were charted using video highlights, radio broadcasts, play-by-play box score information, and other sources to most accurately record what happened. This led to a Coverage score of 96.93%, which is very good. Over 72.0% of the season’s plays were available on video, with 95.4% of all possessions having at least a 90% confidence rating.
What this indicates is that the value-stat estimates from this season are not prone to much data-absence error. These value scores aren’t likely to be too far off what they would be had we the entire season, since only a small percentage of overall possessions are in question.
The 2017 Kansas Jayhawks finished with a record of 31-5 (16-2), winning the Big 12 Regular Season. The team earned a 1-seed in the NCAA Tournament, reaching the Elite 8 before losing. The team’s Sports Reference link is here.
Offense
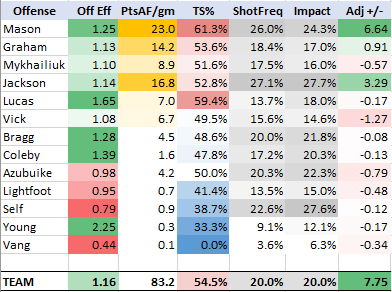
The 2017 offense is Bill Self’s best since coming to KU (through the 2021 season), and it was led by Frank Mason and Josh Jackson. These two accounted for nearly half of the team’s points. Mason shot an incredible 61.3% true shot on a 26.0% frequency. It was this side of the ball that won Frank his Naismith Player of the Year award. Jackson was a high-impact player, and he added offensive value in the areas of scoring, shooting, assisting, and rebounding. Devonte’ Graham was also a positive value player.
Defense
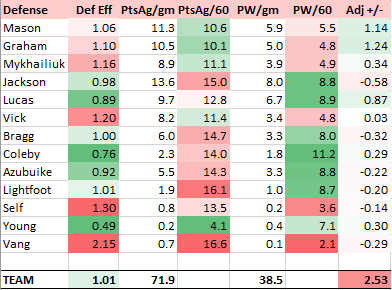
The 2017 team was offense-led, but had some decent defenders. Devonte’ Graham and Frank Mason produced over a point per game in value, and Landen Lucas was a solid rebounder and paint defender. However, there were some holes in the defense. Josh Jackson was a poor on-ball defender who gave up 15.0 points per 60 possessions played. He did do well at getting steals and rebounds. The bench was neither great nor awful on the defensive side.
Adjusted PPG +/-
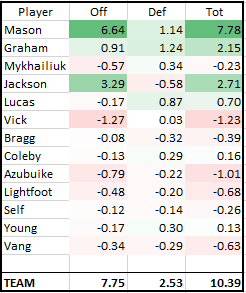
Frank Mason’s PPGAB score of nearly +8 earned him numerous accolades (including college basketball’s best), and when compared to the great seasons in KU history since 1993, is a very close-second to the estimated score Wayne Simien produced in 2005. Josh Jackson’s season, while very good, was overrated on the whole due to his poor defense. Devonte’ Graham had a solid year on both sides of the ball, and Landen Lucas was the final starter to post a positive value score. The bench was lightly used in 2017, although Dwight Coleby emerged as the second-best big after Carlton Bragg had off-court issues and Udoka Azubuike had a season-ending injury.
Points Above Bubble
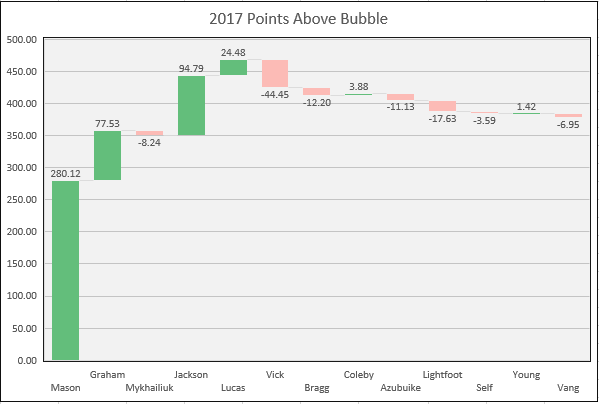
Total Points Above Bubble (PAB) show the outsized effect the play of Frank Mason had on the team. KU’s five starters contributed to produce an elite team and got would it could from the bench.
Value 3-Way
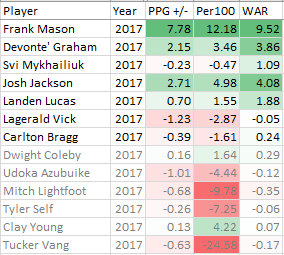
The 2017 roster’s Per100 PAB percentiles, compared to all KU rotation players since 1993, shows the following skill-levels:
Video Coverage
The 2017 season had a coverage of 97.95%. This tells us we are confident in the accuracy of nearly 98% of the possessions that were played that season. This range can theoretically be between 65% (just box score information) and 100% (all games are video-charted). We have full game video for 28 of the 36 games and the other 8 games are supplemented through a mix of video highlights, play-by-play/box score detail, and radio coverage. Therefore we are confident to state there is only a very small error in the above value stats.
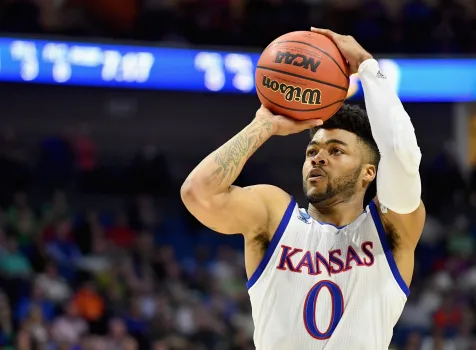
The 2020 Kansas Jayhawks finished with a record of 28-3 (17-1), winning the Big 12 Regular Season. The team’s Sports Reference link is here.
OFFENSE
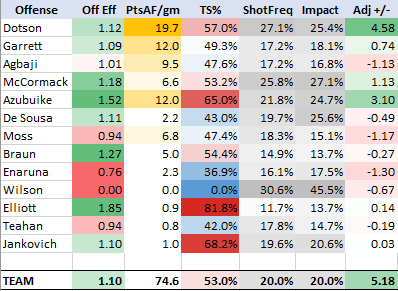
We’ll first focus on the 2020 offense. Devon Dotson was spectacular at scoring on his own play (84% of points off were unassisted). He was the team’s most productive player by a long shot, and quite efficient for how involved he was on offense. Udoka Azubuike used his size and positioning to great effect, allowing him to have the team’s highest true shooting percentage in spite of poor free throw shooting. A majority of his points (54%) were assisted, the highest of all rotation players. David McCormack actually produced more points per minutes than Azubuike, but did so with less efficiency. Marcus Garrett was the only other rotation player having positive value on the offensive end, doing so by being the team’s leading assist-man and finding a niche at scoring the ball on his own play. The team’s jump-shooters struggled to shoot the ball, leading to negative value on that end.
DEFENSE
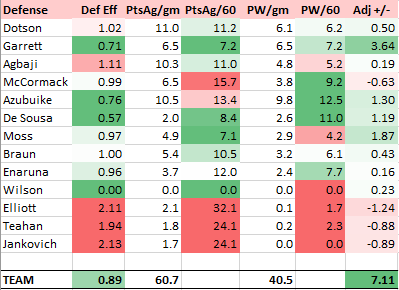
Defensively, Marcus Garrett had the program’s best year (since 1997), giving up only 7.2 points per 60 possessions played while winning 7.2 possessions per 60. An efficiency score that far below 1.00 for a guard/wing is unheard of. But the biggest defensive surprise of the year was Isaiah Moss on the wing, who actually performed better than Garrett on points allowed. One area he did a good job in was staying home on shooters and not over-helping. He played textbook position defense for a wing. Opposing teams wanted to space the floor and bring Azubuike out, which neutralized Doke’s defensive dominance inside the paint. It was this stylistic difference in opponents’ offense that made Moss score higher as a defender than Azubuike. Note that this stylistic difference often hurt opponents on the other end, where Doke could dominate inside. That’s the thing about trying to extract a competitive advantage in one area of basketball. It often comes at a cost. Silvio De Sousa, when he played, showed excellent footwork for a post and hit the glass hard. Last, Devon Dotson’s defense declined from his freshman year, but this was probably due to how much energy he expended on offense. To reframe what was previously stated, when team’s get value from one area of the game it often comes at a cost. Relying so heavily on Dotson on offense almost certainly hurt the PG’s ability to play his best defense.
Total Adjusted PPG +/-
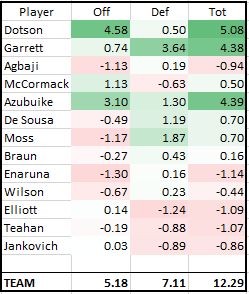
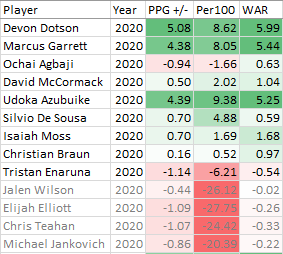
When we put offense and defense together, we see that Dotson, Azubuike, and Garrett carried the team. Moss and Agbaji’s sub -1.0 offensive scores really stand out, so it should be noted that each only shot around 33% from 3 while generating relatively little offense for others off the bounce. These low shooting percentages are somewhat surprising given how much attention other teams paid to Doke and Dot. They should have gotten quite a few open looks to be nearer to 40%. Agbaji may have been overworked, he finished with the second-most minutes on the team and took tough defensive assignments. He was a better talent than his value score suggests.
Freshman Christian Braun proved to be a solid defensive rebounder and shooter. He didn’t create much offense, but took care of the ball and won enough possessions to finish the year on the positive side. The back-up bigs each showed promise, and each were positive contributors albeit in limited minutes behind Doke.
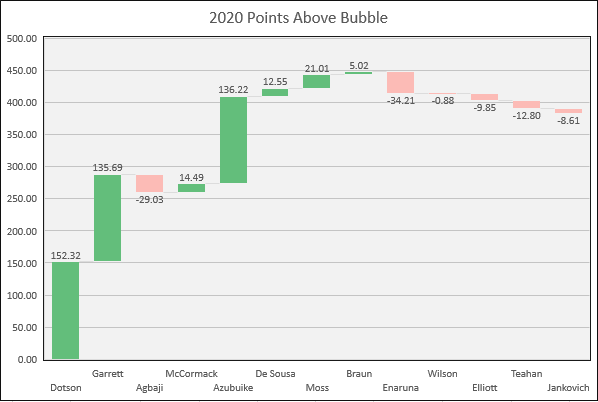
The 2018 Kansas Jayhawks finished with a record of 31-8 (13-5), winning both the Big 12 Regular Season and Conference Tournament. It earned a 1-seed in the NCAA Tournament and made the Final 4 before losing. The team’s Sports Reference link is here.
Offense
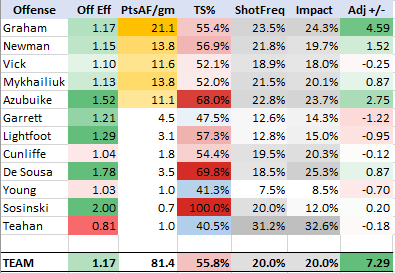
The 2018 offense was led by Devonte’ Graham, both through his scoring and assisting. His true shooting was on par with the team’s, showing his shot frequency was at a reasonable level. The main inside scoring threat was Udoka Azubuike, who shot an insane 68.0% true shooting. Malik Newman developed into a solid offensive weapon. Svi Mykhailiuk as a starter and Silvio De Sousa as a developing reserve were other two positive Jayhawks on offense. As of the 2025 season, this was Bill Self’s second-best offense while at Kansas.
Defense
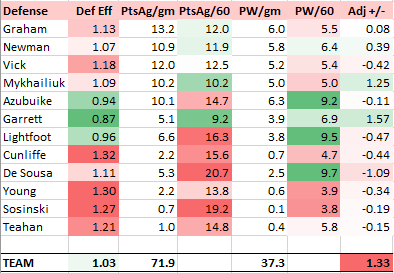
The defense was less effective than in years past. The team graded out as slightly better than a bubble defense, but compared to KU-level this was less-than-ideal. Its best defense was from wings Svi Mykhailiuk and Marcus Garrett. The team’s interior defense was lacking at times, specifically due to depth at the 5 position.
Adjusted PPG +/-
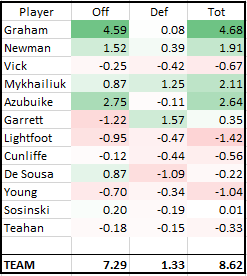
As far as typical KU teams go, the 2018 team was far more offense-heavy/defense-light than average. Regarding total value, the team was much weaker than 1-seeds historically. Still, it played great in March and made a run to the national semifinals. Devonte’ Graham played 94.2% of possible minutes, a record that will last a long time. At one point during conference play, he played 40 minutes in 10 straight games. But it was certainly needed. His +4.68 value score and 13 MVP’s were easily the highest on the team. Azubuike (+2.64, 7 MVP’s), Mykhailiuk (+2.11, 5 MVP’s), and Newman (+1.91, 9 MVP’s) were the other key pieces on the roster.
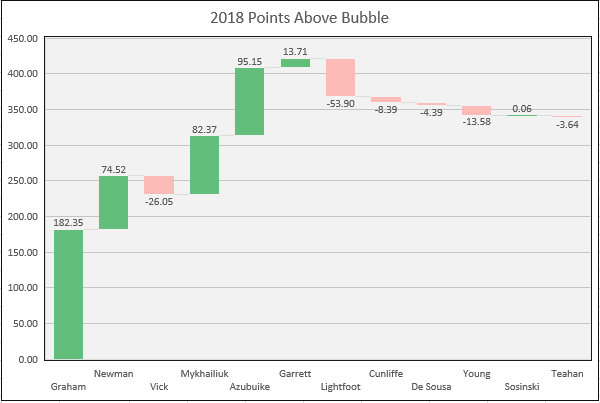
Total Points Above Bubble (PAB) Chart
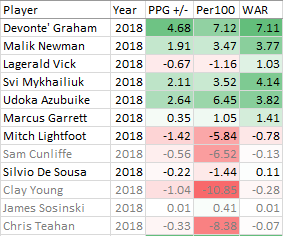
Value 3-Way
Video Coverage
The 2018 season has a 99.4% coverage number, which is very good. The above value numbers only have a small amount of potential error (due to coverage, other error risks remain). Only 2 games of 39 are determined to be incomplete from a video coverage perspective. We are confident that the value scores reflected above accurately depict what the charting process is meant to show.
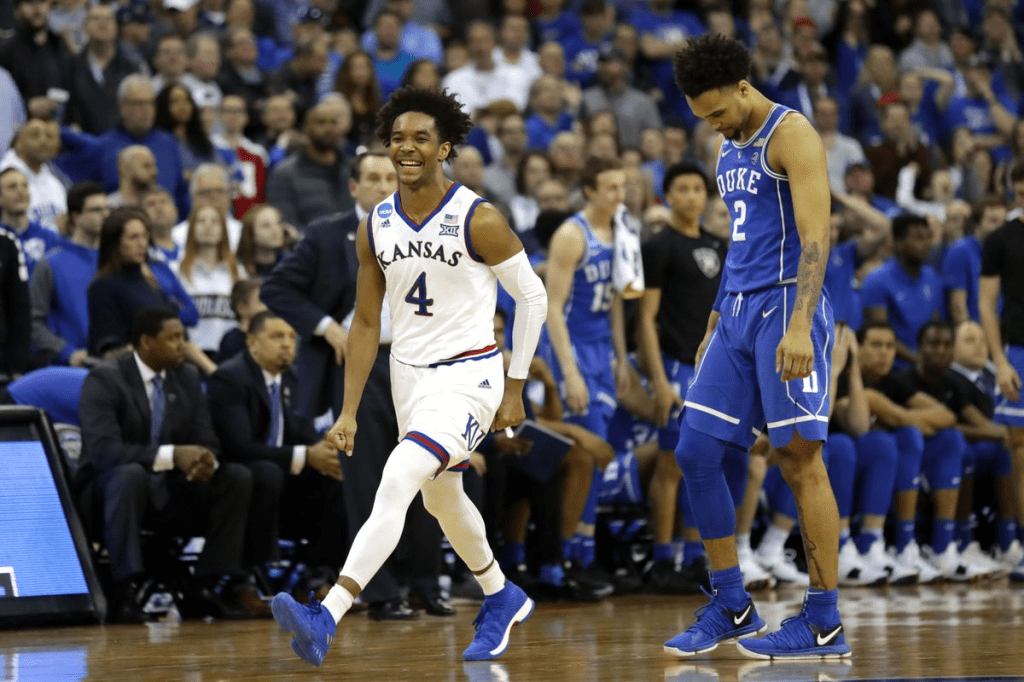
End of a Career
2018 was Devonte’ Graham’s senior season and capped off a four-year career that saw him lead his team to their first Final Four since 2012. Graham finished with 1,748 points in 4,498 minutes played (placing him 9th and 2nd of all Jayhawks since 1993). Also, he currently has the 11th-most career WAR and is 21st in terms of career PAB. Graham was a player who improved each year he was in Lawrence, and his durability and value his senior season contributed to KU winning yet another Big 12 title.
Svi Mykhailiuk was another four-year player who finished his KU career in 2018. Like Graham, Svi improved over the course of his career. Svi would finish with 1,181 career points in 3,070 minutes. He is 52nd in career WAR and 74th in career PAB (out of 194 total Jayhawks from 1993 – 2025).
The 2019 Kansas Jayhawks finished with a record of 26-10 (12-6), earning a 4-seed in the NCAA Tournament. They made the Round of 32 before losing. The team’s Sports Reference link is here.
OFFENSE
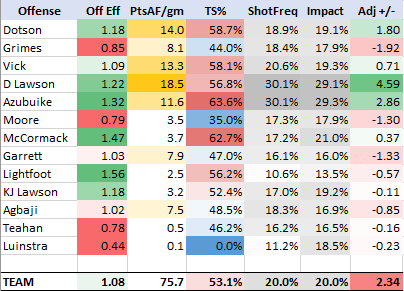
Dedric Lawson led the 2019 team on offense, shooting over 30% of the team’s shots while in the game yet still scoring at an efficient rate. He really took off after Azubuike got injured. Speaking of Doke, the junior contributed a strong offensive season in limited games, driven by efficient shooting and offensive rebounding. Frosh point guard Devon Dotson had a solid year, and showed an adeptness at scoring as well as distributing. Lagerald Vick started out red hot but cooled off some before leaving the team at the end of the year. In total, these players weren’t enough to lift the offense to the heights KU teams traditionally reach. The wings and bench struggled on this side of the ball. With Doke and Vick out at the end of the season, the offense settled in at an above-bubble team level, but only by 2.34 points.
DEFENSE
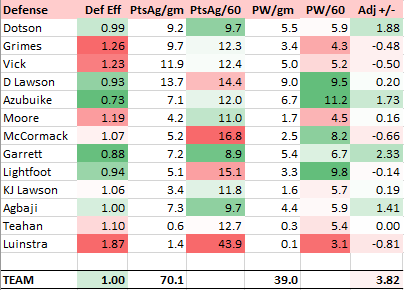
The defense was better than the offense, even after Azubuike was lost to injury. Marcus Garrett’s stingy defense proved him to be the most valuable KU defender, although other bright spots on the perimeter were Devon Dotson and Ochai Agbaji. Vick, Grimes, and McCormack all defended poorly. Overall the team was about an average KU-level defense; not great but not bad. The team was about 4.8 points per 100 possessions above a bubble-team’s defense.
Adjusted PPG +/-
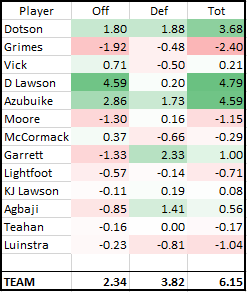
The three most valuable Jayhawks on a per game basis were Dedric Lawson, Udoka Azubuike, and Devon Dotson. With Azubuike lost to injury, both Dotson and Lawson stepped up fine. It was other players who struggled to contribute. Quentin Grimes was especially bad on offense, and his defense wasn’t good enough to earn him the playing time he had. Charlie Moore was likewise a disappointment and produced similar value to Grimes on a per possession basis. Freshman David McCormack and Junior Mitch Lightfoot produced sub-zero value at the post position. The remaining wings–Vick, KJ Lawson, Garrett, and Agbaji–were all positive value players although none were exceptional. Losing Doke and some depth after Vick’s departure did hurt this team, but it was still a team that was capable of going further than it did.
Since 1985 when field expanded to 64+, there have 35 NCAA tournaments. Below is a large collection of stats and information related to the 64+ team era, along with KU-specific information relevant to this year’s tournament.
The first chart shows the average number of wins per seed-line (excluding play-in games). Only the top 6 seeds are expected to win at least one game in the tournament, and there is a steady decline as you go down the seed list.
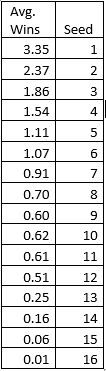
1-seeds have won more tournament games than seeds 9-16 combined. Seeds 9-11 are basically interchangeable in terms of total tournament wins.
Since Kansas is on the 3-line, we’ll zoom in here. 3-seeds average 1.86 wins, sliding them closer to the 4-line than the 2-line. However, they 3-seeds win 2 games 53% of the time. 3-seeds are more likely to get knocked out of the Round of 64 than make the Final 4. A S16 appearance (or 2 tournament wins) would be very close to seed-line expectations. The second weekend seems like a realistic goal for this team, and then enjoy whatever else they can do. Bill Self has had two 3-seeds while at Kansas, losing in the R64 to Bucknell in 2005 and defeating North Dakota St. in 2009 during a S16 run.
Round of 64
Chart below shows each R64 match-up by seed since 1985. There have been 140 of each of these seed match-ups in total. TP means total points per game, so the 1-seed has averaged 84.18 points when playing the 16-seed, which scores an average of 59.94 points.
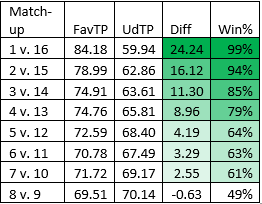
The 3-seed is 11.30 points better than the 14-seed on average. With KU currently favored at -11 against Eastern Washington, this 3/14 match-up is very close to historic expectation.
The next chart shows how much seed differences matter in this first round. The left column compares the win success in the R64 between seeds one seed-line apart. In other words, it compares how often a 1-seed wins in the R64 to how often a 2-seed wins in that round. The right column shows the value as a multiple. In other words, a 1-seed is 8.87 times more likely to win in the first round than the 2-seed is. Of course, it rare that any 1 or 2 lose, but when it does occur it is far more likely that it is the 2. The biggest seed gap, when it comes to R64 success, is between the 1-seed and 2-seed. There is little meaningful difference between seeds 5,6,7 in this round.
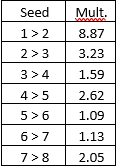
The 2-seed/3-seed jump is the second biggest difference down the board, and it indicates that the 3-seed is closer in expectation to a 4-seed than a 2-seed. Still, KU getting a 3-seed instead of a 4-seed improves its odds of making the Round of 32 by a decent amount.
The biggest margins of victory in this round are as follows:
Some amazing numbers here. First, we all know what happened to KU the next round during the 1998 tournament. Notably, none of these teams went on to win the national championship, and 2/7 made a Final Four (2013 Syracuse, 2009 UConn). The 2013 tournament saw two of these blow-outs greater than 45 points, and these were the only two games which of seeds worse than a 2-seed. Both games also took place concurrently, during the evening session on the opening Thursday of the tournament. Montana shot 4/31 (13%) from 3 against the Syracuse zone, while Akron turned it over 22 times against VCU’s pressure.
A total of 55 First Round games have ended in a 1-point margin, 73 in a 2-point margin, and 59 in a 3-point margin. These one-possession games have accounted for 17% of all games played in the R64. And this doesn’t include overtime games that end with a margin greater than 4.
Here is a list of teams with at least 15 wins in the R64 since ’85 (all records exclude vacated wins):
Kansas’s success in this round has only been rivaled by a few other blue-bloods. It’s win percentage is 94%, matching the success of the average 2-seed. KU has benefited in getting numerous 1 and 2 seeds, but it has also won in this round as a 3, 4, 5, 6, and 8 seed. In fact, KU has gone 12-2 (86%) as a seed worse than 2 during this stretch. Far from choking, the Jayhawks have been stalwarts at avoiding the early upset. KU has won R64 games in 13 straight NCAA tournaments, easily the longest current streak.
Kansas’s 5 Best Round of 64 Games (by margin of victory):
Much of Kansas’ success in the R64 was also due to Roy Williams, who has famously never lost in this round at either school he’s coached. He did miss the tournament in 2010 however, so UNC’s streak of R32 berths begins in 2011.
Round of 32
This section discusses how teams do in the R32 to advance to the S16.
Below are the records for each seed-line in the Second Round:
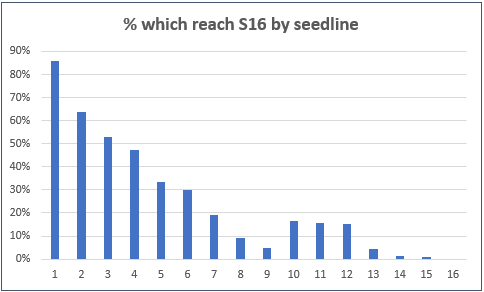
The seed-line success in the R32 (to win berths to the S16), show a sharp decline from 1-seed to 2-seed, followed by a steady decline down to the 9-seed. There is a jump up to seeds 10-12, before dropping back down with very few 13, 14, and 15-seeds making the second weekend. No 16-seed has made the S16. The 8 and 9 seed-lines have the disadvantage of having to play the 1-seed in the R32, making it a tougher slot on the bracket than teams seeded a few lines worse.
As mentioned earlier, 53% of 3-seeds reach the S16. Kansas’s bid to make the second weekend is a legitimate dead-heat.
The biggest margins of victory in the R32 since ‘85:
There hasn’t been a 35+ point blow-out in the Second Round in 19 tournaments.
These are the number of Sweet 16 appearances by program since the 1985 tournament, or in other words the number of Round of 32 wins by program. These totals do not include vacated wins, which have been removed from official win records.
The top four teams on this list are the only ones which have made at least 50% of Sweet 16’s in the past 35 tournaments. Duke’s percentage of 71.4% leads the way, although this will drop after this season.
Kansas’s 5 Best Round of 32 Games (by margin of victory):
Both the Stanford and Arizona State blow-out wins occurred after too-close-for-comfort First Round wins against a 16 and 15 seed. The top 5 results for KU in this round all occurred before Bill Self, although Self has 10 Second Round wins while at Kansas which matches him with Roy Williams.
Sweet 16
Below are the number of wins per seed-line in the S16:
The outsized effect the 1-seed has on the bracket can be seen in the fact that out of the 4/5/12/13 seed pods, only 31 teams have won S16 games whereas out of the 6/7/10/11 pods, 40 teams have won in the S16. Avoiding a 1-seed for as long as possible helps. The 1-seed dominance extends to this round.
Assuming KU could get to the S16, the potential match-up against 2-seed Iowa is on the minds of many. However, 2/3 S16 games are less common than one might think. Since 1985, only 32% of the time have 2 and 3-seeds made the regional semifinals together. But given that 3-seed KU was able to make the S16, it would face a 2-seed 64% of the time.
The biggest margins of victory in the S16 since 1985 are as follows:
Since 1985, here are the highest number of Sweet 16 wins (Elite 8 appearances) by program:
No program has made half of the Elite 8’s since 1985, and North Carolina would have to win three games in this year’s tournament to reach that milestone.
Kansas’s 5 best Sweet 16 games (by margin of victory):
Of the top 3 wins, notably none of those Jayhawk teams went on to win their Elite 8 games.
Elite 8
There are 140 teams which have made a Final 4 since ‘85, and their seed-lines are listed below with the percentage of that seed to make the F4:
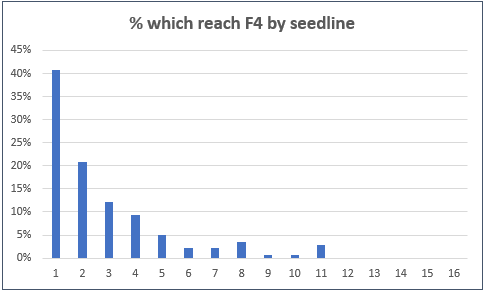
There have nearly been as many 1-seeds to reach the Final 4 (57) as 2,3,4-seeds combined (59).
The biggest Elite 8 margins of victory are below:
Since 1985, here are the highest number of Elite 8 wins (Final 4 appearances) by school:
Of Kansas’s 9 wins in the E8, the best 3 by margin of victory since ’85:
Of the 36 Elite 8’s that a 3-seed has been to, they have faced a 1-seed 25 times (69%). This matches the historic Elite 8 rate for 1-seeds. So were KU to make it to a Regional Final, it would likely face Gonzaga although there is no guarantee.
Final 4 (National Semifinals):
Of the 70 teams which have won a national semifinal game since 1985, 49% of them (34) have been 1-seeds. All seeds 1-8 have made a national title game, but none below 8:
The biggest margins of victory in the Final 4 round are as follows:
Since 1985, the most Final 4 wins (Championship Game appearances) by school are as follows:
Kansas’s 5 wins were as follows:
3-seeds are 11-6 in Final 4 games. Were KU to make a Final 4, the top 4 seeds of the Midwest Regional and potential opponents are: 1. Michigan, 2. Alabama, 3. Texas, 4. Florida St.
National Championship Game:
The 1-seed has dominated in this round as well. Below are national championships by seed since 1985:
Note that these numbers are since ’85, North Carolina State also won as a 6-seed in 1983, when the tournament was 48 teams.
Teams with multiple National Championships since ’85 are:
The biggest margins of victory since 1985:
3-seeds which have won a National Championship since 1985:
Kansas’s 2 National Championships since 1985:
Game scores for tonight are below. Marcus Garrett was the team’s MVP due to his tremendous defensive effort. Garrett was only responsible for allowing 4 Oklahoma points in 39 minutes on the court. Ochai Agbaji was the team’s most offensive productive player, scoring a career high 26 points (although some of that was off assists). But he did nothing else well, as his defense and rebounding was poor. The team played well without David McCormack, putting pressure on the opponent and hanging on after building up a big lead.
Game Scores
Terms
Player Value – What the player contributes toward improving or hurting his team’s chances of winning. More valuable players will have relatively more positive plays (made shots, rebounds, assists, etc.) than negative plays (missed shots, turnovers, etc.).
Player Value Score – The numeric representation of the player’s value. Like WAR in baseball, it is a one-number metric that attempts to combine all relevant statistical information in a way that accurately captures the relative value of each play. For instance, a made 3-point shot is more valuable than a made 2-point shot. In fact, it is 1 full point more valuable.
PPG +/- or Adj PPG +/- – The specific Player value score used by Charting the Hawks. It stands for points per game plus minus, and is the number of points per game a player provides relative to his hypothetical opponent. The Adj PPG +/- is schedule adjusted. For instance, a player with a PPG +/- of +2.50 is estimated to be 2.5 points per game better than the men he is matched up against. Another way to understand this number is to see this player as adding 2.5 points of value per game to his team’s chances of winning.
Introduction
The traditional way basketball player value is calculated is through the use of box score and play-by-play data, utilizing regression analysis and Team +/- scores to estimate the relative value of a player. While there are some advantages to these player value systems, many of the creators of these systems admit that a lack of data and questions of statistical accuracy mar the results.
Charting the Hawks is an innovative system that vastly improves upon the results of old player value metrics. It provides a more accurate player value score, and much more accurate defensive player value score than BPM, PER, WS, PRPG!, VORP, RAPM, EPM, or RAPTOR.
Viewing Basketball as a Possession Game
Just like baseball is a game of innings, basketball is a game of possessions. Teams play an equal number of possessions on offense as they do on defense (give or take a possession depending on who wins the jump ball and/or who gets the ball at the end of each half). Each possession either ends as a win or loss…if a team scores (doesn’t score) on offense it wins (loses) that offensive possession, if a team gets scored on (doesn’t get scored on) it loses (wins) that defensive possession.
A baseball game line score might look as follows:
010 020 200 5 runs
002 110 011 6 runs
(Hits and errors are left off).
We could do the same thing for basketball as well. Perhaps the first 20 possessions of a game would look as follows (separated into groups of 5 to make possessions easier to count):
02203 02002 02000 23002 = 20
02000 00000 20300 02030 = 12
In fact, this was the first 20 possessions of the recent UTEP vs. KU game. After a Jalen Wilson missed layup with 7:14, UTEP rebounded the ball and now was on its 21st offensive possession, leading 20-12.
Zooming in on the Possessions
The next thing we will do is look at each possession not from the offense’s perspective, but from Kansas’ perspective. Kansas has played 20 total possessions on both offense and defense, for a total of 40. Starting with defense, each time UTEP was held to 0 points, the possession clearly ended in Kansas’ favor, either as a blocked shot, rebound, steal, or forced turnover.
KU’s 1st 20 defensive possessions: R,-2,-2,R,-3,T,-2,R,R,-2,T,-2,B,R,R,-2,-3,R,R,-2
We’ve replaced the 0’s with letters…either B (block), R (rebound), S (steal) or T (turnover) to indicate how Kansas ended possessions it won on defense. We’ve also replaced the numbers with their negative counterparts to indicate that we’re viewing this from Kansas’s perspective. We’re looking at this from the perspective of KU giving up 20 points on defense. Commas are added to separate possessions.
Counting these up, Kansas gave up 20 points on 9 scoring possessions, ended 8 defensive possessions with a rebound, forced 2 non-steal turnovers, had 1 blocked shot, and had 0 steals in its first 20 defensive possessions.
KU’s 1st 20 offensive possessions: MRT,MR2a,T,MRM,M,M,M,M,M,M,2,T,3a,T,M,M,2,MRM,3a,M
We’ve now replaced all 0’s with letters…either M (miss) or T (turnover) to indicate how KU ended the possession. We’ve also added the letter R to indicate offensive rebounds. Offensive rebounds are not seen as creating a new possession but rather continuing the current possession. They are essentially the contra-entry to a missed shot. So, for instance, in KU’s first possession they started with M (missed shot) then followed with an R (offensive rebound) yet ended the possession with a T (turnover). 3 separate chartable plays were all made in the same possession.
There are also subscript a’s following certain numbers…these indicate that the play was assisted. Some of the points KU scored were assisted, others were unassisted. Counting up the possessions, KU scored 12 points on 5 scoring possessions, leaving 15 possessions without a score. Adding together missed shots with turnovers, and subtracting offensive possessions, we arrive at the following math: 15 M + 4 T – 4 R = 15 net non-scoring possessions used.
First 20 Possessions of UTEP game – Team Value
In this illustration we’re using the first 20 possessions as it keeps the possession size small enough to reference. Normally we would apply this process to all possessions of a game, and in fact all possessions of a season. But taking the first 20 possessions of the game, KU is down 12-20 to UTEP. We can state that KU’s team value is -8. That’s basically it. A team’s value is just the difference in points of the current result. From here, we can calculate that KU’s offensive value is 0.60 points per possession (12 points in 20 possessions), and its defensive value is 1.00 ppp. We can also calculate team FG%, Reb%, etc.
First 20 Possessions – Player Value
So far, all of this should be pretty straight-forward. But it is here where we begin to look at the logic behind breaking a basketball game down into a series of offensive and defensive possessions. We’ve established that, down 8 points through 20 offensive and defensive possessions each, KU as a team has a value of -8. Another way of looking at this is to we took each player’s individual contribution; it would sum to -8. Adding the player values of Marcus Garrett, Christian Braun, Ochai Agbaji, Jalen Wilson, David McCormack, Bryce Thompson, Mitch Lightfoot, and Dejuan Harris will necessarily equal the team’s score of -8. This system assumes the team just is the sum of its parts1.
For instance, it could be the case that each of the 8 KU players who logged minutes had a player value score of -1.0. (8 * -1.0 = -8). Although this is not very likely of course. There is likely some distribution, where there are a few players adding some value, but more doing poorly. Perhaps the distribution looks like this: +4, +3, +1, 0, -2, -3, -5, -6.
One basic way to calculate a player value score is to do so purely on points since the total team value score is equivalent to the point difference in the game. At this point in the game, KU’s 12 points were scored by the following players: Agbaji 6, Braun 2, Harris 2, Thompson 2. We are able to account for these points at least. But what about KU’s defense? How can we account for the 20 points KU has given up?
Unfortunately a box score won’t do us a lot of help, and a play-by-play analysis will only help a little. Any KU foul which results in FT’s for UTEP might be the fault of the fouler, or perhaps some other defender (sometimes a help-side defender, through no fault of his own, will foul to prevent an easy basket). Looking through the line score, we might try and see who scored and match that to a defender. But with the amount of switching KU does, combined with ball-screens and defensive rotation, we just don’t really know.
What we need is a new statistic, defensive points allowed. Just like we break down offensive possessions, giving value (in points) by who scored the ball; we will want to break down the defensive possessions and remove value (in points) by who got scored on. We’ll need video to help us know what happened. See this YouTube link.
(This is not the full game, but it does have most of the scoring plays. The game was first charted with the full game available, but for illustration purposes we’ll use the highlights).
Starting at about 1:38 on the video, we see UTEP guard Souley Boum drive around Christian Braun to the rim, scoring over the help from David McCormack. We see that Braun was a step slow, unable to keep his man in front. This possession is fairly clear. Braun was responsible for the team giving up 2 points. Therefore this possession would be charted on the ledger under his name, with -2 of value to Braun.
Charting the rest of the scoring plays for UTEP over the first 20 possessions, we arrive at the following defensive point values for Kansas defenders: McCormack -6, Braun -5, Harris -5, Lightfoot -2, Thompson -2. No one else got scored on. For more info on charting defensive possessions, see note below2.
From here we can attribute total player values in this format (Points Scored – Pts allowed = Net Value).
If the math is done correctly, we will get -8 for a total (0-3+6+0-6+0-2-3), matching the score difference.
Charting defensive points allowed lets us in on a few things we might have otherwise missed. McCormack, Braun, and Harris are the three primarily responsible for UTEP’s (relatively) good offensive start. And while Garrett and Wilson have had slow offensive starts, they’ve defended their men well-enough to keep their value scores at neutral.
Value is More than Points
But a player can add value in ways other than producing points. He can rebound, steal the ball, block shots, or assist among other things. He can also lose value in other ways than getting scored on. He can turn it over or he can miss a shot. So we’ll want to track “possession” stats as well explore the difference between an assisted and unassisted basket.
At 3:54 in the video, Christian Braun takes a pass on the wing. He drives it middle with his left hand, collapsing the defense, and makes a fine chest-pass to an open Ochai Agbaji in the far corner. Agbaji hits the 3, cutting the deficit to 6. This is a clear-cut assist. Agbaji’s open 3 was set up by Braun’s penetration and skilled pass. It was an easier shot opportunity than if Agbaji had to generate the shot on his own with a set defender guarding him. Because of this, the 3 points of value will need to be split between the assist-man (Braun) and the scorer (Agbaji) to some degree, with the scorer receiving more of the value.
Possession stats include rebounds, blocked shots, steals, turnovers, missed shots, and forced turnovers. Fortunately for us, most of these stats are kept in the play-by-play data. The only stats missing a link to an individual player are forced turnovers as well as “team” rebounds. Using video evidence, these possessions are assigned to the individual who won these defensive possessions.
Once the possession stats are accounted for, we can devise offensive and defensive points per possession rate stats for each player. The formula for this is to take total points accounted for over total possessions used. We want to know usage, and reward efficient play with the value it deserves.
Without getting deep into the weeds, we see that Ochai Agbaji missed 2 shots over the first 20 possessions. These shots have an opportunity cost, so while he scored 6 points by making 2 3-point FG’s his offensive value was actually less than +6 due to him shooting four times. (Agbaji’s offensive value was also lower than +6 because both of his 3-point makes were assisted. Besides scoring and assisting, a player can also add offensive value through offensive rebounds, which serve to offset missed shots by creating another scoring chance in a possession).
On the other side, Ochai Agbaji snagged 3 defensive rebounds during this span, adding value on the defensive side of the ball by winning possessions back for Kansas. To calculate Agbaji’s entire value, we’d want to consider all relevant plays. He made 2 3-point FG’s that were assisted, missed 2 FG’s, and had 3 defensive rebounds.
The math at this stage can get complicated, but each statistical category is being awarded point value relative to the value it adds. Steals are more valuable than rebounds as they occur before a shot is attempted, and misses are more valuable than turnovers as missed shots can be rebounded whereas turnovers are an automatic loss of possession. Points scored also come with an opportunity cost of one possession. Once all points scored, possessions used, assists, misses, turnovers, offensive rebounds, points allowed, possessions scored on, defensive rebounds, blocks, steals, and turnovers forced are added up, the formula kicks in and provides the following value scores for the first 20 possessions:
Adding these numbers up, we arrive at -8.00.
These numbers changed quite a bit by the time the game was over. Marcus Garrett continued to play elite defense (only gave up 2 points for the entire game), and his offense picked up in the second half to generate a +7.30 game value. This was more than the 5-point margin of the game, so he played a pivotal role in the final result of a KU victory and was the team’s MVP for that game.
Adj PPG +/-
The final calculation to make is an opponent adjustment, using publicly-available advanced rating systems. Given where UTEP is in the computer ratings (136th on KP, 147th on TR, 128th on BT, 167th on BPI), Kansas’s 5-point home margin of victory is reduced to a game score of -4.49. What this indicates is that the team played 4.49 points worse than that of an average game of a bubble-team.
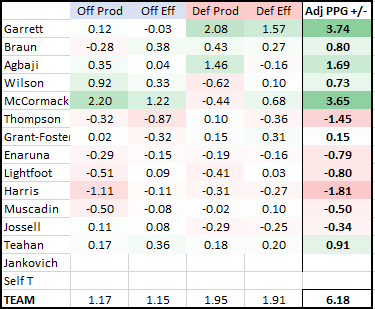
Using this same concept, each player’s value score for the game is adjusted to account for opponent. After adjustment, Marcus Garrett’s value score is only +5.49. However, this still increases his Adjusted PPG +/- to +3.80 points per game for the season.
Offense and Defense PPG +/-
Additional, complicated steps are needed to divide between offense and defense. Basically what we want to know is what rate does a typical replacement player allow points, and then calculate from there. Using Garrett as an example, we know that since his Adj PPG +/- is +3.80, his Off +/- and Def +/- components sum to +3.80 in some fashion. In this instance, after doing the complicated math, Garrett’s defense (unsurprisingly) accounts for almost the entirety of the value as his Off +/- is +0.12 and Def +/- is +3.68. Garrett’s defensive score for this season (2021) is currently the highest defensive score CtH has calculated for any Kansas Jayhawk, slightly ahead of last season’s…you guessed it…Marcus Garrett.
Comparing Adj PPG +/- to Other Systems
Garrett’s Adj PPG +/- of +3.80 is the team’s highest, although only slightly higher than David McCormack’s +3.69. Either Garrett or McCormack will end the season as KU’s most valuable player. But if we were to take other value systems at face value, we wouldn’t know that.
College Basketball Reference currently has Marcus Garrett with a 3.0 WS (win share), which falls to fifth on the team. Likewise, his BPM (box plus-minus) is fifth on the team at 5.5. Garrett does have the team’s highest DBPM (defensive box plus-minus), so this stat is able capture some of his defensive value.
Bart Torvik’s value metric PRPG! has Garrett as 2.6 points per game better than a replacement player, once again below the other four Kansas starters and in fifth place for the team. It has him as 0.4 ppg worse than Jalen Wilson. This quite different from Adj PPG+/-, which is over 3.0 ppg in favor of Garrett.
Value Add Basketball has Garrett as the fourth-best Jayhawk, adding 5.79 pts/game. I’m not sure what the replacement level is in this system, but it nevertheless obviously does not account for his defensive prowess with the information it receives.
This isn’t to disparage these other systems, as they are doing the best with what they have, namely limited statistical information. But it does highlight why charting defense gives us a more-complete picture. What these other systems are able to do is give us national-level player data, whereas CtH only charts Kansas basketball. There simply isn’t enough time for one man to chart other teams.
Summary
Other systems of player value fail to fully take into account defense due to the lack of defensive statistical information. To account for this, Charting the Hawks created its own defensive charting system in order to accurately capture defensive value. In utilizing a possession-based system, it also accounts for “team rebounds” or non-steal turnovers that don’t normally show up in the stat sheet, such as drawn charges. Assists are also carefully sorted out, and rewarded based on passing merit instead of official scorer bias. Additionally, box score errors do occur with some frequency so these errors are corrected using game replays and the ability to rewind.
Footnotes
1 This doesn’t mean coaches don’t add value, rather the system incorporates the value added by coaches into the players’ value scores. Coach Self designing a play that allows McCormack to get an uncontested layup benefits McCormack’s value score. Players would have different value scores were they to play in a different system. This is true for all statistical measures. It would seem clear, based on his historic record and history of player development, that Self does a good job of getting players in the best position they can be in to succeed. A player value score simply tells us what value the player did add, not what he could have added under a different set of circumstances (whether that be more playing time, a different offensive system, etc.).
2 Defensive points allowed is a more subjective statistic than points scored. It is fairly obvious who scores the ball. For defense it isn’t always clear who the main defensive culprit is. Perhaps there are some reading this who attempted to chart the defensive possessions and got different results than I did. That’s ok! A group of 20 possessions is a small sample size. Over the course of the season, these interpretative differences will iron themselves out. (Value metrics aren’t meant to be exact, even the best sabermetricians calculate different WAR values for MLB players each season). What will remain is clear defensive differences between players of varying defensive skill. Regarding the 9 possessions where UTEP scored, I noted that points were scored due to a variety of ways including: giving up a layup off the dribble, giving up a step-back jumper, giving up an offensive rebound/stick-back, giving up penetration leading to an open jumper, and not recovering a catchable ball leading to a layup. More of the philosophy behind charting defensive points allowed will be given in later posts.
 Charting the Hawks