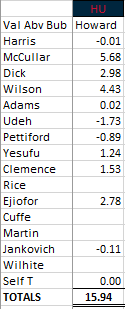
Kevin McCullar was KU’s most-valuable player in their Round of 64 win against Howard. The bulk of his value came from stingy defense and solid rebounding, but he also produced a positive offensive outing as well. Jalen Wilson had a quiet 20 points and also played strong defense, whereas Gradey Dick had the Jayhawks’ best offensive performance to overshadow his poor defense. This was also the bench’s first positive-value performance in its last 7 games.
The TEAM score of +15.94 was its third +15 game in the last four.
KU plays Howard in the Round of 64 on Thursday afternoon, which according to the computer rankings turns out to be as good as a draw as they could have expected (Northern Kentucky is much better per KenPom, etc.). Even better news is the note that Kevin McCullar appears to be improving per Matt Tait. McCullar was not expected to play much in the Thursday quarterfinal game against West Virginia, but he actually went 26 minutes off the bench while fighting back spasms. This was perhaps a false sign of health, as he only played 12 minutes against Iowa St. in the Big 12 semifinals before reaggravating his back early in the second half. He would sit the remainder of that game and the entirety of the championship game.
If McCullar is healthy enough to go the rest of the way, KU has a much better chance to advance in any given round. Replacing a starter who has played in 71.6% of potential minutes this season would be a challenge in any season, but this is particularly considering the fact KU’s bench—particularly at the guard/wing position—has been historically bad this season.
Let’s start with Kevin’s value-metrics this season. Through 34 games, Kevin is producing an adjusted PPG +/- of +1.34, indicating that he is worth a little over a point per game vs. that of a bubble-level (very good) player¹. A comparable player to McCullar’s wing position who had a season around 0.00 (bubble-level) was Christian Braun as a freshman in 2020. So, if frosh Braun were replacing an injured McCullar this season, KU would expect to be about -1.34 per game worse.
But this isn’t what is actually happening, of course. The concept of a replacement player is employed as a way to judge player performance against a certain baseline. For a program as strong as KU, we expect any rotation player to be able to at least break-even when competing against a team on the NCAA Tournament bubble. After all, if you aren’t good enough to help Kansas beat a team on the bubble, you aren’t helping the program get to even a baseline level of what it deems success.
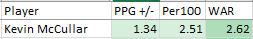
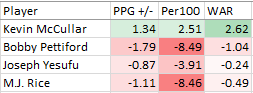
For 2023, KU’s backup guards and wings are (in terms of minutes): Joe Yesufu, Bobby Pettiford, and M.J. Rice. While they do play different positions, their roles overlap to a large degree. With McCullar out, any one of these three can be plugged into the rotation without much change in style (unlike say, any of the reserve bigs). This matters, because when KU goes into its bench on the perimeter, it gets quite a bit worse. Plugging in Udeh for Adams has been less of a drop off, and in some regards (size, rim protection) it has been an improvement. In the season-summary page (link here), a table listing player value in 3 different ways is shown. As of 3/13/2023, this is what it looked like for Kevin McCullar.
This shows that Kevin is producing +1.34 more net points per game for Kansas than a hypothetical bubble-level player at his position (again, think 2020 Braun). The next column translates the per game value to a Per 100 possession level. At +2.51, this number is still quite solid. The final column looks at Wins Above Replacement, not over that of a bubble-level player but of an even worse replacement-level performer. WAR is calculated against a baseline of an average D-1 player. Clearing the value provided by an average D-1 player is something that should be very achievable for any KU player to make the top 8-9 in the rotation. At +2.62 WAR, McCullar has played well enough this season to add this many wins to his team over that of the average D-1 basketball player.
Now we will show the same table as before, just with Pettiford, Yesufu, and Rice added as a comparison.
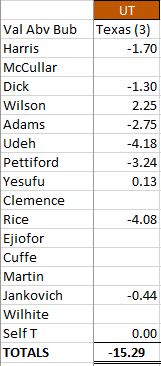
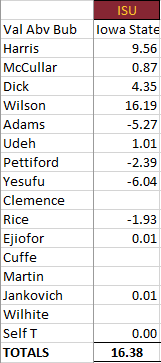
Kevin’s minutes weren’t replaced by a 0.00, bubble-level player at the Big 12 Tournament. They were replaced by these three. In the final two games of the Big 12 Tourney, these three combined for 93 minutes. At 46.5 minutes per game, this was considerably more than the 28.2 that these three average. And this was with McCullar playing some during the Iowa State game. For the Texas game alone, the bench guards/wings played 56 minutes as they covered McCullar’s missing 28 minutes. In these two games, collectively this trio produced a mind-boggling -17.42 points of value. While KU won against Iowa State, it was in spite of the bench. With the Texas game, the bench’s performance only heightened the poor outing of the normal starters.
If we take the difference between McCullar and one of his replacements, we see that Kevin is a better option at the guard/wing by anywhere from 2.21 to 3.21 points per game. The Per 100 numbers are even more stark. Over the course of 100 possessions, Kevin is +6.42 when compared to Joe and +11.00 when compared to Bobby (M.J. Rice is about equal to Bobby). This difference might be able to be masked over a few possessions, but over the course of a game, and certainly over the course of a tournament run; this drop in value will rear its ugly head.
If Kevin were to be out for the rest of the year, KU would need to replace about 50 possessions per game. Even if you could use, perhaps 60% of those minutes with Joe (who has been the best of these three), you would still expect to lose about 4.1 points of value per game. This would dramatically shrink KU’s chances at making a deep run barring some miraculous play from one of the bench reserves. KU needs Kevin, and in fact all of its starters, healthy. This year more than others.
Since 1994, the first year any player-value scores have been estimated, the average SG/SF (wing) player-value for KU players who played at least 40% of available minutes is around +1.46. There is a wide variety of names on this list: Haase, Gregory, Langford, Rush, Wiggins, Mykhailiuk, Grimes, and Agbaji. Some good, some great, some not. McCullar is right around average, which given the comparison still makes him an excellent college basketball player.
But his value to the 2023 team is amplified by who replaces his minutes when he cannot play.
1- As explained, a bubble-level player would be the average performer for a bubble team. A bubble team is determined by looking at the median-level adjusted efficiency at-large team. There is a difference between a team’s adjusted efficiency and its resume, but there is also large overlap. A team around +14.00 on KenPom is normally close to the bubble.
Only two Jayhawks who played were above-bubble, Jalen Wilson and Joe Yesufu. Jalen had an uncharacteristically poor defensive game, otherwise his value-score would have been much better. Joe played 29 minutes filling in for injured starter Kevin McCullar, and finished in double-figures with 11 points.
The remaining starters had poor outings, but none were terrible. Gradey Dick shot poorly but defended adequately. Dejuan Harris likewise had a bad offensive game, but his defense was solid. K.J. Adams wasn’t great, but he outplayed freshmen Ernest Udeh and M.J. Rice. The bench has now had 6 consecutive below-zero outings for Kansas, dropping it to the worst bench in the 20-year Self era.
Next week begins the NCAA Tournament. One hopes the team can use this poor outing as motivation to come out focused and win two in Des Moines next week. It was the TEAM’s second-worst outing of the season (and 8th below-zero game overall).
Jalen Wilson had his second-best performance of the season, and Dejuan Harris continued his torrid play of late (averaging +5.28 over his last 10 games) to lead Kansas into the Big 12 Tournament finals. K.J. Adams had trouble inside, giving up a few put-backs to hurt his value score. KU won despite having to go deeper into its bench with Kevin McCullar playing limited minutes due to injury. The bench guards/wings were -10.39 collectively.
Since 1985, the NCAA Tournament has had 64+ teams, with four regionals of teams seeded 1 – 16. In this format, each team has to win 6 games to win the Tournament with each seed having a different path (for instance, a 1 seed has to beat a 16, 8/9, 4/5/12/13, 2/3/6/7/10/11/14/15 to make the Final 4…this differs from a 2 seed’s path). What this means, is that given this many instances, we have some interesting data by seed-line.
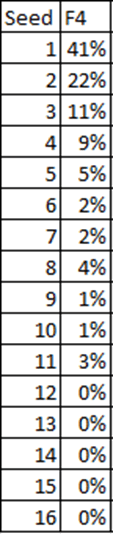
For today, we will focus on the prevalence of each seed in the Final 4. With four regionals, the Final 4 is made up of the four regional winners. It isn’t until this round that teams of the same seed can meet. We will first look at which percent of each seed makes the Final 4.
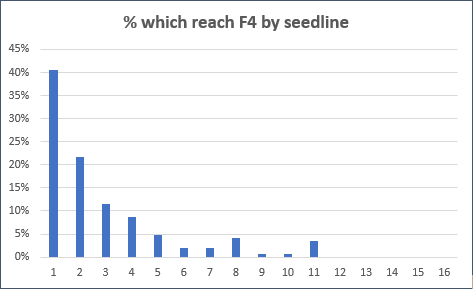
Above is the table, and below is the bar chart of the same data.
The 1-seed is the most prevalent (unsurprising), with a declining frequency by seed down to the 7 seed. However, we see a jump when we get to the 8-seed, and the 11-seed has also won its regional more times (5x) than the 6-seed (3x) since 1985. This is definitely a surprise in the data. Some might hypothesize that the reason for this is that the 11-seeds often contain undervalued mid-majors, whereas the 6-seeds are often weaker power conference teams, and that the best mid-majors are therefore under-seeded. In other words, it would be a claim that the bracket-makers get things wrong along these middle seed-lines.
However, this doesn’t really work. After all, the 6 v. 11 game is played 4 times in the First Round. If 11-seeds were systematically under-seeded, it would show up here. Instead, in 148 games, we see that 6-seeds win 61% of these matchups and have an average scoring margin of +2.96 (nestled in between the 5v12 and 7v10 margins). For whatever reason, the 11 seeds have had more success than the 6’s at winning a regional. However, a 6-seed has won the NCAA Tournament (1988 Kansas). Of course the 1983 N.C. State championship team was also a 6-seed. It falls outside the range of 1985-present, but their run was no less impressive than it would be today.
But now let’s look a little deeper at the 1-seed’s frequency at a Final 4. In the 37 tournaments since 1985, 41% (60/148) of the top seeds made the Final 4. This works out to an expected number of 1-seeds per in the Final 4 per tournament of 1.62. Because each regional is decided independently, this is just the average expectation. Some years it might be 1, some it might be 2. And other years, less frequently, it might be 3 or all 4. Or, it could be 0.
Historically, there has been 1 tournament (from 1985-2022) where all four 1-seeds made it to the Final 4. This was in 2008. There have also been 2 tournaments in this span where no 1-seed has made it to the Final 4. This happened fairly close to 2008, with 2006 and 2011 seeing no 1-seeds win their regionals.
We are left with 148 independent events, which are the historic regional results by seed. Using this data set, we have had all four 1-seeds win their regionals in exactly 1 tournament of 37 (2.7%). How often should we expect this to happen? If we take (0.4054)^4, we get the answer, which is also 2.7%. While one would expect the 1-seed to have the best chance of winning its regional, having all four 1-seeds go 16-0 before the Final 4 is a rare event, as shown by the historic results.
The flip side is the question of how frequently we should see NO 1-seeds make the Final 4. It has happened twice in 37 tournaments, but is that about what we’d expect? The formula here will calculate how likely it is that at least one 1-seed makes the Final 4. It is similar to the earlier example, and it is calculated thusly: 1 – ((1-0.4054)^4). The result is 87.5%, meaning that we’d expect to see no 1-seeds about 12.5% of the time (roughly 1 year out of 8). In reality, this has only occurred 2 years out of 37.
Using the 1-seed success rate at making a Final 4, the last question is, what will happen next? All 1-seeds, or no 1-seeds? Clearly, the answer is the latter is more likely. This does depend on the strength of the 1-seeds relative to the field. In 2008, the 1-seeds were all excellent (although 2011 had a good crop of 1-seeds by computer metrics as well). But assuming the relative 1-seed skill-level will remain what it has been over the past 37 seasons, the math says it is 5.15 more likely that all the 1-seeds miss the Final 4 in any given year than it is that all four 1-seeds make the Final 4.
We will next look at other seed-lines. While 2-seeds are all excellent teams, their performance when compared to the 1-seeds is a significant drop-off. We’d expect all four 2-seeds to make a Final 4 only once in 458 tournaments. For the 3-seeds, this would occur once in 5,744 tournaments. This gets exponentially rarer as we move down the seed-line.
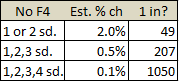
Last, let’s look at how often we’d expect to not see any top seed. This table has the estimates:
2011 is the only tourney to fail to have a 1 or 2 seed in the Final 4. The other two scenarios haven’t occurred and likely won’t in your lifetime.
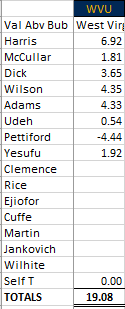
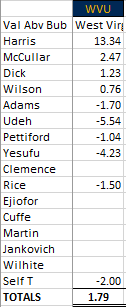
Dejuan Harris had his 5th team-MVP game of the season as the #1 seed Kansas Jayhawks defeated the #8 seed West Virginia Mountaineers in the Big 12 Tournament. Of the 8 Jayhawks who played, all were positive-value except Bobby Pettiford. Kansas advances to play Iowa State in the Big 12 Semifinals.
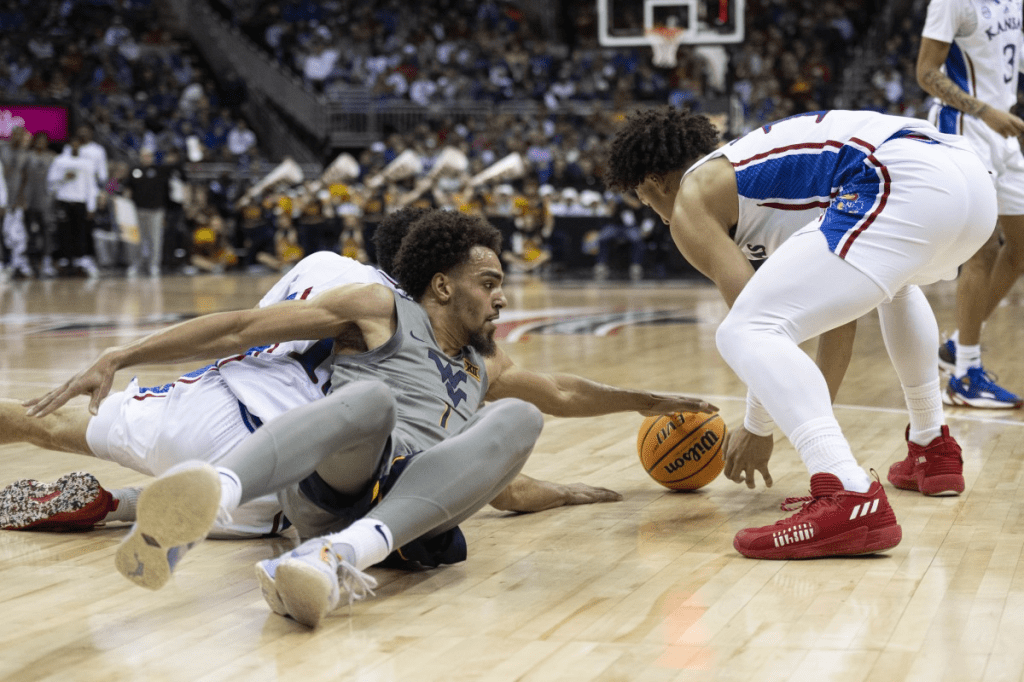
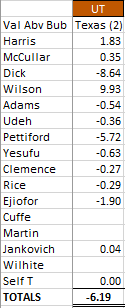
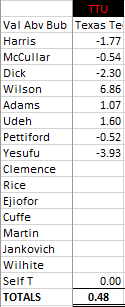
In a game that meant nothing to the conference race, which KU had already clinched, the Jayhawks played flat in Austin and got beat on Texas’ senior day by 16. Jalen Wilson had another great outing in a game when his teammates played poorly. The TEAM’s Game Score of -6.19 (meaning this performance was 6.19 points worse than the expected performance for a bubble team) was its third-worst game of the season and its 7th negative game out of 31.
In these 7 games, Jalen Wilson is averaging a game score of +9.00, whereas the others are collectively at -15.94 for the season. Jalen is having a good season, his current Adj. PPG +/- number is +5.53, but the fact he has raised his game to a high level when others aren’t picking up the slack is impressive. He helped KU win a few of these poorly played games earlier in the season (Southern Utah, Wisconsin).
Gradey Dick had his worst game of the year and has produced negative value over his past 10 games. On the flip side, Dejuan Harris is showing he can provide value even in games where he shoots poorly. Despite managing just 5 points and multiple missed shots, Harris assisted nicely (without turning it over) and defended strongly against Texas’ veteran guards. Kevin McCullar also had a nice defensive game to end slightly above-bubble. K.J. Adams was slightly below-bubble.
The bench had another poor outing, as Bobby Pettiford played the worst of the lot. Only Naadir Tharpe (2012), Justin Wesley (2012), and Stephen Vinson (2006) have had worse Per100 seasons than Bobby out of all rotation players since 2006. (M.J. Rice is also on this list, right next to Pettiford). But Bobby’s played the most out of these names, at 27% of available minutes.
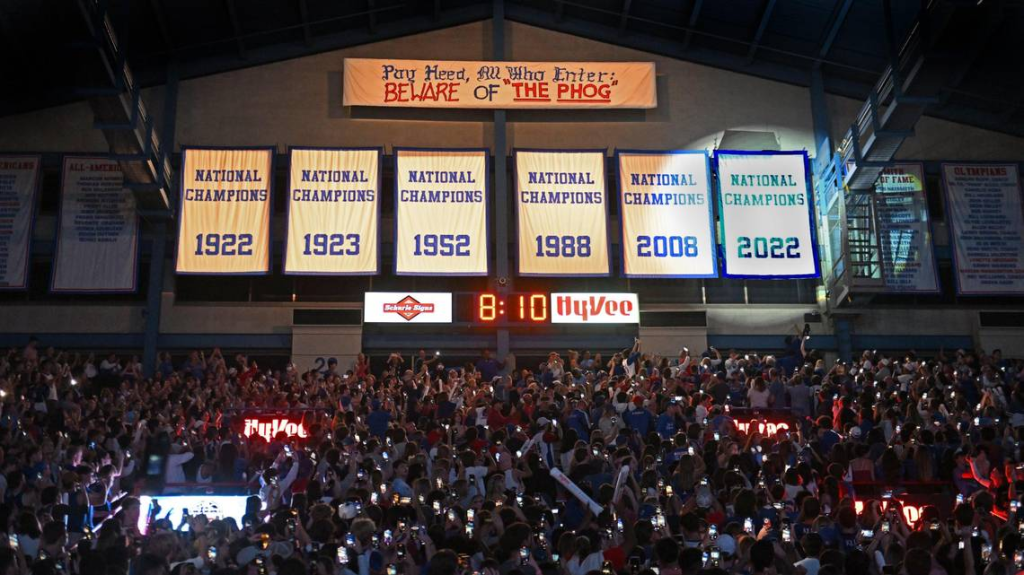
Since the last time we looked at the worth of Allen Fieldhouse, KU has added a National Championship banner. It has also added 15 home wins to just 1 home loss in a difficult Big 12 and non-conference slate. So, it was time to rerun the numbers to see how Allen Fieldhouse has held up.
To refresh, what we’re doing is looking at how good Allen Fieldhouse is at helping Kansas win games per expectation. This is difficult to quantify, but the system that was devised has good reasoning behind it. First, we can look at how good KU has been at home. Since 2010, the beginning season of this exercise, KU is 212-11 in AFH for a 95.1% winning percentage. This is clearly excellent. But how much of this is due to KU being a talented team year in, year out, and how much of this is attributable to the magic of “THE PHOG”?
To isolate the impact of Allen Fieldhouse, we needed to account for KU’s skill. Thankfully, we have a way to do this. Ken Pomeroy’s website (with subscription) provides pregame winning percentage expectations for each D1 game, factoring in the skill levels of both teams and game location (home, away, neutral, etc.). So all we have to do is to compare KU’s wins and losses against cumulative expectation, and what’s left is Allen Fieldhouse. We are effectively comparing the Fieldhouse’s impact against an average home-court.
Since 2010 is the first season where Pomeroy published pregame winning percentage expectation, we begin with this season out of necessity. KU has played 223 games at the Phog in that time, again winning 212 of those games. But what was the expected number of wins (per Pomeroy)? All we have to do is add up each game’s pregame expected winning percentage to get this number. After collecting the data, we arrive at 194.9 expected wins. Simply subtract 212-194.9, and we get 17.1 Wins Above Expectation (abbreviated WAE). In 14 seasons, this works out to over 1 win per year, which can be significant in tight conference races.
This gets us somewhat of an understanding of the excellence of the Fieldhouse, but it still needs further context. After all, just as with anything else there has to be some places which perform better than expectation (just as there are some arenas that perform worse than expectation). In short, is 17.1 WAE a statistically significant difference?
To test this, we constructed a simulation which would run each game 10,000 times (using KenPom’s pregame odds) to see the frequency of results as a total win/loss record. For instance, if KU goes 212-11 in 20% of simulations, this means that it isn’t that unlikely and Allen Fieldhouse’s accolades are overstated.
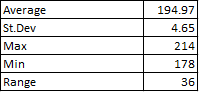
So, running the results this time, we got these totals (in wins out of 223 games):
The average number of wins in the simulation is very close to the true expected number of wins, helping confirm that 10,000 sims was a large enough size. The standard deviation is listed next. The next number is the highest number of total wins in any specific sim, with the number below that the lowest number of total wins in any sim. Last, the range shows the broad difference between high and low win totals.
The Max number of 214 shows that we have at least one result of at least 212 wins, just through “luck.” This tells us that, given enough chances, KU’s run over the past 14 seasons could be replicated at a different home arena. This is noteworthy, but we still need to calculate a few more numbers before we fully discount the aura of “THE PHOG.”
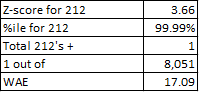
Taking 212 wins (given pregame winning expectations), a z-score of this event occurring is 3.66. Converting this to percentile terms, this high level of a z-score is in the 99.99%. We see next that there was 1 total result of 212+ wins in the 10,000 simulations, and we would expect this result (212 + wins) to occur in 1 out of 8,051 random sims. Last we see the WAE number of 17.09.
In layman’s terms, Allen Fieldhouse has won games for KU. We can factor out KU’s elite talent, as that is already calculated in pregame winning percentage expectations. We can factor out general home-court advantage, as KenPom’s system accounts for where games are played. What is left is the pure aura of Allen Fieldhouse. How KU wins this many games is up for debate. But there is something special about the Phog, and it is something that persists over time.
Jalen Wilson was KU’s best performer for the 14th time in 30 games this season. He was productive but not efficient on offense, and far better on defense than given credit for. The only other starter to produce a positive-value game was K.J. Adams, who also played good defense overall despite giving up a few baskets inside due to his size at the 5. Ernest Udeh also had a positive game and now sits just fractionally above-bubble for the season.
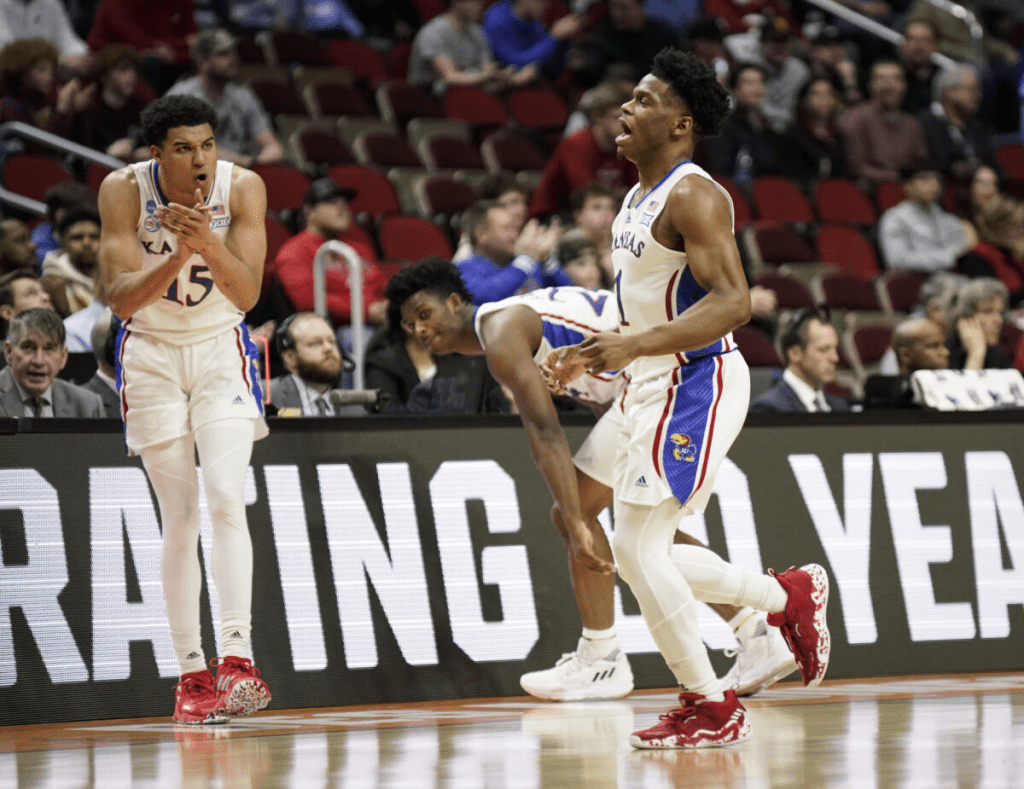
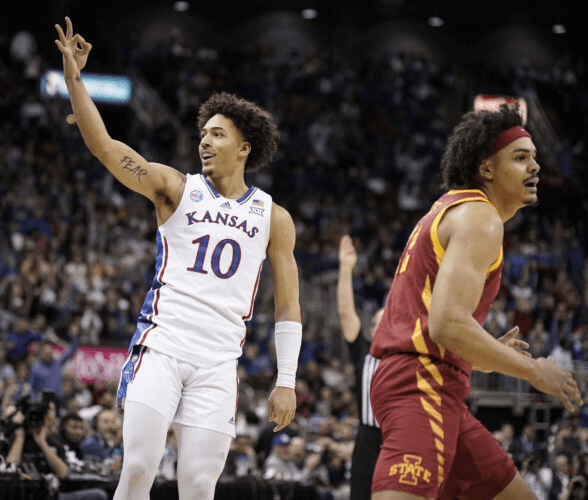
On the other end of things, Kevin McCullar graded slightly below-bubble but made memorable clutch plays late. His recovery block on former teammate and fellow Kevin was incredible. His hustle for the stick back basket to put the Hawks up 3 late was just another of huge high-leverage positive final-minute plays that he has made in close games this season. If the game is close, he just seems to be able to make the winning play. Dejuan Harris had a surprisingly negative game, although the deep 3 he allowed with a few seconds left (to cut a 5 point lead to 2) was a contributing factor. It wasn’t bad D, but his man stuck the shot so per the system these points were allowed by him. These types of “luck” plays will certainly balance out over the course of a season, so be careful to not extrapolate from single-game results. Gradey Dick was KU’s worst starter, but overall his performance was only negative due to poor shooting (0-7 from the floor, 4-4 FT’s for a TS% of 22.2%). Joe Yesufu hit his first 3 (when the KU starters couldn’t get anything to drop from the outside), but then proceeded to miss 2 shots and allow 6 points on defense. Since a nice, three-game run in late January/early February, he has recorded an average Adj. PPG +/- of -2.10 over his last 6 games. Still, he has been KU’s best guard/wing off the bench for the year and likely deserves 8-10 minutes per game. Bobby Pettiford only played a few minutes and missed his only shot.
The TEAM score was barely bubble-level but enough to get it done against an actual bubble-team.
Dejuan Harris had his best career game and his 3rd team-MVP of the season. He was also KU’s best offensive and defensive player Saturday, something which has occurred in only 7 of the team’s 29 games this season. Over his last 6 games, Dejuan has averaged a game score of +6.07, the best on the team in that span.
Kevin McCullar, Gradey Dick, and Jalen Wilson each had slightly positive games. McCullar made numerous impressive defensive plays in the second half, but also gave up a few baskets. He hit some nice shots to finish with a positive offensive outing. Dick would have had a better game, but he gave points away in the final few minutes. Jalen Wilson had a quiet game but still managed to do enough to generate positive value.
K.J. Adams was the only starter to record a negative-value game. The bench had its worst game in weeks. Hopefully this is just a blip that will be corrected in upcoming games.
The TEAM score of +1.79 was the team’s lowest since the road Iowa State loss, but it was still good enough to earn the team the win. Let’s hope the gray/white jerseys are done with. Traditional color schemes need to be preserved.