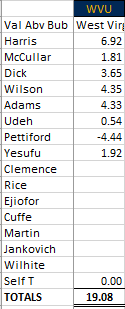
KU plays Howard in the Round of 64 on Thursday afternoon, which according to the computer rankings turns out to be as good as a draw as they could have expected (Northern Kentucky is much better per KenPom, etc.). Even better news is the note that Kevin McCullar appears to be improving per Matt Tait. McCullar was not expected to play much in the Thursday quarterfinal game against West Virginia, but he actually went 26 minutes off the bench while fighting back spasms. This was perhaps a false sign of health, as he only played 12 minutes against Iowa St. in the Big 12 semifinals before reaggravating his back early in the second half. He would sit the remainder of that game and the entirety of the championship game.
If McCullar is healthy enough to go the rest of the way, KU has a much better chance to advance in any given round. Replacing a starter who has played in 71.6% of potential minutes this season would be a challenge in any season, but this is particularly considering the fact KU’s bench—particularly at the guard/wing position—has been historically bad this season.
Let’s start with Kevin’s value-metrics this season. Through 34 games, Kevin is producing an adjusted PPG +/- of +1.34, indicating that he is worth a little over a point per game vs. that of a bubble-level (very good) player¹. A comparable player to McCullar’s wing position who had a season around 0.00 (bubble-level) was Christian Braun as a freshman in 2020. So, if frosh Braun were replacing an injured McCullar this season, KU would expect to be about -1.34 per game worse.
But this isn’t what is actually happening, of course. The concept of a replacement player is employed as a way to judge player performance against a certain baseline. For a program as strong as KU, we expect any rotation player to be able to at least break-even when competing against a team on the NCAA Tournament bubble. After all, if you aren’t good enough to help Kansas beat a team on the bubble, you aren’t helping the program get to even a baseline level of what it deems success.
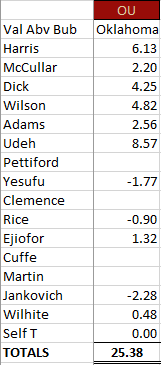
For 2023, KU’s backup guards and wings are (in terms of minutes): Joe Yesufu, Bobby Pettiford, and M.J. Rice. While they do play different positions, their roles overlap to a large degree. With McCullar out, any one of these three can be plugged into the rotation without much change in style (unlike say, any of the reserve bigs). This matters, because when KU goes into its bench on the perimeter, it gets quite a bit worse. Plugging in Udeh for Adams has been less of a drop off, and in some regards (size, rim protection) it has been an improvement. In the season-summary page (link here), a table listing player value in 3 different ways is shown. As of 3/13/2023, this is what it looked like for Kevin McCullar.
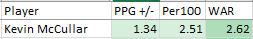
This shows that Kevin is producing +1.34 more net points per game for Kansas than a hypothetical bubble-level player at his position (again, think 2020 Braun). The next column translates the per game value to a Per 100 possession level. At +2.51, this number is still quite solid. The final column looks at Wins Above Replacement, not over that of a bubble-level player but of an even worse replacement-level performer. WAR is calculated against a baseline of an average D-1 player. Clearing the value provided by an average D-1 player is something that should be very achievable for any KU player to make the top 8-9 in the rotation. At +2.62 WAR, McCullar has played well enough this season to add this many wins to his team over that of the average D-1 basketball player.
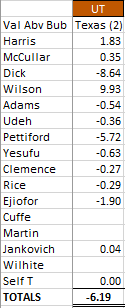
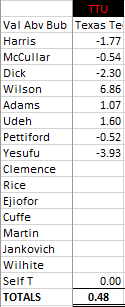
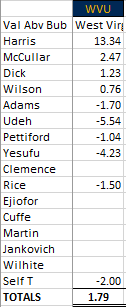
Now we will show the same table as before, just with Pettiford, Yesufu, and Rice added as a comparison.
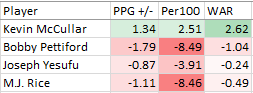
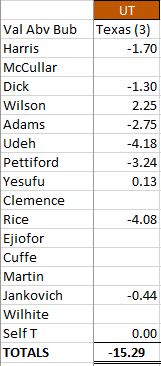
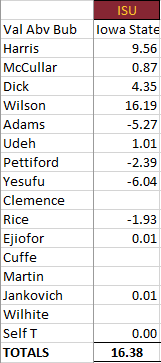
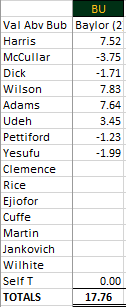
Kevin’s minutes weren’t replaced by a 0.00, bubble-level player at the Big 12 Tournament. They were replaced by these three. In the final two games of the Big 12 Tourney, these three combined for 93 minutes. At 46.5 minutes per game, this was considerably more than the 28.2 that these three average. And this was with McCullar playing some during the Iowa State game. For the Texas game alone, the bench guards/wings played 56 minutes as they covered McCullar’s missing 28 minutes. In these two games, collectively this trio produced a mind-boggling -17.42 points of value. While KU won against Iowa State, it was in spite of the bench. With the Texas game, the bench’s performance only heightened the poor outing of the normal starters.
If we take the difference between McCullar and one of his replacements, we see that Kevin is a better option at the guard/wing by anywhere from 2.21 to 3.21 points per game. The Per 100 numbers are even more stark. Over the course of 100 possessions, Kevin is +6.42 when compared to Joe and +11.00 when compared to Bobby (M.J. Rice is about equal to Bobby). This difference might be able to be masked over a few possessions, but over the course of a game, and certainly over the course of a tournament run; this drop in value will rear its ugly head.
If Kevin were to be out for the rest of the year, KU would need to replace about 50 possessions per game. Even if you could use, perhaps 60% of those minutes with Joe (who has been the best of these three), you would still expect to lose about 4.1 points of value per game. This would dramatically shrink KU’s chances at making a deep run barring some miraculous play from one of the bench reserves. KU needs Kevin, and in fact all of its starters, healthy. This year more than others.
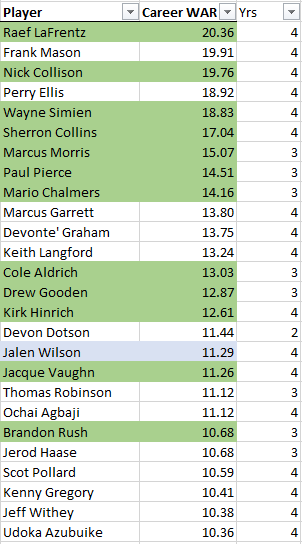
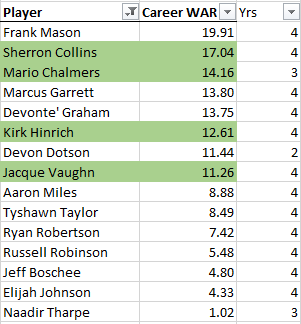
Since 1994, the first year any player-value scores have been estimated, the average SG/SF (wing) player-value for KU players who played at least 40% of available minutes is around +1.46. There is a wide variety of names on this list: Haase, Gregory, Langford, Rush, Wiggins, Mykhailiuk, Grimes, and Agbaji. Some good, some great, some not. McCullar is right around average, which given the comparison still makes him an excellent college basketball player.
But his value to the 2023 team is amplified by who replaces his minutes when he cannot play.
1- As explained, a bubble-level player would be the average performer for a bubble team. A bubble team is determined by looking at the median-level adjusted efficiency at-large team. There is a difference between a team’s adjusted efficiency and its resume, but there is also large overlap. A team around +14.00 on KenPom is normally close to the bubble.