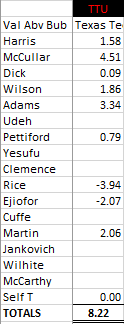
An odd game from a value-score standpoint, Kevin McCullar grades out as KU’s best player thanks to his stingy defense. Although he had a poor offensive showing, guys like Dejuan Harris and K.J. Adams stepped up for 18 and 14 respectively. McCullar was responsible for allowing only 3 points, earning him his third team-MVP game of the season (tied for second, with Gradey Dick).
In KU’s 95-67 drubbing of Missouri, the bench only contributed 9 points (3 of those from Michael Jankovich) in 41 minutes. Four of the starters played 32+ minutes despite being in control of the game most of the way. Clearly Self doesn’t trust his bench.
KU’s bench has not been great, to put it mildly. The starting 5 has all had big moments in the team’s 9-1 start, but little production has come from the reserves. Sure, there are moments. Bobby Pettiford’s put-back reverse lay-up to beat Wisconsin comes to mind. But those were his only points of the game. M.J. Rice showed some great skill with his recent 19 point game, but that came against an overmatched Texas Southern squad (currently #253 on KenPom). He hasn’t been solid against the better teams on the schedule. Joe Yesufu is having a better season than last year, but he is clearly still playing at a level below the starters at the guard/wing positions. The various bigs have shown some skill, but nothing consistent enough to earn minutes. One game Udeh looks good, the other he doesn’t. And so on down the line.
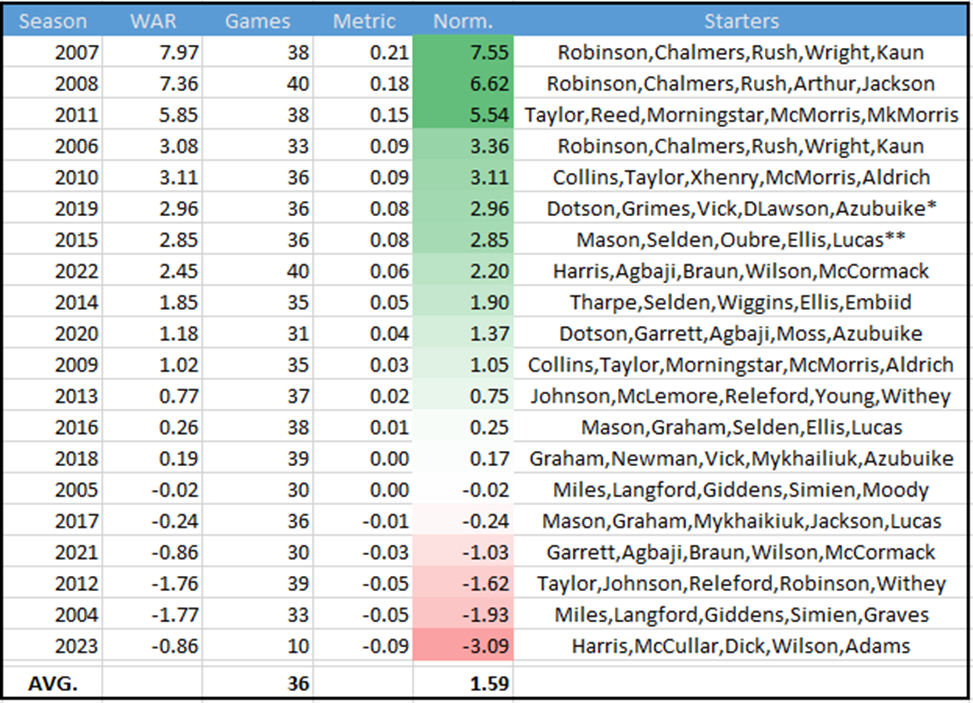
Without further ado, I decided to rank the benches at KU by season. Before doing so I made some predictions on who would be the worst. My prediction was that the 2023 team will be second-worst, behind the 2012 team. But I also wanted to find out which benches were the best, and how 2023 compares to historic norms. To quantify this, a few rules are put in place. First, the main five starters will be deemed the starters, while anyone else is a bench player. Starting rotations can fluctuate, but for basically all seasons a starting 5 will emerge for Self during February and into March. Second, the quantitative measure will be total bench WAR over total team games played. This is to normalize the metric by number of games. Third, to make the number stand out better, we will convert it to a 36-game schedule. Last, the time period will be the Self-era (2004 through 2023). 20 seasons is good enough.
Results:
*The 2019 team lost Azubuike (to injury) in early January and Vick (personal reasons) in early February. Still, the starting 5 was clearly those 5 before these issues arose, so despite starting at the end of the year, guys like Agbaji and McCormack are considered “bench players.”
**The 2015 team lost Alexander (to eligibility) at the end of the year, and Lucas was the starter into March. Traylor actually made more starts than Lucas, but down-the-stretch it was Lucas as the starter. Traylor and Alexander are considered “bench players” for this exercise.
With the caveats out of the way, the Norm. column is what we want to focus on. It shows, per a 36-game schedule, how much bench value was provided that season. The average KU team provides 1.59 WAR off the bench over the course of 36 games. Most benches provide positive WAR on the season (14/20 or 70%). We see trends, with Self having better benches during the early years. The next chart will be the same as above, just sorted from best to worst.
My initial projections on the worst benches were close. The 2023 team has had the worst bench in the last 20 years, however this is only after 10 games. Expect this number to trend closer to 0 as Self continues to be more selective in who he plays. The 2004 team had the second-worst bench. The best bench player that year was a partial-starter in David Padgett. Others off the bench that season were Michael Lee, Bryant Nash, Jeff Hawkins, Christian Moody, and Moulaye Niang. Not a lot of great choices there.
The 2012 team is the team which had the most success while having a negative-value bench. The national runners-up relied heavily on the starting 5. Bench guys like Conner Teahan and Kevin Young provided small, positive WAR, but the others (Tharpe, Wesley, and the walk-ons) caused that number to drop below zero.
On the flip side, both the 2007 and 2008 teams had tremendous benches. The 2008 National Champions played essentially 7 starters. Collins and Kaun had great seasons off the bench and would have been starters almost anywhere else around the country. Even the 8th and 9th men on that team (Rodrick Stewart, Aldrich) added value. 2007 was similar, with Collins coming off the bench. In addition, posts Arthur and Jackson (who would win starting roles that following year) played great as reserves.
Getting back to 2023. The player with the most value off the bench is Michael Jankovich, who has scored 8 points on 3-4 shooting in 13 minutes. This is a far cry from say, the 2011 bench, which had T-Rob and Mario Little filling in nicely for the Morris twins.
If the 2023 bench doesn’t show signs of improvement, Self will likely rely on his starters even more. K.J. Adams, despite playing out of position, has given KU five consecutive above-bubble performances (and 7/10 this year) as he has settled into a non-traditional 5-man role. Kevin McCullar’s last two games have been his best on the season, and his offense and defense have started to fit in nicely to what KU wants to do. Jalen Wilson, Gradey Dick, and Dejuan Harris have been consistently solid. It’s apparent when any of those guys are off the court, so I expect them to play around 35 minutes each in close games, leaving little time for their backups.
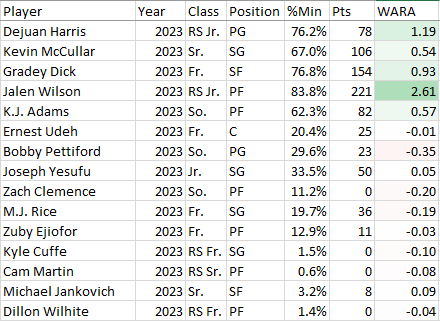
Last, here is the WAR for the 2023 team. The top 5 are starters, below that, the bench:
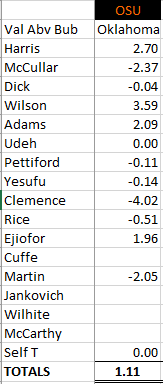
After a decade plus of irrelevance, Coach Lance Leipold has the 2022 Kansas Jayhawks football team at 6-5, and eligible for a bowl game for the first time since 2008. This achievement occurred a few weeks back when the Hawks won their 6th game of the season against Oklahoma St. Since that time, other teams have become bowl eligible, leading us to examine this question.
For more background, being “bowl eligible” is different from receiving a bowl invite. Being bowl eligible just means you have a 6-win season (in a 12-game schedule). Receiving a bowl invite occurs when a specific bowl invites your team to play in it. Theoretically, a team can be bowl eligible but not make a bowl.
This happens, but not often. There are so many bowls nowadays that most 6-win teams make a bowl. In 2019, the last regular season before COVID, the only bowl-eligible team to not get an invite was 6-6 Toledo. There were 79 bowl-eligible teams for 78 spots, and the Rockets drew the short straw.
Let’s tie this back to Kansas. At 6-5, Kansas is bowl eligible but might finish 6-6 if it loses in its final regular season game. At 6-6, Kansas could theoretically find itself in the same position as 2019 Toledo. But is this a realistic scenario?
Let’s break it down. There are 41 bowl games this season (excluding the National Championship), meaning there will be 82 teams which play in a bowl game from December 16 to January 2. Right now, there are 75 teams which are currently bowl eligible (i.e. have 6+ wins). With 1 week to go*, there are 18 teams which can still become bowl eligible. Two of these teams play each other (Miami OH and Ball State). This gets us to 76 bowl eligible teams. If each of the 16 remaining teams wins, this would mean 92 bowl eligible teams! In this scenario, 10 teams with at least 6 wins would not go to a bowl game.
But this won’t happen. Georgia Tech needs to beat Georgia in Athens, for instance (ESPN gives the Yellow Jackets a 1.3% chance of winning). Even if this upset occurred, other very unlikely events would need to happen (i.e. Vanderbilt over Tennessee, Auburn over Alabama, UTEP over UTSA, etc.).
Using ESPN’s odds of victory for the final week(s), bowl-possible teams are expected to win 6.22 games. Doing some quick math, this means that there are an expected 81.22 teams that will be bowl eligible following the regular season out of 82. Or it is more likely that a 5-win team will receive a bowl invite than a 6-win team will be left home.
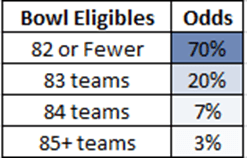
But we can go further and sim the final week(s) to see how likely it is that more than 82 teams become bowl eligible. Running 100 sims of the final games, we find it roughly that there are more than 82 bowl-eligible teams only 30% of the time. But most of these instances are exactly 83 teams. Only 10% of the time are there 84 or more bowl-eligible teams. And only 3% of the time do 85 teams or more find themselves with 6+ wins.
It is in Kansas’ interests for the 5-6 teams playing this weekend to lose. This includes teams like Auburn, Missouri (duh), and Georgia Tech. 70% of the time, Kansas will have nothing to worry about.
But what about the 30% of the time where more than 82 teams earn bowl eligibility? Are the Jayhawks in danger of becoming 2019 Toledo? First note that of the instances where there are more than 82 teams which become bowl eligible, most are with only 1 additional team (83 total teams). Only 10% of the time are there expected to be 2 or more bowl-eligible teams which stay home.
The worst scenario would be a great final week for the bowl-questionable teams. But even in the worst case, Kansas should be able to rest easy. In 2018, there were a total of four bowl-eligible teams which stayed home. This is so unlikely to happen in 2022 that it didn’t make the graph above, occurring only 1 out of 100 sims. But in case it did, let’s look at history. Who were the teams left out in 2018?
Louisiana-Monroe (6-6), Miami OH (6-6), Southern Miss (6-5), Wyoming (6-6). All non-Power-5 schools.
Which 6-6 teams made bowl games that season?
Tulane, BYU, Wake Forest, Minnesota, TCU, Baylor, Vanderbilt, Purdue, Virginia Tech, and Oklahoma State. Mostly Power-5 schools, with a solid Independent and AAC team also qualifying.
Clearly, 6-6 teams are ranked in terms of importance when the bowls decide who to invite and who not to. Even if there are 84, 85, or even 86 bowl-eligible teams; the Kansas Jayhawks will almost certainly get the nod ahead of a 6-6 Louisiana or Southern Miss or Miami OH.
The odds KU doesn’t make a bowl are probably something like 1 in 10,000. Nothing to fret over. KU is going bowling this season.
But not all bowls are equal. The Big 12 has 6 current bowl ties to non-NY6/CFP. The First Responder (University Park, TX), Guaranteed Rate (Phoenix), Liberty (Memphis), Texas (Houston), Cheez-It (Orlando), and Alamo (San Antonio). A Kansas team that went 7-5 (4-5 in conference) would get a better bowl than one than went 6-6 (3-6). As if we needed any other reason to cheer for a win on Saturday.
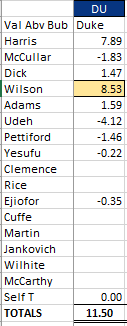
Against Duke, Jalen Wilson produced 8.53 points of value above bubble, which is the highest in a game for a Jayhawk this season. Wilson led the Hawks to victory with his 25 points and 11 rebounds.
Dejuan Harris was the second-most valuable KU player, doing so mostly with his defense. He was credited with 10 official assists, although only 6 were actually value-added according to CtH. The official scorer was generous with assists for some reason. Harris’s defensive presence helped KU win the game, as he gave up only 2 points in nearly 35 minutes of play.
Moving down the list, K.J. Adams and Gradey Dick each had positive games and made big plays late to help seal the win. Of Gradey’s 14 points, 12 were on an assist. Adams didn’t win many defensive possession (exactly 1 rebound, steal and forced turnover each); his value was in only giving up 6 points to Duke.
Joe Yesufu didn’t score but also didn’t get scored on. He had a steal and drew a charge. Zuby Ejiofor grabbed some rebounds and added a lob dunk to play nearly at bubble-level. Bobby Pettiford only scored 2 points with 1 assist. Kevin McCullar scored 12 points but gave up 14. It was his worse defensive outing, even adjusting for opponent quality. Last, Ernest Udeh struggled on both ends. He failed to score but gave up 7 points in his 13 minutes of play.
The TEAM score of 11.50 was KU’s best of the season.
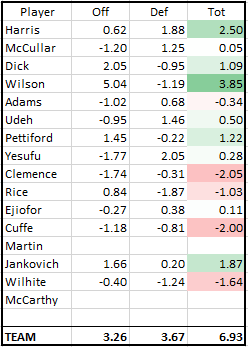
So far through 3 games, KU’s value scores look like this:
As mentioned in the deep dive of Jalen Wilson earlier in the year, it was entertained that Jalen would have to take on so large a role on offense for this team that his defense would decline. This has been the case through 3 games. Harris’s defense has been superb to this point, but his offense is likewise positive despite the limited scoring (7.3 ppg in 30 mpg). His assist numbers are what’s driving his offensive value. Gradey Dick’s offense is outpacing his defense. Kevin McCullar’s defense has been overall solid, with his offense a step behind.
As with any value stat, WAR (Wins Above Replacement) is standardized around a certain threshold value. In this case, the replacement is an average D-1 player (or more precisely, a player who provides neutral value for the average D-1 team). WAR is good because it allows us to quantify experience, and specifically experience weighted toward winning games.
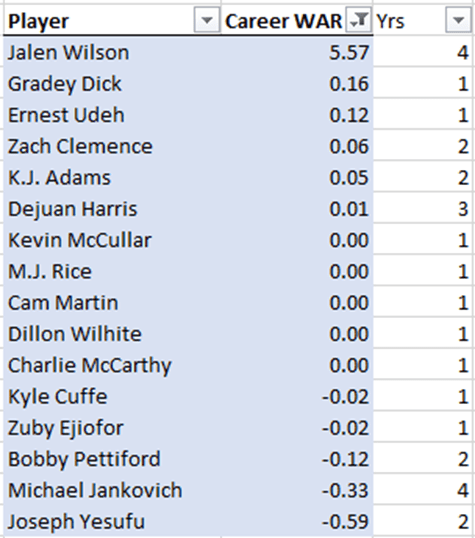
WAR is cumulative, so with more games and more playing time, a solid player will build up his WAR over the course of his career. It was surprising to calculate Career WAR for the 2023 team and see this list:
Yes, Gradey Dick has the second-most Wins Above Replacement of any current Jayhawk despite having played in only 1 official game. Note that the following have also only played one (or zero) game(s): Udeh, McCullar, Rice, Martin, Wilhite, McCarthy, Cuffe, Ejiofor. But this still leaves us with the following list of players: Clemence, Adams, Harris, Pettiford, Jankovich who have less career WAR than Dick despite being at Kansas for at least a full season.
The freshmen last season (this year’s sophomores) produced very little in value. The other name, Dejuan Harris, struggled as a freshman and only crossed into positive Career WAR at the end of last season. Expect Harris to trend further positive as the year progresses, but it is unlikely he catches Dick at any point in this season.
Which is to say the following. KU doesn’t have a ton of experience in winning games on the floor. It has past role players and guys that played sparingly, but not a lot of game MVP winners. Kansas came into the 2023 season with its roster having a combined 4.55 WAR over the course of their KU careers. To compare to past seasons, only twice since at least 1995 has there been less combined WAR coming into a season—2006 and 2014. Of course, this ignores Kevin McCullar’s Big 12 experience from his days at Texas Tech. Once that is factored in, he is likely around Jalen Wilson in terms of Career WAR.
A close comp to the 2023 roster is the 2009 roster, which coincidently was also the year following a national championship. KU returned Sherron Collins (who had produced 5.59 Career WAR to that point), along with a handful of other guys. Cole Aldrich only had 0.61 WAR his freshman season (but would generate quite a few wins his next two seasons). There were a number of solid incoming freshmen that year, namely Tyshawn Taylor and the Morris twins. For returnees who would play a bigger role following the roster turnover from the prior season, you had Brady Morningstar and Tyrel Reed.
There’s a small correlation between experience (in terms of Career WAR) and NCAA Tournament success for past KU teams. Seasons like 2008 point to experience = success, however 2005 and 2010 teams had comparatively similar experience but still lost in the first weekend. On the other side, the 2012 and 2018 teams had less incoming WAR than the average KU team does yet each managed to make the Final Four. The 2022 team was somewhere in the middle.
And he should be. Harris is the type of kid who plays the game hard, never complains, is a great teammate, and from all appearances seems like the model player off the court. And as he comes into his third year as a Jayhawk player (fourth year in the program), he is positioned to be one of the leaders on the team in the 2023 season.
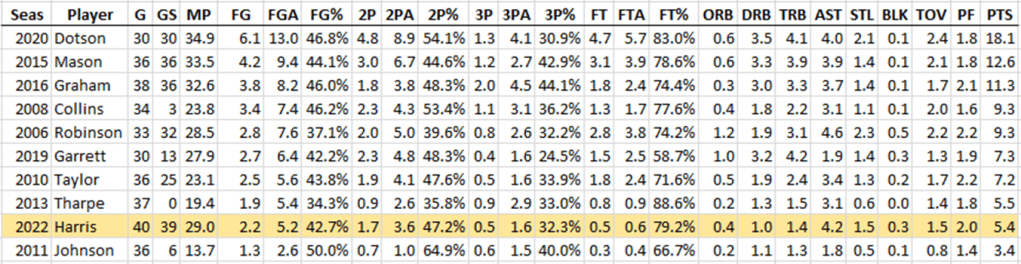
On KU Twitter and the Message Boards, Harris is generally seen as a positive contributor, however there are the occasional unpopular types who will point out his stats. The Harris-haters are derided. But are they completely wrong? For instance, take a look at his per game stats for 2022.
Harris isn’t a scorer, of that people agree. His assist total is solid, but then again, he is a PG. The A/TO ratio of is 2.8 is very good. He also gets some steals. On the negative side, his rebounding is quite low. And his shooting could improve. But stats are meaningless without context. The question is less, is Dejuan Harris good, and more, how should we judge his skill? Against all D-1 college basketball? Or against KU-level point guards? Let’s first compare his stats to other KU point guards from their sophomore years.
This list contains the sophomore-year stats of all players in the Self-era who were the primary starting PG for their team in at least one season. We want to compare Harris as the starting PG against other starters. For this reason, guys like Mario Chalmers (he played some point, but was never the primary starter at that position) and Niko Roberts (never started) are left off, and guys like Elijah Johnson (who was an off-guard most of his career until he became the PG as a senior) are included.
The list is sorted by highest PPG total. Looking at the comparison, we see Harris below everyone except Elijah Johnson, who played 13.7 MPG on a loaded 2011 team and was behind 4 other guard-types. Harris has relatively good numbers when it comes to ball-handling stats (assists, turnovers) and steals. His rebounding and shot attempt numbers don’t look great.
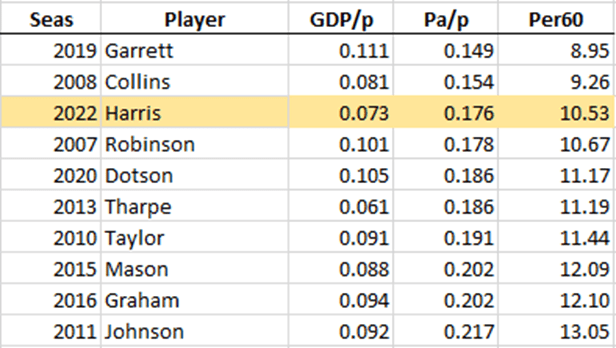
But what about his defense? Unlike traditional stats, Charting the Hawks has the ability to judge defensive skill-level more robustly, and not just steals, fouls, rebounds, and blocks. Let’s take a look at these 10 player-seasons from the defensive side of the ball.
note that Robinson’s junior year is used here, as his sophomore year isn’t fully charted
Some explanation here is helpful. This list is sorted by Pa/p or Per60 columns, with lowest being better. Pa/p stands for Points Against per Possession. This shows how many points the player gave up per possession. This number is set to Per 60 possessions (about 35 minutes of game play) to make it more intuitive. Harris is third among his peers in the Self-era in this category.
The GDP/p refers to Good Defensive Plays per possession. This refers to the number of rebounds, steals, blocks, and non-steal forced turnovers a player contributes on the defensive end. We note that Harris is second-worst on this end, as his rebounding totals are below his peers.
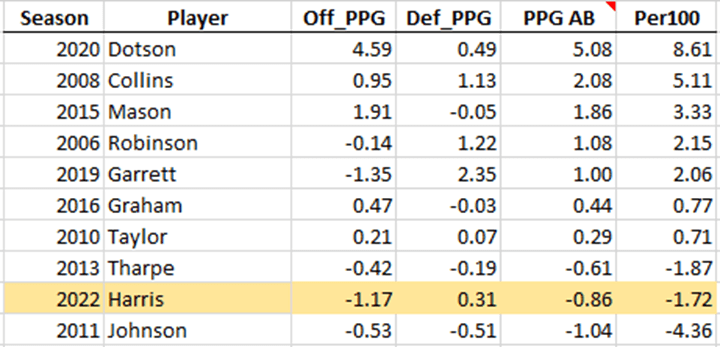
Player value is best seen by putting everything together. All relevant offensive and defensive metrics makes the total player. Glancing above, we know that Harris is a solid defender and good ball-handler. These are two skills associated with point guards. However, we also see he doesn’t do much else, even when compared to other point guards.
Robinson’s sophomore year is used here, as we can estimate his value score using box score data for games not charted
The final table sorts these 10 players by PPG AB +/-. Harris comes in 9th of 10, only ahead of 2011 Elijah Johnson. The Per100 column is also useful, as it looks at player value from a per (100) possession basis to account for playing time differences. Here Harris grades out slightly higher than 2013 Naadir Tharpe.
Breaking down Harris further, we see his offense only bettered that of 2019 Marcus Garrett. His defense came in around average, and this was in large part due to his rebounding. Had he rebounded at a rate of Devon Dotson (3.5 DRPG), he would have been the second-best defender on this list and had a PPG AB +/- value score that was positive.
The irony of Harris is this. When you examine “pure” point guard skills such as defensive pressure, steals, forced turnovers, ball-handling, assists, turnovers, and free throw shooting; Harris is solid and one of the best. But when you add the other elements of basketball not always associated with PG’s—such as scoring volume and rebounding—Harris’s value diminishes. Point guards don’t have to rebound much, but they have to get enough boards. And they don’t have to lead the team in scoring, but they still have to be a capable enough option that it forces other teams to guard them.
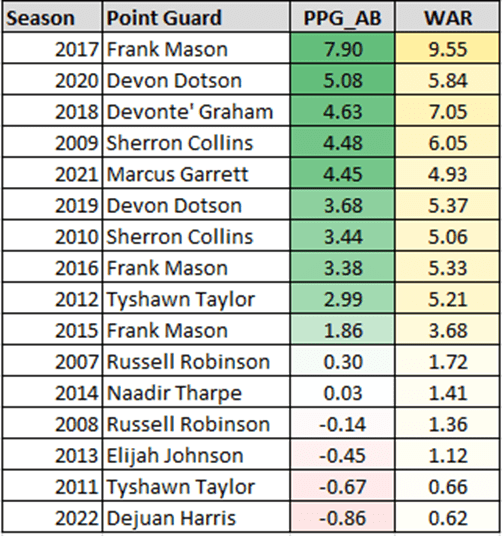
Last, the final table looks at the seasons all starting point guards have had since 2007. This is different in that it compares PG’s of different classes—freshman, sophomore, junior, and senior.
Value produced by KU starting PG’s from 2007-2022
Here we see Harris in last. The WAR is Wins Above Replacement, with replacement-level equaling the average D-1 player. This is estimating that Harris gave KU an extra 0.62 wins above the average D-1 player getting his minutes. So even if Harris has been at the bottom of starting point guards in the Self-era, he can still add value.
Looking ahead to 2023:
For the upcoming season, we expect Harris to improve on his 2022 campaign. College players tend to improve season-to-season. As Harris plays a larger role, expect his scoring to improve. But we also want to see gains on his rebounding numbers. There were multiple times when he allowed an offensive rebound, which gave the opponent a good-look at a score (see 3:42 here: https://www.youtube.com/watch?v=AIMOY6CoQKI Harris drifts away from his man instead of blocking out and watches his man tip the ball out for an open 3). By just adding a little more physicality to his game, he can add a rebound per game or so which will lift his value alongside other improvements to his game.
Charting the Hawks has Dejuan Harris’s 2023 season with a -0.28 projected PPGAB. But this is merely an objective estimate using trends of player improvement. Players improve by an average of around half a point per game per season. But some improve more than this, while some actually decline in value. Don’t be surprised if Harris makes a big leap from sophomore to junior year.
The 2007 Kansas Jayhawks finished with a record of 33-5 (14-2), winning both the Big 12 Regular Season and Conference Tournament. The team earned a 1-seed in the NCAA Tournament and reached the Elite 8 before losing. The team’s Sports Reference link is here.
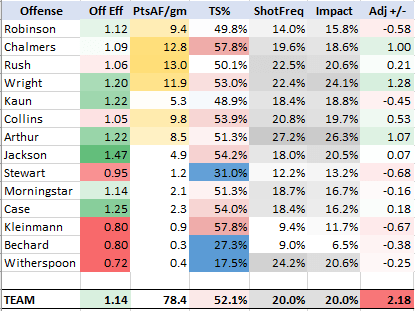
Offense
The 2007 offense was worse than people may remember, finishing 29th in Adjusted efficiency according to KenPom. The team’s most productive players were Brandon Rush, Mario Chalmers, and Julian Wright–each producing more than 10 points a game. Chalmers, with a TS% of 57.8%, was the team’s most efficient shooter.
There was good balance among the rotation players, with Darrell Arthur posting the highest shot frequency of 27.2%. Russell Robinson was the opposite end, distributing more than shooting from the PG position.
In total, the 2017 team produced some decent but not spectacular offensive seasons. Wright, Arthur, and Chalmers were all above +1.00 PPG in value. Freshman Sherron Collins was also positive, with Rush and Darnell Jackson barely above 0.00.
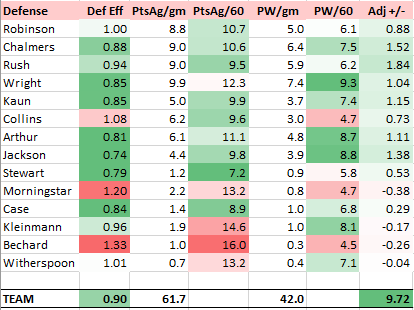
Defense
On the other side of things, the 2007 defense is Bill Self’s best defensive team and the best since at least 1997. The team held 7 opponents to under 50 points during the season. Brandon Rush led all rotation defenders by allowing 9.5 points per 60 possessions, with Sherron Collins, Darnell Jackson and Sasha Kaun also posting solid coverage stats. Additionally, reserves like Rodrick Stewart and Jeremy Case defended solidly in their limited playing time.
The team also had balance in winning possessions. Forward Julian Wright led the team in getting the ball back after a defensive stop with strong defensive rebounding, but guards like Mario Chalmers and Russell Robinson got plenty of stops with steals and forced turnovers. The team also blocked tons of shots, finishing second in the nation in block% according to Pomeroy.
The team’s top 10 players (in minutes played) all finished with positive defensive scores, the only time a KU team has done this on record. Rush, Chalmers, Jackson, Kaun, Arthur, and Wright all finished with value scores above +1.00, with Robinson and Collins not far behind.
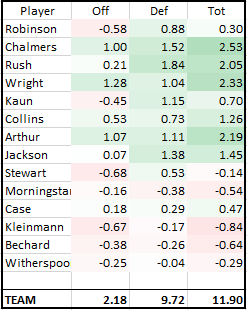
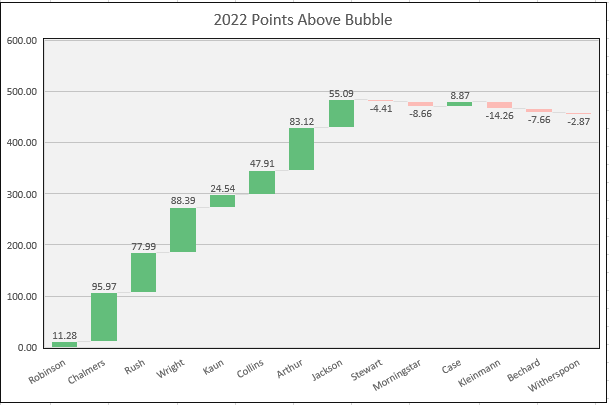
Adj. PPG +/-
The 2007 team was incredibly balanced, with no true stars but no weaknesses either. Chalmers, Wright, Arthur, and Rush all finished above +2.00 in value; in addition Jackson and Collins added over +1.00 points per game in value. It’s top 8 players were all positive contributors against bubble-level.
The TEAM score of +11.90 was KU’s first +10 score (roughly equating to a 1-seed level performance) since Bill Self began coaching at Kansas.
Mario Chalmers contributed the most value of any player. But not far behind him were Julian Wright, Darrell Arthur, and Brandon Rush. The 2007 team didn’t have a “best” player, but a bunch of very good ones.
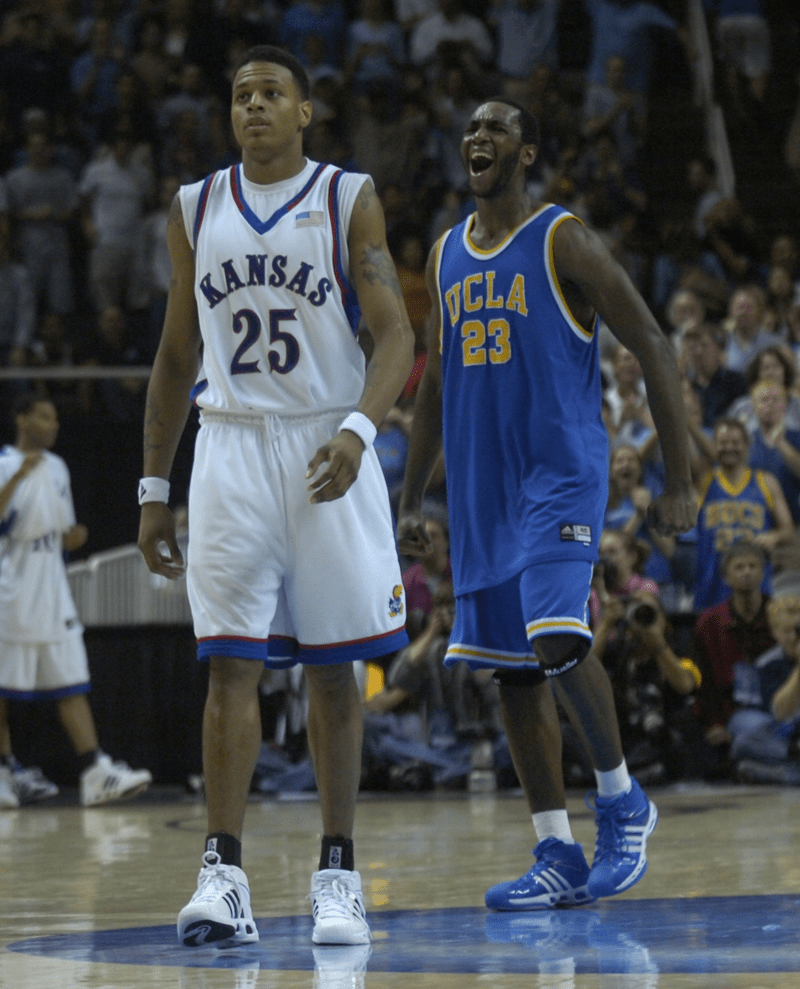
Elite 8 Run
After getting bounced in back-to-back opening rounds in the NCAA Tournament, Bill Self and his players were ready to put the past behind them and make a deep run. Earning the final #1 seed, the Jayhawks cruised past Niagara in the Round of 64, and then defeated #8 seed Kentucky in the Round of 32. A defensive struggle in the Sweet 16 saw Kansas get past #4 seed Southern Illinois, only to lose in the regional finals against UCLA.
It was a tough ending to a successful season. But KU was back. The program, despite a few rocky seasons, had reestablished itself as one of the top teams in college basketball.
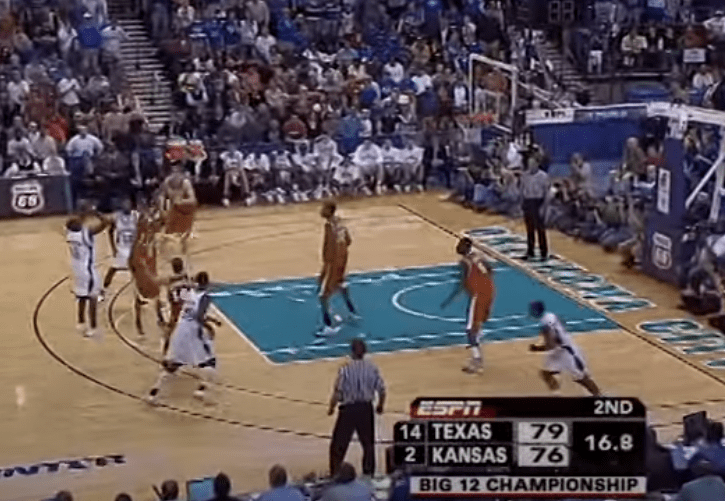
Brandon Rush would return for his junior season in ’08 after an ACL injury following the ’07 season.Julian Wright played his final game as a Jayhawk in the 2007 season. The Mario shot before “the shot.” KU ran same play as they would a year later. This one sent Big XII Tournament Championship game to OT, which would then be won by Kansas 88-84.
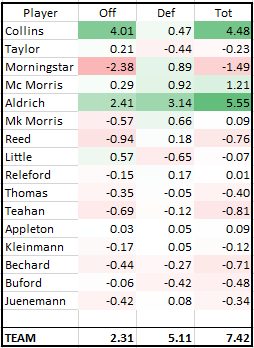
The 2009 Kansas Jayhawks finished 27-8 (14-2), winning the Big 12 Regular Season. The team earned a 3-seed in the NCAA Tournament and made the Sweet 16 before losing. The team’s Sports Reference link is here.
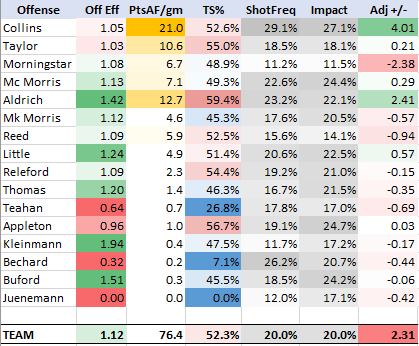
OFFENSE
The 2009 offense was led by junior point guard Sherron Collins, who produced 21 points a game, shooting 29.1% of the time. He added 4.01 points of value above a replacement-level player. Collins’s efficiency was low due to the need for him to generate so much offensive opportunity for the team. Sophomore center Cole Aldrich had a strong true shooting percentage of 59.4%. A solid offensive rebounder, Aldrich was the team’s most efficient rotation player and provided +2.41 points of value. Junior Mario Little was the team’s third-most valuable offensive player, buttressed by strong rebounding and low turnover numbers. Freshmen Marcus Morris and Tyshawn Taylor were the other two rotation players to add value on offense.
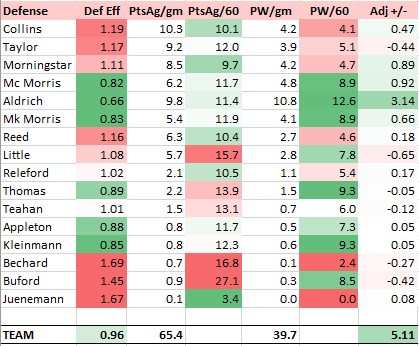
DEFENSE
On defense, Cole Aldrich anchored the team to the tune of +3.14 points of value per game. Aldrich was able to dominate inside, blocking shots and rebounding the ball, limiting easy baskets and second chance opportunities. The other Jayhawks did their part on this end, with Marcus Morris and RS junior Brady Morningstar adding nearly a point of value each. The team’s defense was what carried it.
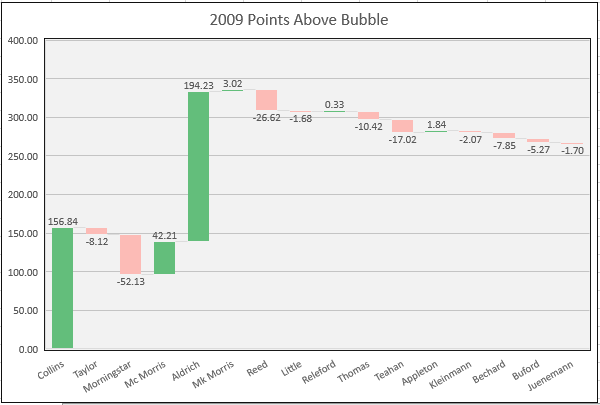
Total Adjusted PPG +/-
Cole Aldrich was the team’s most valuable player for the 2009 season, and had the 8th most-valuable season for a Jayhawk over the 26-season period of 1997-2022. With the caveat that not all defensive information was available for this season, Aldrich graded out as the best interior defender in the Bill Self era (2004-2022). His running mate Sherron Collins was not far behind, generating his value from offense. Collins posted only 1 of 10 +4.00 offensive value scores from 1997-2022. Marcus Morris was also a solid piece for the 2009 team, as his +1.21 score was nice value from a true freshman.
This chart helps to visualize where KU was getting its value. Brady Morningstar, who finished second in minutes played, likely played too much given his low offensive output. With multiple newcomers, the team relied heavily on its key returnees and hoped that its role players would do enough to keep the team competitive. For the most part, this was the case.
The 2009 team won the Big 12 Regular Season title, KU’s 5th in a string of 14 in a row, and had two solid outings in the NCAA Tournament to avoid potential upset bids and make the Sweet 16. With a rematch against a Michigan State team that soundly beat them the first time, Kansas jumped out to an early lead but lost control down the stretch and ultimately, also lost the game. Following the 2008 championship and departure of so many key players, the 2009 season was proof that Kansas was the caliber of program that would reload, not rebuild.
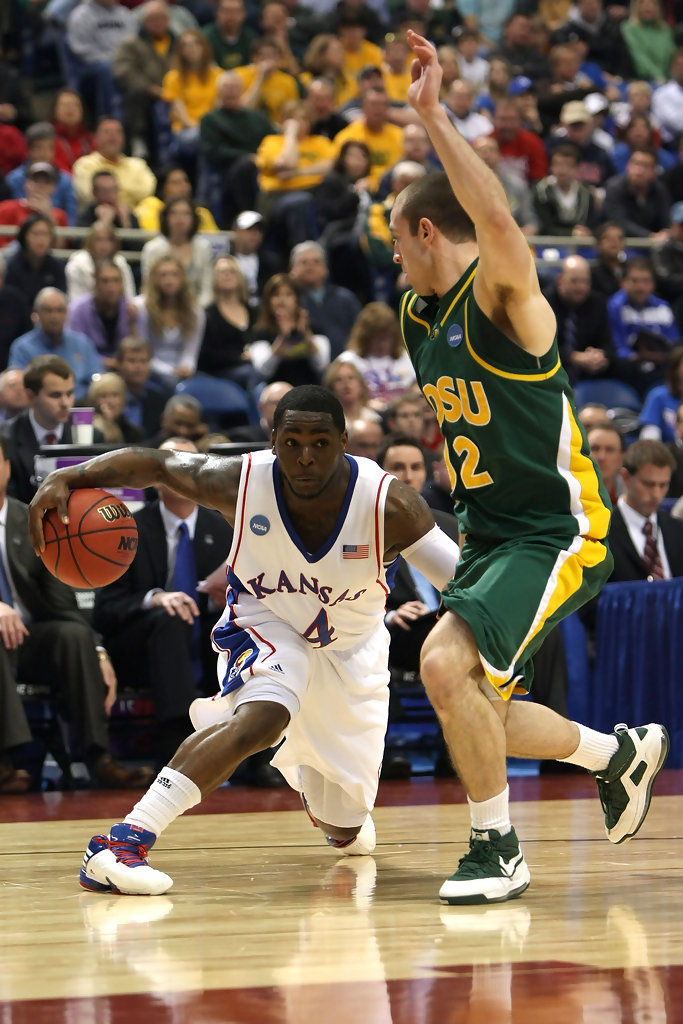
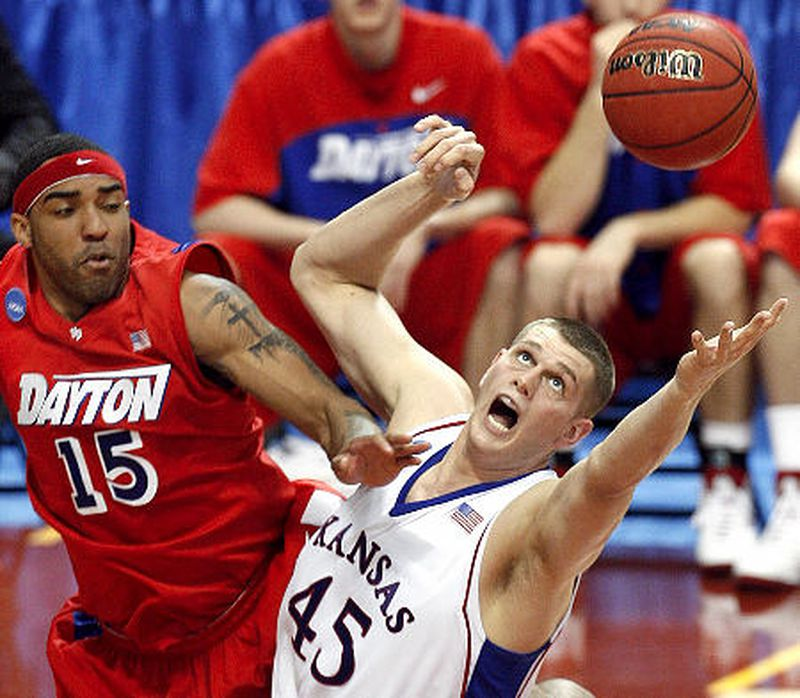
Sherron Collins scored 32 points in KU’s R64 84-74 win over NDSU.Cole Aldrich had a triple-double in KU’s R32 60-43 win over Dayton
In the Bill Self era, KU famously has as many home losses as conference championships. No team has won more than twice against Self at home, and many fans can recall each loss Self has had in the Fieldhouse from memory.
Just how good is Kansas at home? Since the 2010 season, the Hawks have complied a 197-10 record at Allen Fieldhouse. This is obviously amazing when compared to other programs, but how much of this record is due to the talent and coaching on Kansas, not the building? After all, Kansas is 77-36 (.681) in conference road games since the 2010 season. So perhaps the mystique of Allen Fieldhouse is merely just Kansas’s sustained talent alongside a home court advantage common across college basketball. If you shipped the talent Kansas has had over the years to Bloomington or Storrs or Baton Rouge, would you see similar home court records at Indiana, Connecticut, or LSU? Or if Allen Fieldhouse really is special in its ability to deliver wins, how can this be quantified?
The answer comes from predictive analytics. We’ll use Ken Pomeroy’s predictions, since they are the most famous in college basketball and tend to be the most accurate.
Pomeroy’s website contains a treasure trove of statistical information, but more than this, his system also attempts to most closely predict the final margins and winners of college basketball games. His background in meteorology has helped him forecast college basketball results with accuracy. The point is that his predictions can be used as a serious, accurate, objective standard.
One feature Pomeroy includes is home-court advantage. On his website, he notes that his is calculated by taking the last 60 home and road conference games, and finding the difference. KU’s home-court advantage is well-above average, but not close to the top (37h) at 3.8 points per game. If we were to conclude from this rating alone, we’d have to place Allen Fieldhouse not even in the top half of the Big 12, as Kansas St., Oklahoma, TCU, Iowa St., Texas Tech, and West Virginia all have better home-court advantage scores.
But I don’t see this stat as being indicative of home court advantage alone. In fact, it is just as likely to be a measure of poor road performance. The poorer a team does on the road, the better its home performances look by comparison. As mentioned above, KU has won over 2/3 of its conference road games since 2010. We don’t want to unjustly count KU’s road performances against it when assessing Allen Fieldhouse as a home court advantage.
Not Points, But Wins
Point differential and wins are two separate things. The two are interrelated, but the statement we intuitively know is true and want to show mathematically is not that Allen Fieldhouse produces large point differentials for KU (although it does do that often), but instead that it produces wins for KU.
Up to this point, we’ve established that Pomeroy makes accurate and objective predictions. Pomeroy’s system is a computer algorithm; it’s based on trends and correlations from large data sets. There are no biases; the computer doesn’t care which team name is which to next point total number. Pomeroy is using game data from all 350+ teams to make his predictions, making the model applicable across all of D-1 basketball. He also tests his predictions to ensure accuracy.
For instance, let’s say KenPom has a game where Team A is favored to win over Team B and is given an 80% chance of winning. Team A is expected to win, but if Team B won it would be a mild upset since this result would be expected to occur 1/5 of the time. Over the course of a season, or multiple seasons, we can test all games which featured one team with an estimated winning percentage around 80%. If the actual results of this collection of games turn out to be wins for the favorites about 80% of the time, then we know the prediction system is fairly well-tuned. If the results are off by some factor (perhaps these favorites won 70% or 90%), tweaks need to be made somewhere. This ability to fine-tune the model leads it to be more accurate, which makes it trustworthy. And this is in fact what Pomeroy does.
This is just the system we need to test Allen Fieldhouse. Note that in Pomeroy’s system, KU’s inherent skill level is accounted for. His predictions consider the talent of the players and level of coaching. Also, whatever amount of point value inherent to Allen Fieldhouse is also factored in. What we should be left with is a purely unbiased and accurate gauge of how much Allen Fieldhouse helps KU in terms of wins.
To test this, we will take each Kansas home game and the predicted win percentage at the time, and then compare to the results of what actually happened. Pomeroy’s site began offering probability predictions for the 2010 season, so we will begin here and go through 2022. For instance, KU’s first home game of the 2010 season was against Hofstra, in which the Jayhawks had a 98.7% chance of winning. KU did end up winning, so, it earned 1 – 0.987 = +0.013 Wins above Expectation (WAE).
As we continue this exercise for each game played over that period, we should expect the WAE to be around 0.000. Remember that the skill level of Kansas and home court advantage has already been built into the predictions. Remember also that Pomeroy tests his estimated win percentages, so we should be getting accurate prediction ratings for a team with the skill level of Kansas and a generic home court advantage. Anything substantially more or less than 0.000 needs explanation.
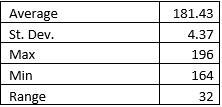
For KU, they have a WAE at Allen Fieldhouse since 2010 of, drum roll, +15.50. With a population of 13 seasons this is at a rate of over 1 more expected win per season. It’s difficult to stress how ridiculous this level of winning is. Instead of being 197-10, a team as good as KU has been against the same quality of opponents KU faced on the parameters of a normal home court would have an expected home record of 181-26. This is the difference between a 95.2% winning percentage and 87.7%, not a slight difference. Using Odds Ratio, Allen Fieldhouse has produced 2.77 times better results than expected.
Looking at each year individually, we see that only in 2018 (14-3 record) did KU have a negative WAE. Every other season was above expectation. 2018 was also the only season that KU lost more than 1 home game over this span.
We can also test how likely it is for KU to have an undefeated home record given its opponents. Since 2010, KU has had undefeated home seasons in the following: 2010, 2012, 2015, 2016, 2019. 5 seasons out of 12 isn’t bad; but how many would we expect KU to have?
Using similar methods, we can calculate the independent probabilities of an undefeated season for each season, and then add the results to see how many we would expect. For instance, for 2010 we’d predict that Kansas has a 38.5% chance of going undefeated. Since it did go undefeated at home that season, the 2010 team earned 1 – 0.385 = +0.615 Undefeated Seasons above Expectation (USAE). After calculating all years 2010-2022, we come up with an expected 1.749 undefeated seasons, or a +3.251 USAE. Note that even 2 undefeated home seasons would be above expectation, since over the course of 15, 16, or 17 games the math says that you should trip up at least once. But KU has managed to avoid defeat at home in five of these seasons.
Testing the Results
The first way to test these results is to run a simulation to see how frequently KU finishes with a WAE of +15.50. A quick simulator on Excel was built, and 10,000 sims were run. Here are the results, in terms of wins (out of 207 games played):
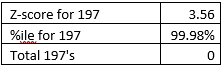
As you can see, assuming a random distribution of performances in terms of win/loss, the maximum number of wins KU achieved was 196 under 10,000 simulations. This is actually fewer than the total of home games KU actually won in this span. Looking at the 197-win mark, we can calculate how statistically rare such a feat is:
The z-score counts standard deviations, so 197 wins is 3.56 standard deviations above average. This works out to a 99.98 percentile. Out of 10,000 simulations, not once did KU reach the 197 wins at home. Given the distribution, we’d expect them to reach this win total once out of 5,453 simulations, which is a bit more common than 0 out of 10,000 but still a rare instance. KU’s success at Allen Fieldhouse has been off-the-charts.
Further Study
If anything, these numbers are undersold. Remember KU went undefeated in 2009 and 2008. If we stretched it back to the 2004 season, the first year of the Self-era, Kansas would be at 255 wins to 16 defeats, a slightly lower winning percentage but an overall larger population of games. The z-score might move even further right.
(Although we don’t have KenPom pregame win probabilities for these seasons, they can be reasonably estimated given opponent quality. It would take more work, and they wouldn’t be as precise as what a predictive model would have estimated. We will keep the (real) results for now, with the option of adding seasons 2004-2009 as an amendment so that the entire Self-era is captured).
A Free Lunch, Taking KU at Allen Fieldhouse on the Money Line
Outperforming an accurate and fine-tuned prediction model is noteworthy enough, but certainly Vegas would be tough to beat. After all, after years and years of KU winning such a high percentage of its home games, shouldn’t the betting market reflect the magic of the Phog?
It turns out the answer has been no. We won’t bury the lead on this section. You were guaranteed to win money if you bet a consistent amount money on KU to win each of its home games over any part of the past 15 seasons. Read that again. You could have started this strategy the first game of the 2008 season, or even for the Kentucky game this season that KU ended up losing. Bet a consistent amount on the Money line for KU to win outright and you will end up in the black.
KU has been 234-10 in AFH since the 2008 season (so games beginning in November 2007). Let’s set a consistent betting amount of $10. So, regardless of opponent or history, the strategy is to bet $10 on Kansas to WIN straight up on a Money Line bet.
Not all KU home games have had a Money Line, at least according to the archives. The first game in this span I could find that had a Money Line was KU’s November 2007 game against Northern Arizona, at -10000. Betting $10 would have netted you $0.10 for the KU win that game. Fast-forwarding to today, if you had kept at this strategy, you’d have $183.07, an increase 18x your initial investment.
To compare the increase of the S&P 500 over that period, if you started with $10 and let it sit in the market, you’d have about $30 today. Betting on KU to win at Allen Fieldhouse has proven to be a better long-term investment than the stock market. Anyone with a background in finance or betting markets knows how absurd this is.
Another way to look at this is to see how much the market would have to move on these games to make it efficient. In order for a better to have exactly $10 after betting $10 on each of these games, the Money Lines would have to collectively move 2.87 times what they were (so if KU was -10000, it’d have to be -28000; if KU was -275 it’d have to be -789, etc.).
Other Questions for Future Analysis
Switching gears some, it would be good to see how well other home courts do at converting wins. Clearly some teams will see better win/loss results than expected at home than other teams, this is the nature of statistics. But how well do other bluebloods, such as Kentucky and Duke perform? What about teams like Purdue; exactly how many wins has Mackey Arena been worth? Or is Hilton Magic real? Remember, since a team’s skill has already been factored into the pregame predictions, we should get apples to apples comparison regarding home arenas only, since team skill differential has been accounted for. The problem is that this data must be scraped, so it makes it time-consuming to try and build up any dataset. Maybe it would be prudent to start with a few big schools (Duke) and go from there? But there’s no way to avoid missing whatever home court has been the biggest advantage in terms of win/loss without running through every team, since that’s the very thing we’re looking for!
Conclusion
Allen Fieldhouse was worth over 15 wins over the course of the 2010-2022 seasons, propelling KU to an absurd 197-10 during this time. The chances this would occur by pure luck alone are at best 1/5000, indicating that something has happened in that building (crowd support for KU players lifting them up, opponents feeling pressure, refs being affected by the crowd, etc.) to get the team wins it otherwise wouldn’t have gotten. Whatever the reason, you can conclude this. Until proven otherwise, Allen Fieldhouse is the biggest homecourt advantage in college basketball and probably in all of sports. A 3.56 Z-score and 99.98 percentile is very unlikely to have been matched by any other arena during the past 13 seasons.