KU’s 24-point win against a hapless Oklahoma State team last night boosted its KenPom rating to +22.27, which is good enough to be 14th overall as of January, 16. There’s been some debate about the accuracy of KenPom’s system, as it appears to reward teams more for blowing out bad teams than beating good ones in close games.
Without getting into a longwinded opinion about what KenPom is “about,” I wanted to explore what I call a team’s “Game Score” and see if, in theory, a good team could improve its KenPom rating by scheduling easier.
First, let’s discuss Game Score. Game Score is the attempt to quantify how good a team’s game is by adjusting the final margin depending on the opponent and location. That is, a 10-point home win against a team ranked 250th would be much less impressive than a 10-point road win against a team ranked 25th. Game Scores tie to KenPom’s ratings in a few ways. One, they use KenPom’s Adjusted Efficiency numbers to determine opponent strength. Two, they are linear or rely on a linear system to compare game performances, just like KenPom. If a team is projected to win by 10 and it wins by 15, the team’s KenPom rating will climb. However, the hypothesis is that a good team can have a higher average Game Score (and in turn elevated KenPom rating) by playing an easier schedule, because it is easier to “juice” a winning margin in games already in hand. When playing an overmatched opponent, leaving in the starters just a few extra minutes can be the difference between say, a 25-point win or a 30-point win. The Game Score will increase by 5 points as well, as the opponent adjustment is already baked-in.
To test this, we will use KU games over the past few seasons. Kansas has been consistently good over this period and is a good team to use. My theory is that there will be an inverse relationship between Game Score and opponent quality. Remember, in theory, opponent quality should neutralize the effect of the actual margin, making Game Score independent of opponent quality. Does reality show this to be the case?
KU has played 229 official games since the beginning of the 2018 season (November 2017). These games have been played against a variety of opponents, some good, some not. Will it be easier to produce higher Game Scores against worse opponents than better ones?
Results
There was a small inverse correlation between opponent quality (opponent’s KenPom rating) and Game Score. While this might seem insignificant at first, it can make a difference when we look at the results.
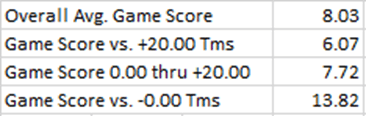
Since 2018, KU is averaging a +8.03 Game Score. This just means that KU is beating its opponents by an average of about 8 points more than a typical bubble-team would. When we break it down into buckets by quality of opponent, we see a clear trend. Against the best teams in the country, those with a +20.00 KenPom rating or higher (roughly your top 15 to 20 teams, depending on year), Kansas is only producing a Game Score of +6.07. Against decent to okay teams, those with a KenPom rating from 0.00 to +20.00 (corresponding to ~ 20 – 180), Kansas is producing a Game Score of +7.72. The best Game Scores are those against inferior opponents, those with a negative KenPom rating or who are worse than the average D1 team. KU is, on average, +13.82 in these games.
What this shows is that, over the past 7 seasons, KU is more likely to climb in KenPom when it plays games against easier opponents. As KenPom is trying to account for opponent strength already, it does give strong credence to the idea that teams who play a weaker schedule are juicing their KenPom scores by doing so. This would apply to teams like Gonzaga in past seasons, but also to the non-conference schedules of Houston and BYU in 2024.
What we’ll next show is the expected KenPom ratings/rankings for a hypothetical Kansas team that is as strong as the average KU team since 2018.
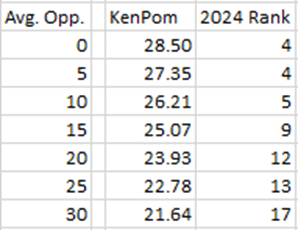
The first column looks at the average opponent KenPom rating, and then projects this hypothetical KU team’s KenPom rating. The next column is the KenPom ranking for additional context. We see that as the average opponent score climbs, the KenPom rating/ranking for hypothetical Kansas worsens. A schedule of 0.00 opponents would allow Kansas to juice its score all the way to a #4 ranking this season. If it played a schedule against top-tier opponents, like it will in stretches of conference play, this ranking drops out of the top 10.
An additional level of data relates to the 374 games played since the 2014 season. KenPom provides pregame point differential estimates as well as winning percentage estimates (effectively odds). With this info, we can make the prediction that KU will “overperform” in easier games compared to games where the margin is expected to be smaller. In the 90 games where KU had a 90% chance or greater of winning, that is the easier games, KU has outperformed its expected KenPom margin by +2.41 points per game. In the 284 other games, the games expected to be closer, KU is outperforming KenPom expectation by only +0.49 points. This accounts for a difference of 1.92 points per game, or roughly 2.74 AdjEm on KP. Again, this is further confirmation that good teams can juice their KenPom ranking by playing an easier schedule.
Relevance to the 2024 season
This is relevant to Houston, a team which has a non-conference average opponent rating of -1.21 (215th), as well as BYU, a team which has a non-conference average opponent rating of -5.01 (307th). For Houston, if we look at its 6 games against Top-100 opponents, we note that it has performed where a team with a KenPom score of +27.39 would, or nearly 5 points lower than its current (juiced) +32.31 rating. Only looking at conference-play against Top-100 opponents, a small sample size for sure, its comparable KenPom score is +21.82.
BYU’s 7-game slate against Top-100 opponents has it 4-3, with an estimated KenPom rating of +20.14. This is the difference between 9th or 20th. Again, we’re seeing evidence that a team’s KenPom rating is aided by blowing out inferior opponents. For both Houston and BYU, their overall schedule strengths will get better, meaning that what KenPom says about them in March will include more data against strong opponents. As both are good teams, one shouldn’t write either of them off. But what Purdue (best overall schedule) or Wisconsin (surprise team around BYU’s ranking yet has a solid SOS) have done so far should give them the nod ahead of teams similar to them in the KenPom totem.
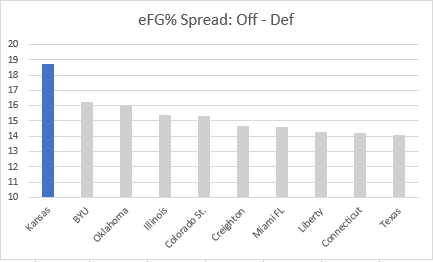
We can use Bart Torvik’s filter tool to explore this phenomenon more. While Torvik has different inputs than Pomeroy, he is attempting to do the same thing. If we only look at opponents that are Quad 2 or better (using NET), we see that Purdue is best (and better than Houston by almost 7 points per 100 possessions. Houston is slightly better than Purdue accounting for all games). Similarly, BYU is 26th best when playing top opponents, as opposed to 7th when all games are included.
Determining the Best Teams
So, who is the best team in the country? How much should advanced metrics be considered? Keen observers will note that, in criticizing KenPom’s rating for Houston or BYU, I still used KenPom numbers. That highlights the inherit difficult of any ranking system. Rankings are relative, they depend on how good others are. KenPom’s value is that the system provides a fairly accurate look at each team’s relative strength compared to any other of D1’s 362 teams. If a system makes adjustments to remove Houston or BYU’s blowout wins, it underestimates their strength relative to a team outside its Top-150. So for any advanced rating system to be most accurate, not just accurate among a certain range of teams, it needs to include all game data.
For the purposes of college basketball, the only important rankings are those of the selection committee preparing to set the field for March Madness. The selection committee gets criticized, sometimes rightly, but those who want to do away with the committee and institute a computer-based ranking system (such as WAB) are completely misguided1. Even the most well-known advanced rating system has noticeable flaws. The committee’s focus on strength of schedule (dissuading teams from scheduling cupcakes in the non-conference to artificially boost their overall record) appears to be a good thing. It looking at a team’s best wins or worst losses will also filter out noise, allowing a better comparison between teams near each other on the seedline.
Summary
Teams have an easier time improving their advanced metrics by playing a softer schedule that allows for blowout wins. Teams that’ve achieved high rankings by playing a strong schedule should be seen with less skepticism than teams that have mostly blown-out lesser opponents. Still, let’s not be overly critical toward systems like KenPom, which are trying to rank all teams (not just the top 50 or whatever).
The only real ranking that matters is the NCAA Committee’s “S-curve” on Selection Sunday. While the committee does get things wrong, it has avoided errors by not adopting a metric-dependent system like some of its detractors demand.
1- Gasaway states the following in his appeal to do away with the Committee: “Whether your preferred metric is wins above bubble (WAB), strength of record (SOR), or something similar, any team’s record can be evaluated according to how difficult it would be for other teams to achieve the same result against the same opponents in the same venues. Wins are the key metric, as they should be, and teams can excel whether their schedules turn out to be grueling or unexpectedly soft.” (Links in original).
His assumption is faulty. We cannot confidently say that WAB or SOR are accurate enough when its been shown that the advanced metrics themselves understate how easy it is for a good team to blowout a bad one. This isn’t to say that WAB or SOR cannot be tools that an informed committee uses, but a committee-less NCAA Tournament selection process that only looks at a computer metric would reward teams that dominate against a light schedule and punish teams that take some lumps in tough conferences but still finish around 19-12.