Since 1985, (before 2022 Tourney) here are how seed-lines have performed in the NCAA Tournament:
There have been 36 tournaments (1985-2019, 2021). With 4 of each seed-line during each tournament, there have been 144 total teams for each seed line over this time period. This gives us a healthy sample from which to make observations.
Let’s begin by tracking overall tournament wins per seed line.
| Seed | Wins |
| 1 | 3.46 |
| 2 | 2.42 |
| 3 | 1.90 |
| 4 | 1.56 |
| 5 | 1.14 |
| 6 | 1.10 |
| 7 | 0.93 |
| 8 | 0.73 |
| 9 | 0.61 |
| 10 | 0.64 |
| 11 | 0.66 |
| 12 | 0.54 |
| 13 | 0.26 |
| 14 | 0.17 |
| 15 | 0.08 |
| 16 | 0.01 |
The 1-seed averages 3.46 wins per tournament, the 2-seed 2.42 and so on.
Round 64
The table below is fairly self-explanatory. FavTP is the average total points for the favorite (better seed), and the UdTP is the underdog (worse seed) average total points for each seed matchup. Point differential and winning percentage (for better seed) is then shown.
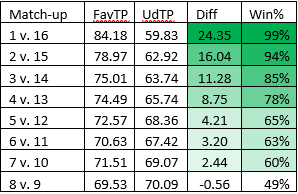
One thing to note is that only the top 3 seed lines are expected to win their games by double-digits. The 4-seed wins by 10+ less than half the time. Another notable factor is that the 5/12, 6/11, and 7/10 games are fairly close to one another in terms of point differential and favorite win percentage. The 8/9 is almost a true coin flip, but the 9 seeds have actually had slightly more success to this point.
There is a clear drop-off from the 1/16 to the 2/15 games. It is actually the starkest drop-off in terms of winning success. 1-seeds are 143-1 in Round 64 NCAA Tourney games; it is almost a bye game to the next round for the top seeded teams. To illustrate the relative performance by seed line, observe the following table. This table compares a favorite seed (seeds 1-8) against the next seed line down in terms of winning success. So we compare 1 v 2, 2 v 3, etc. and see how much more successful the better seed-line is than the next line down.
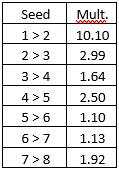
This table shows that a 1-seed is 10.1 times more likely to win its R64 matchup than a 2-seed. To be certain, 2-seeds are relatively safe to advance this round. But 1-seeds are just this much likelier to advance. As we go down the chart, we see that difference between seed lines shrinks. 5-seeds are barely better than 6-seeds when it comes to getting out of the First Round. If your team is projected to be near one of these seed lines or the other, getting that extra bump up a seed line can matter.
Round 32
When we get to this round, there become diverging possibilities with regards to which seeds play which seeds. For instance, a 1-seed can play either an 8 or a 9. A 4-seed which wins will play a 5 or a 12. This means that additional context is needed to understand how the bracket has historically played out.
Let’s start with the 1-seeds. Of the 143 top seeds which made the R32, 123 have gone on to win in this round (86%). Of the 20 which lost, interestingly 14 of these have lost to 8-seeds and only 6 have lost to 9-seeds. With the only 16-seed to reach this round falling to a 9-seed, this means that the 1/16/8/9 pod has had this many advance out of the R32 (to the S16):
1: 123 (85%)
16: 0 (0%)
8: 14 (10%)
9: 7 (5%)
Continuing on, here are how the 2/15/7/10 pods have gone:
2: 91 (63%)
15: 2 (1%)
7: 28 (19%)
10: 23 (16%)
Here are how the 3/14/6/11 pods have gone:
3: 75 (52%)
14: 2 (1%)
6: 43 (30%)
11: 24 (17%)
Here are how the 4/13/5/12 pods have gone:
4: 67 (47%)
13: 6 (4%)
5: 49 (34%)
12: 22 (15%)
The first thing that stands out is how good the 1-seeds are at getting out of the first weekend. At 85%, this is far more than the 63% of 2-seeds that make the S16 or beyond. Next, notice this effect on the 8 and 9-seeds. 10, 11, and even 12-seeds are more likely to make the S16 than the 8 or 9-seed because these worse seed lines avoid the 1-seed in the region. In fact, a 10, 11, or 12 is more likely to make the S16 than the 8 and the 9 combined.
The worse seed to make the S16 is a 15-seed, and this has been done twice. Two 14-seeds have also made the S16. We will focus on that round next.
Sweet 16
With another round in the books, the bracket possibilities can become even more complex. By this point, usually the entire country has seen its perfect bracket busted. If the bracket is chalk in a region, this is where the 1-seed faces the 4-seed and the 2-seed faces the 3-seed. Note that a 1-seed has faced a 4-seed 55 times (38.2%), and a 2-seed has faced a 3-seed 45 times in this round (31.3%). A Sweet 16 which has all four top seeds still alive should occur about 11.9% of the time. Since there are four regions (four occurrences), we expect a Sweet 16 with seeds 1,2,3,4 in any one of the same region to only happen in 2/5 tournaments. This just shows how crazy the bracket can get given the possible permutations and upset possibilities.
When we look at success, we see that 1-seeds have won 100/123 games in this round (81%). After accounting for those 1-seeds that have already lost prior to this round, we discover that 69% of 1-seeds make it through the S16. Below is the table showing how many of each seed-line makes it through, from the S16, to the E8:
1: 100 (69%)
2: 65 (45%)
3: 37 (26%)
4: 21 (15%)
5: 9 (6%)
6: 15 (10%)
7: 10 (7%)
8: 8 (6%)
9: 4 (3%)
10: 8 (6%)
11: 9 (6%)
12: 2 (1%)
No seed worse than a 12 has made it to the E8. We see the 1-seed power once again in how the results are skewed, as 5-seed is now less likely to advance than either the 6 or 7-seeds (and has the same number of E8 appearances as the 11-seed). By this point, the only seed expected to make it past the S16 more often than not is that top line. Even the 2-seed is batting less than 50%.
Elite 8
The Elite 8 round has with it additional pressure, as teams can taste a Final 4 berth. Interestingly, in this round the 1-seed does not have the best winning percentage. In fact, the 4,5, and 8-lines are all better than the 1-seeds. 5-seeds are 7-2 in this round, showing that if they can make it through, they do quite well in the later rounds.
Nevertheless, the 1-seeds get the most teams through this round due to the fact they get so many teams to this round. Of the 100 1-seeds to make the Elite 8, 59 have made the Final 4 (59%). Below are the teams to make it past the E8 and into the F4 by seed-line:
1: 59 (41%)
2: 30 (21%)
3: 17 (12%)
4: 13 (9%)
5: 7 (5%)
6: 3 (2%)
7: 3 (2%)
8: 5 (3%)
9: 1 (1%)
10: 1 (1%)
11: 5 (3%)
This handy graph helps you visualize the above:
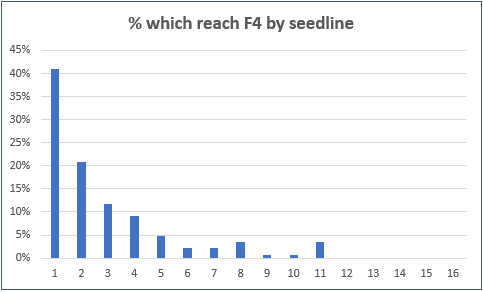
The 1-seed is nearly twice as likely to make the Final 4 as the 2-seed. There seems to be a steady decline in F4 frequency by seed-line, until you reach the 8-seed. It drops back down, until, surprisingly, the 11-seed pops back up with 5 teams making a Final 4. A curious case of how the bracket has unfolded, to be sure. 59% of the Final 4 features teams in the top half of the bracket (seeds 1,4,5,8,9,12,13,16); 41% of the Final 4 features teams in the bottom half of the bracket (seeds 2,3,6,7,10,11,14,15). This is, once again, due to the skew of the 1-seed.
Final 4
The Final 4 round, or National Semifinals, is the first round that can feature teams of the same seed-line facing off against one another (ignoring the First Four/play-in games). This has happened in 18 out of the 72 times (25%). In 13 instances, it has been two 1-seeds. In 3 instances, it has been a matchup of 2-seeds. Once it has been between 4-seeds, and once more it has been between 5-seeds. No 3-seeds have ever faced off against each other in this round.
Using the same idea as before, we track the teams which won in this round and made it to the next. Of the 72 teams which won a Final 4 game to make it to the National Championship game, this is how the result are broken down by seed-line:
1: 36 (50%)
2: 13 (18%)
3: 11 (15%)
4: 3 (4%)
5: 3 (4%)
6: 2 (3%)
7: 1 (1%)
8: 3 (4%)
A point of clarity may be in order. These percentages add up to 100%, which is to say that exactly half of all teams to make the national championship round have been 1-seeds. But this does NOT mean that a 1-seed has a 50% chance of making the National Championship game. To get those odds, you’d have to divide each percentage above by 2. So, a 1-seed has a 25% chance of making the NC game, a 2-seed a 9% chance, etc. given the historical precedent.
The 1-seed dominates this round again, showing that in a battle of attrition (which is the NCAA Tournament’s loser-go-home system), the best teams tend to last the longest. The final NCAA tournament “round” (the National Championship game) will be the final round examined.
National Championship Game
Even though 1-seeds occasionally face each other in this round, (7 times out of 36), the 1-seed has a winning percentage of 64%, and captures 64% of all NCAA Tournaments. This means that a 1-seed is more likely to win the NC game than the rest of the seed-lines combined. When a 1-seed has faced a team of a different seed in the NC game since 1985, it is 15-5 (.750). For whatever reason, the best seed-line seems to outperform in this round. In fact, 4 of the losses that the 1-seed had against non-1-seeds were before 1998…since that year only 2-seed Villanova in 2016 has knocked off a 1-seed in the NCAA title game.
Below are the proportion of national champions by seed-line. Once again, these aren’t the odds of a team on that seed line winning the NC (you’d have to divide by 4 to get the odds of any one team winning), but rather how many national champions have that associated seed.
1: 23 (64%)
2: 5 (14%)
3: 4 (11%)
4: 1 (3%)
5: 0 (0%)
6: 1 (3%)
7: 1 (3%)
8: 1 (3%)
Once again, this is only data from 1985 on. Before the tournament expanded to 64 teams in 1985, there were lower-seeded teams like 1983’s N.C. State (6-seed) who won. But since ’85 the title has been mostly claimed by 1-seeds with some 2-seeds.
If anything, this trend is moving against underdogs. The 80’s saw multiple Cinderella runs, including 1985 Villanova (8-seed) and 1988 Kansas (6-seed). Since 2007, the only team that has won a National Championship outside a 1 or 2-seed is UConn (2011 as a 3-seed, 2014 as a 7-seed). There have been upsets and even Final 4 runs by double-digits seeds, but in the end it tends to be a 1-seed that wins it all.
538 Data
Since 2014, 538 has released March Madness models which project each team’s chances after the bracket is released and throughout the tournament. Using the pre-tournament data (but following the play-in First Four games), we will use these models to compare against the actual results. The reason to do this is to see if the historic results are close to what is predicted, or if the models think the seed-line success to follow a different distribution.
Starting with expected wins by seed, here is what 538 has projected in the 7 tournaments from 2014 – 2021 (with no tourney in 2020):
1: 3.12
2: 2.52
3: 1.83
4: 1.70
5: 1.29
6: 1.08
7: 0.86
8: 0.69
9: 0.64
10: 0.60
11: 0.59
12: 0.38
13: 0.21
14: 0.16
15: 0.06
16: 0.02
With more data, these numbers should become an even more accurate “predictor” of what seed-lines “should” win. Let’s now compare what 538 is saying seed-lines “should” win with what the wins the seed-lines have actually produced:
Seed Actual Wins Expected Wins Difference
1: 3.46 3.12 +0.34
2: 2.42 2.51 -0.09
3: 1.90 1.83 -0.07
4: 1.56 1.70 -0.14
5: 1.14 1.29 -0.15
6: 1.10 1.08 +0.02
7: 0.93 0.86 +0.07
8: 0.73 0.69 +0.04
9: 0.61 0.64 -0.03
10: 0.64 0.60 +0.04
11: 0.66 0.59 +0.07
12: 0.54 0.38 +0.16
13: 0.26 0.21 +0.05
14: 0.17 0.16 +0.01
15: 0.08 0.06 +0.02
16: 0.01 0.02 -0.01
The 1-seed has the biggest differential between “expected” wins and actual wins. 538 models have 1-seeds winning 0.34 fewer games per team per tournament, which isn’t a small number. On the flip side, 5-seeds are expected to win more often at 0.15 wins per team per tournament. 4-seeds are similar to 5-seeds. Clearly the 81% winning for 1-seeds in that Sweet 16 round is showing up in these differences.
We’ll next compare the Round of 64 games, the only games with set seed matchups (1 v 16, 2 v 15, etc.).
Matchup ActWin% ExpWin% Diff
1 v 16 99.3% 98.0% +1.3%
2 v 15 93.8% 95.3% -1.5%
3 v 14 84.7% 87.8% -3.1%
4 v 13 84.1% 78.5% +5.6%
5 v 12 64.6% 73.0% -8.4%
6 v 11 62.5% 61.8% +0.7%
7 v 10 60.4% 56.7% +3.7%
8 v 9 49.3% 51.2% -1.9%
As far as favorites go; 1-seeds, 4-seeds, 6-seeds, and 7-seeds have outperformed in the R64. For underdog seeds; 9-seeds, 12-seeds, 14-seeds, and 15-seeds have been better than expected. The biggest thing that jumps out is the 5/12 matchup, a trend many filling out their NCAA brackets have picked up on. The % difference can be misleading. We’ll now look at the expected number of wins (out of 144) for the better seed compared to what has actually occurred:
Better Seed in R64 Act Wins Exp Wins Diff
1 143 141.2 +1.8
2 135 137.3 -2.3
3 122 126.3 -4.3
4 113 121.1 -8.1
5 92 105.1 -13.1
6 90 89.0 +1.0
7 87 81.6 +5.4
8 71 73.8 -2.8
In terms of numbers, the 12-seed over the 5-seed is the biggest historic surprise. However, there is one better way to judge the performance of seeds against expectation.
Seed in R64 Multiple
1 2.887
2 0.736
3 0.775
4 0.688
5 0.655
6 1.030
7 1.168
8 0.926
9 1.080
10 0.856
11 0.971
12 1.526
13 1.453
14 1.289
15 1.358
16 0.346
What this shows is that the 1-seed has actually performed the best in the R64 compared to expectation. To best explain this, 1-seeds are expected to win 49.5 times more often than they lose in the Round of 64. In reality they’ve won 143 times more often than they’ve lost (143-1). This generates a 2.887 multiple (143/49.5). Moving down the line, 2-seeds are expected to win 20.4 times more often than they lose. In reality they’ve won 15 times more often, for a multiple of 0.736 (15/20.4).
Best seed-lines in the R64 by expectation:
1, 12, 13, 15, 14, 7, 9, 6, 11, 8, 10, 3, 2, 5, 16
Instead of comparing each round, we’ll move on to the Final 4 and see how seed-lines have done against expectation. Below shows the seed, actual frequency of the F4, expected frequency, and difference.
Seed ActF4% ExpF4% Diff
1 41% 39% +2%
2 21% 22% -1%
3 12% 10% +2%
4 9% 10% -1%
5 5% 6% -1%
6 2% 4% -2%
7 2% 3% -1%
8 3% 2% +1%
9 1% 1% 0%
10 1% 1% 0%
11 3% 1% +2%
12 0% 0% 0%
There isn’t a ton to say here. The numbers are fairly close to what is expected, with the 11-seed (unsurprisingly) overperforming.
Last, we’ll look at National Championships. This is similar to the F4 table above, but includes total NC’s by seed (since 1985) alongside percentage of national champions.
Seed ActNC ExpNC Diff
1 23 (64%) 18.6 (52%) +4.4
2 5 (14%) 7.8 (22%) -2.8
3 4 (12%) 2.7 (7%) +1.3
4 1 (3%) 2.9 (8%) -1.9
5 0 (0%) 1.3 (4%) -1.0
6 1 (3%) 1.0 (3%) 0.0
7 1 (3%) 0.5 (2%) +0.5
8 1 (3%) 0.4 (1%) +0.6
9 0 (0%) 0.3 (1%) -0.3
10 0 (0%) 0.2 (1%) -0.2
11 0 (0%) 0.3 (1%) -0.3
12 0 (0%) 0.0 (0%) 0.0
First, 1-seeds have clearly overachieved according to this table. They’re “expected” to win an NC about half the time, but in reality account for nearly 2/3 of all titles in the 64+ team era. Next, 4-seeds are “expected” to win more often than 3-seeds. This reveals an anomaly in the model data. Apparently since 2014, 4-seeds have graded out as slightly stronger than 3-seeds from an efficiency perspective. Over a longer time horizon, we’d expect this to revert to normal. We see that seeds below have a slight chance per the model, until you reach the 12-seed where it becomes extremely rare.
We can also look at how likely it is for a seed-line to have won over a certain time period. In other words, given the 36 tournaments since 1985, how likely is it that an 8 seed has won at least one National Championship?
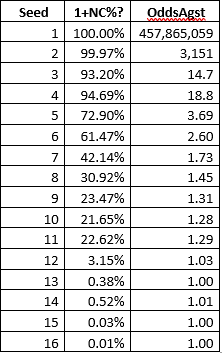
It isn’t too surprising that it is very likely that at least 1-seed has won a NC since 1985. With 36 years of play, it is guaranteed that a top seed will be able to cut down the nets. This remains true for all of the top four seeds. It is somewhat of a surprise that a 5-seed hasn’t won a NC yet, since this should happen 72.9% of the time over a 36-year period. But the 7 and 8-lines make up for this.
We’ll close this out by showing how many tournaments are expected for a seed-line to win a NC. For a 1-seed, you’d need 1.93 tournaments, which reflects that a 1-seed “should” win a NC about every other year. Obviously, at some points a 1-seed will win multiple years in a row (currently at 4 in a row), and at other points it will be a few years when a 1-seed doesn’t win (they’ve been shut out in consecutive years multiple times, including 85/86, 88/89, 97/98, 03/04).
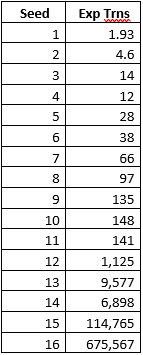
Once again, the “expected” data needs more years to smooth out. A 4-seed shouldn’t be more likely to win than a 3-seed, the same goes for a 14-seed over a 13-seed. If you combined seeds 10-16, we run into a calculation of a double-digit seed winning the National Championship once every 67 years. This may seem to be too generous to double-digit seeds, but remember that 4 11-seeds and 1 10-seed have made a Final 4. Although none of these have won a national semifinal game, UCLA came very close last season in 2021. Had they knocked off Gonzaga, they’d have been one win away from doing just this (and would have had about a 20% chance of winning). With more time, the unthinkable might happen. But it’d almost certainly be a 10, 11, or under-seeded 12 which won.