
Current Championship Odds in Various Sports
College Program All Time Ratings
College Basketball Program Ratings
College Football Program Ratings
Random Jayhawk statistical profiles
Weighting Medal Counts – Olympics
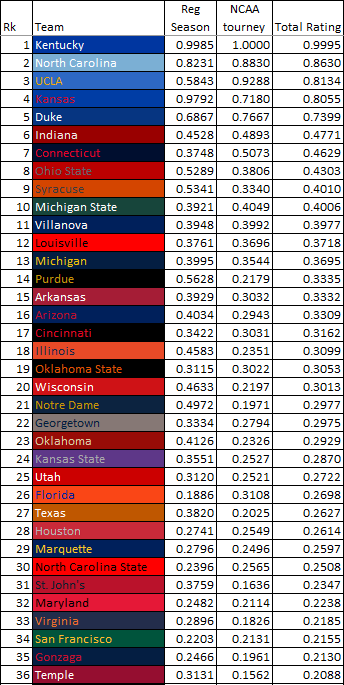
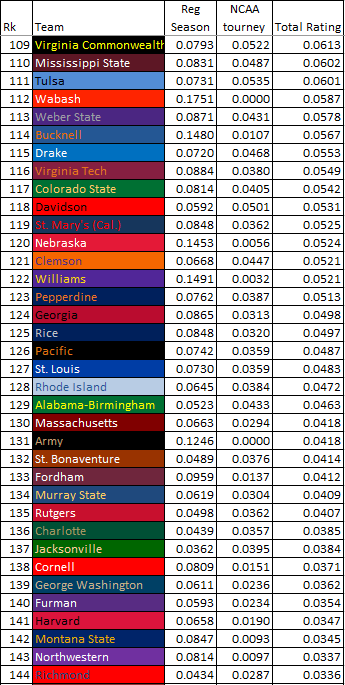
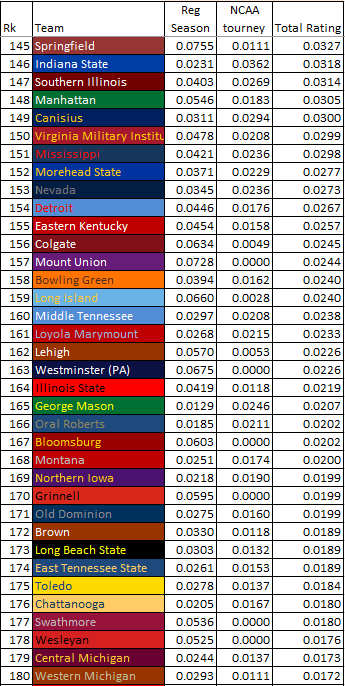
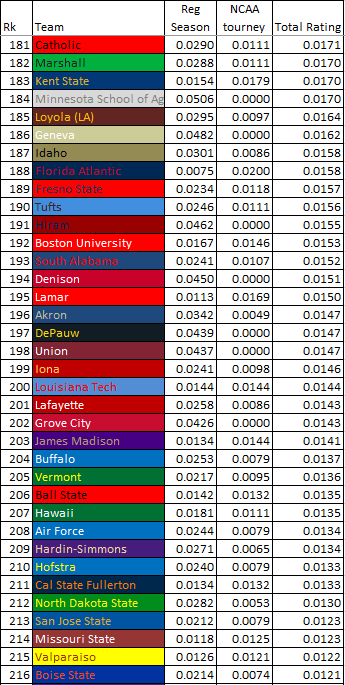
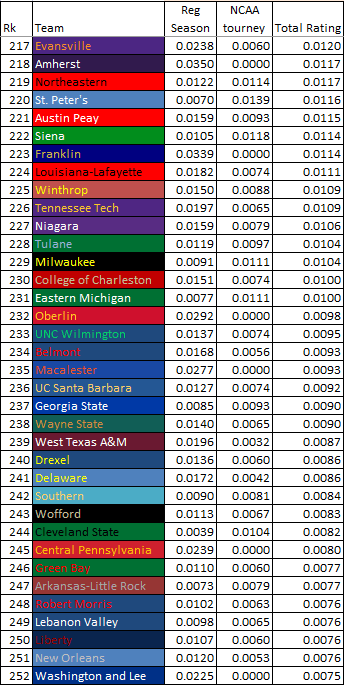
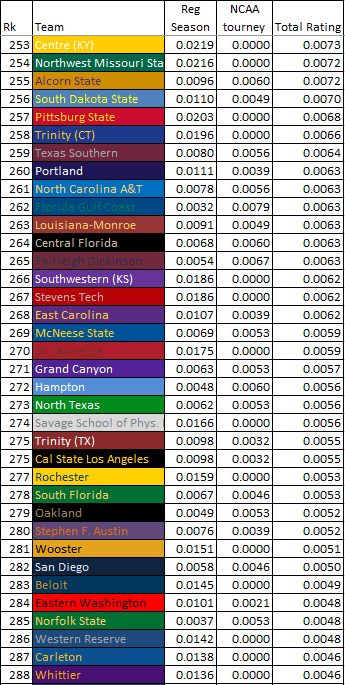
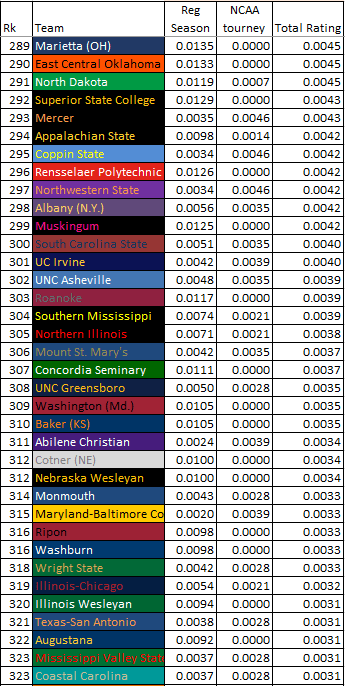
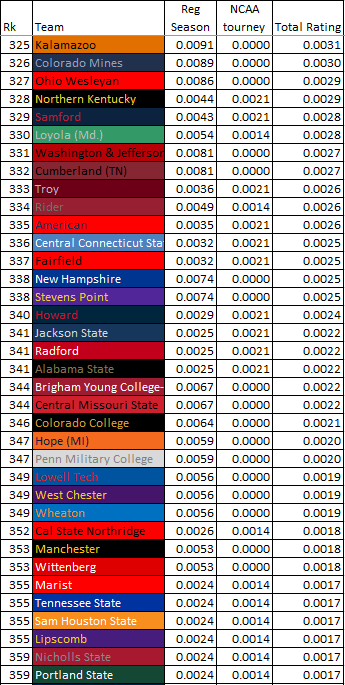
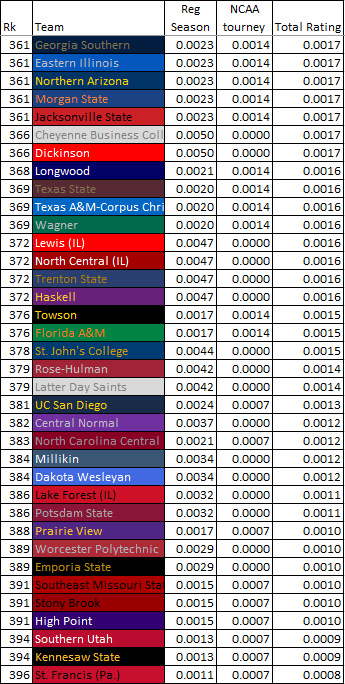
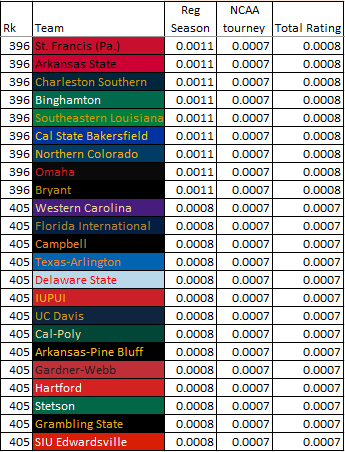
There have been 130 seasons of college basketball. This table attempts to rate the hundreds of programs that have competed in the sport over the years in an unbiased, objective manner. The rating system looks at the entire history of the sport, including its pre-NCAA Tourney days, in a consistent way that accounts for all the various eras of college basketball. When examining NCAA Tournament results, national championships are given their true weight with each successive round in the bracket being twice as valuable as the previous.
The Rating is thus cumulative. In each season, teams are awarded rating points based on a variety of categories. After 130 seasons, we accumulate the total rating points of each category and set the highest score as a baseline of 1. Each subsequent score is in proportion that baseline mark.
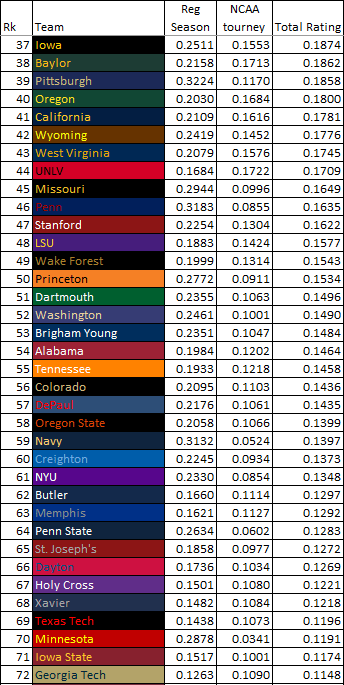
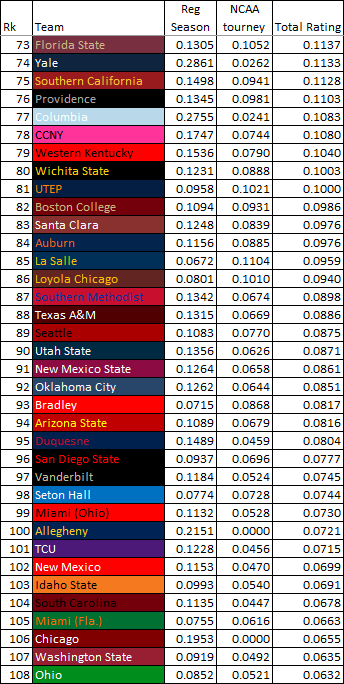
The Total Rating is the value on the far right, and it is this rating by which teams are sorted. Kentucky is college basketball’s best program with a score of 0.9995 (out of a possible 1.0000). The Total Rating is a weighted combination of both Regular Season and NCAA Tournament achievement, with the NCAA getting the stronger weight. We will now examine each rating portion in order.
Regular Season
The Regular Season score column rates each program’s success as it pertains only to the regular season, which for our purposes refers to any and all games that aren’t NCAA Tournament games. Although its called Regular Season, it implicitly includes conference tournament results. Implicit is the key term, because the Regular Season score is not directly any calculation of wins, win-loss percentage, or even other achievements such as conference championships. Rather, the Regular Season score is built based on NCAA Tournament seeding.
Seeding occurs at the conclusion of regular season play, and is thus the best judgment of how well a team performed to that point. Other results such as record or total wins or championships is schedule-dependent. A team which played a tough schedule will have a worse record than if it had played an easier schedule. The selection committee, although not perfect, takes this into account when selecting/seeding the 68 teams. Similarly, conference championships are dependent on the teams’ specific conferences. An easier conference is easier to win.
But teams with solid records and teams that win conference championships will be rewarded for these accomplishments through appropriate seeds in the bracket. It is the seed-line a team receives which determines how many rating points it gets for the Regular Season. Non-NCAA Tournament teams receive no rating points that season.
Allocating rating points is very important, as it must be done in proportionate value. How valuable is a 1-seed? Well, the question must be asked with regards to other seed-lines. A team earning 1-seed should receive more value points than a team earning a 2-seed, and the same with a 2-seed team when compared to a 3-seed team. But how much? What are these ratios?
The best way to determine this is to use history. The NCAA Tournament is currently in the 64+ team era, and has been since 1985. In the 39 tournaments from 1985-2024, we have a large series of data which tells us how many expected wins each seed-line has. The table shows the estimated wins per seed line from that period.
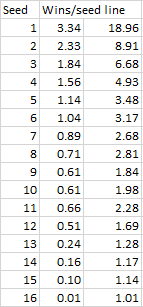
The table shows that 1-seeds are expected to win 3.34 games per tournament. This is because they are typically the most talented teams and the easiest path through the bracket. From here, we see that 2-seeds win 2.33 games per tournament, 3-seeds 1.84 games, and so on.
The final column isn’t labeled, but it is also important. This column shows the expected number of weighted wins a seed will achieve in any one Tourney. A weighted win accounts for the fact that later round games are harder to win (because there are fewer of them), and allocates points accordingly. Expected weighted wins looks at how far in the tournament a seed is expected to go, with each successive round achieving double the weight as the prior round. The 16-seed is expected to earn only 1.01 weighted wins because it is expected to make only the Round of 64 99% of the time, as it rarely has made the Round of 32.
Weighted wins are as follows: Make the Round of 64 (i.e., lose in the First Round), earn 1 weighted win. Make the Round of 32 and lose, earn 2 weighted wins. Make the Sweet 16 and lose, earn 4 weighted wins. Elite 8 earns 8. Final 4 earns 16. Finish Second to earn 32. Win the Championship to earn 64.
Weighted wins will show up in a later portion of this methodology. But for now, know that they are used as expected. A team which earns a 4-seed from the committee due to its regular season success will earn 1.56 expected wins in the middle column and 4.93 expected weighted wins in the last column.
The expected-win data presented above is for all Tournaments 1985 and beyond. For seasons before 1985, we use other other numbers based on the bracket at the time. Tournaments from 1979-1984 had 48 teams. From 1953 through 1978, the number of teams fluctuated from 22 to 32. 1951 and 1952 had 16 teams. From 1939 to 1950, there were 8 teams.
Each bracket iteration has win estimates based on the standard of the time, but the estimated number of wins and weighted wins accumulate in the same fashion. The 64-team bracket is set as standard, so a team which made the Tourney in the 16-team era is guaranteed to make the Sweet 16 by virtue of making a more-select field.
Before getting to the NCAA Tournament portion of the rating, we need to first examine years there wasn’t an NCAA Tournament. This includes the seasons from 1896 to 1938, as well as 2020. In the pre-tournament days, conference championships and wins/losses were more important. But without a national ranking system, it is tough to judge these metrics against one another. Thankfully, we have two systems that help.
First is the Helms Athletic Foundation, which retroactively began awarding National Titles beginning in 1943. By the late-90’s, computer rankings were possible so it was the work of Premo and Porretta that provided Top 15, 20 or 25 lists by season starting in 1896. Using these systems, we can award regular season value-points and weighted value-points which translate to expected NCAA Tournament wins. The question to ask is as follows. Had the NCAA Tournament been around, what regular season value would we expect the Helms Foundation champion to receive? What about, say, the #12 team on the Premo-Porretta Power Poll? This is doable as these rankings can track with our understanding of modern seeds. Once careful calculations were made in determining the correct value points, these systems were incorporated so that the first four-plus decades of college basketball could be included in the program ratings.
2020 is an anomalous case, but what happened was that we had an entire regular season and no NCAA Tournament. Although the selection committee didn’t select and seed a field as it should have, we can still reasonable place teams in a hypothetical bracket. Even Ken Pomeroy did this on his website. After doing this, we treat each program’s expected seed-line and award it expected wins and expected weighted wins. That way, the best teams in the 2020 regular season can receive their due value-points.
NCAA Tourney
The NCAA Tournament score column is actually calculated in a similar way to the Regular Season score. However, instead of expected wins and expected weighted wins, we simply use actual wins and actual weighted wins.
One important note is that each tournament is patterned to the 64-team field for uniformity purposes. A team which makes the Elite 8 when there were only 32 teams is not penalized for not having to play in the Round of 64, for instance. But this means that official tournament wins aren’t used, instead we make an adjustment to account for seasons where teams effectively got “byes” to the later rounds.
Concluding Thoughts
When examining this list, note that there are non D-1 programs and defunct programs. They are part of the history of college basketball, but aren’t likely to move up unless something changes and they return to the highest level of collegiate play. I’ll close with some trivia. The first list is something you don’t want to be on, but the theme is “the best program to never ___.” These refer to current D-1 teams, with historic teams in parentheses.
The best to never win a National Championship: #14 Purdue
The best to never make a Championship Game: #21 Notre Dame
The best to never make a Final Four: #45 Missouri
The best to never make an Elite Eight: #88 Texas A&M
The best to never make the Sweet 16: #114 Bucknell (historically: #100 Allegheny [non-D1])
The best to never make the Round of 32: #120 Nebraska (historically: #100 Allegheny [non-D1])
Nebraska is also the only Power-6 team to have never made it past the Round of 64. The Cornhuskers are 120th on the list thanks to a surprisingly decent pre-1939 basketball history. In the tournament-era they’ve been far less fortunate, having gone 0-8 in the Round of 64. In those 7 appearances, they’ve been as high as a 3-seed yet still have never won a game. Given their cumulative seeds in those Tourneys, we’d expect them to have 6.84 wins.
UCLA’s 11-1 record in the National Championship game is amazing, and Connecticut is a perfect 6-0 when playing for a Title. Conversely, Ohio State is 1-4 in the Title Game. The worst program with a National Title is Loyola Chicago, ranking 86th in this rating system. CCNY, the 1950 champion, is the only champion no longer D-1 (it is currently D-3) and sits at 78th thanks to a strong pre-NCAA Tournament program history. Louisville, which still checks in at #12, is the only school which had a title vacated. It has 2 official NC’s after losing its 2013 banner. The best program not in a Power-5 conference (Big 10, Big 12, ACC, SEC, Big East) is #34 San Francisco, edging out Gonzaga by 1 spot. The Dons have 2 titles in their history (1955, 1956) but have not won an NCAA Tournament game or got past the Round of 64 since 1979.
The rating system is set up to compare any two programs in terms of a multiple. Simply divide one program’s Total Rating score against another to see (in terms of a multiple) how much better (or worse) one is than the other. Let’s look at a few examples (as of end of season 2023):
Kansas is 2.81x better than Kansas State
Kansas is 3.07x better than Texas
Kansas is 4.88x better than Missouri
Kansas is 6.86x better than Iowa State
North Carolina is 1.17x better than Duke
Indiana is 1.43x better than Purdue
UCLA is 2.46x better than Arizona
Kentucky is 2.69x better than Louisville
Kentucky is 1,334x better than Grambling State (#1 and #404 ranked programs)
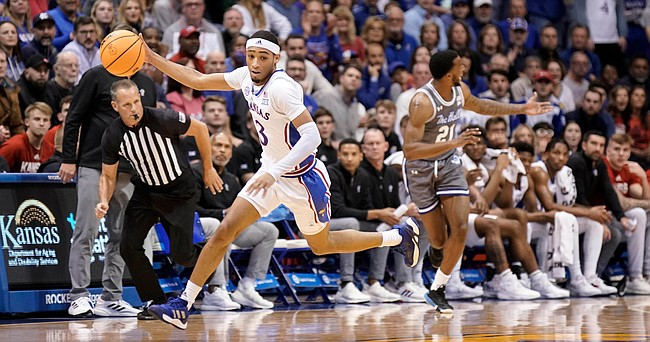
Gradey Dick finished with his second consecutive team-MVP game and third team-MVP of the season. Despite being the team’s leading scorer, Jalen Wilson had the worst overall game of any Jayhawk due to poor defense.
Gradey Dick had his second team-MVP game of the season while putting up the best individual performance of any Jayhawk so far thanks to great shooting and very solid defense.

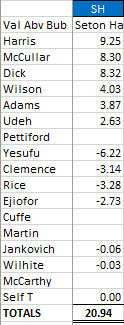
The “5” spot in the rotation this year was hotly debated by KU fans coming into the season. Some like Zach Clemence due to his perceived shooting ability. Others were high on 5-star freshman Ernest Udeh with his 6’11 frame. Other have pointed out Zuby Ejiofor’s ability, especially now that we have seen his rebounding skill. Still others wanted to see what D-2 transfer Cam Martin could do, given his prolific scoring ability at the lower level.
Despite all this, the man who has won the starting job is K.J. Adams. Undersized for a 5, Adams is neither a post-up scorer nor an outside shooter (he is 0-1 from 3, and 4-13 total on shots outside the paint). His free throw shooting is poor (8-21). Yet, he finds a way to average a respectable 8.2 PPG, currently good for fourth on the team.
His defensive rebounding rate is 8.7%, which is very low for a post player. Despite this, and his lack of size for his position, he attacks the offensive glass effectively. His 4.5 RPG is not great, but it does add some value for Kansas. He blocks a fair number of shots (his 9 leads the team). He has 24 assists as well, good for third. On the other hand, he only has 9 steals, which is the fewest among the starters.
The question, “how is K.J. Adams adding value” is not meant to disparage Adams. It is merely a curiosity. He plays an unorthodox style, yet does so effectively for Kansas. Through 10 games, Adams has added +0.83 points per game above bubble. Anything positive is a good score, and Adams’ score indicates he would earn minutes on about any Kansas team (although there are many years in which he wouldn’t start at either front-court position).
Let’s first answer this through breaking down his value stats as calculated on this website. Adams is adding +0.83 per game. Broken down, his value is +0.04 from offense and +0.79 from defense. Let’s start with his offense.
Offense +0.04
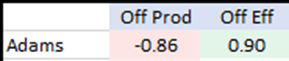
This first split breaks down K.J.’s offensive value into Production and Efficiency. These are points of value relative to bubble, with 0.00 being bubble-level. K.J. hasn’t been super-productive. He is averaging 8.2 PPG, which in 25 minutes per game, is not outstanding. However, he is getting those points through efficient play, which cancels out the low productivity. Basketball Reference has him with a TS% of 64.1%, which is second-highest among the rotation players. He gets a lot of his points from layups and dunks. Most of these are set up from a teammate, as he is scoring 79.2% of his points off an assist.

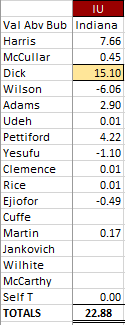
Another way to breakdown his value is through the following categories. K.J.’s Offensive Efficiency is 1.49, second-highest among the rotation players and best among the starters. We see that his Points accounted for per game at 7.6, or below his official PPG mark. This is because he scores off an assist more than he sets up plays for himself or others. The True shooting percentage of 58.4% is lower than the calculated one on Basketball Reference, as assisted baskets are discounted in this formula. Still, it is a very good number for one who is not traditionally thought of as a good shooter. He knows his limitations, and takes shots that are good for him. This validated by his Shot Frequency of 14.4%, which is below the mean of 20%. His Impact, however, on offense is at 17.4%, partly due to his solid assist numbers (for a big) and his offensive rebounding marks. At Missouri, Adams had a career-high 19 points. All of his points came through dunks (4), layups (5), or free throws (1). He found gaps and finished. He also made two nice passes to Kevin McCullar for assists. Here is a highlight video to get a visual of his offensive play.
A lot of Adams’ baskets are of him starting away from the goal and diving to the rim, although he scored a few this game in the post by sealing his man top-side. Still, his baskets are all at the rim. According to the box score stats, the last “jumper” made by K.J. Adams was against Tennessee, at a play at the 18:39 mark of the 2nd half. In this play, Adams finished a floater through contact while in the lane. Even Adams’ shots which aren’t layups are still relatively close.
We can break down offensive value further. This will convert elements of offense into three buckets…scoring, ball-handling, and rebounding. Scoring accounts for a player’s ability to score. It can be through volume, good outside shooting, getting to the line, or finishing tough shots. Doesn’t matter. All that matters is points. Ball-handling takes into account assists and turnovers. Assists are good, turnovers are bad. A conservative player with the ball like Gradey Dick might not turn it over much (increasing his handling score), but this comes with a price (fewer assists, which decreases the score). Rebounding looks at all the offensive rebounds won by a player, as well as any hustle play to retain possession after a teammate has a near-turnover (such as the loose-ball K.J. dove on the floor for in the above video).
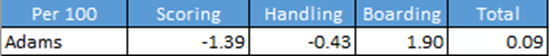
K.J. Adams’ scores break down like this. Instead of having this as a per-game stat, it is per-100 possessions. This coverts to a +0.09 score. Adams’ Scoring value is below-bubble. This isn’t too surprising, as he isn’t a tremendous scorer. Still, his Scoring value isn’t terrible either. It is above Udeh, Pettiford, Clemence, and Ejiofor. Only Yesufu and Rice grade out as better bench-scorers among the rotation.
Ball-handling is also better than it looks. Adams is a post-man, and traditionally they have fewer assists. For a 5, having a score close to 0.00 is really good. Of the other big men, Adams tops Udeh and Ejiofor by a wide margin. Zach Clemence, with only 2 official turnovers this year, is slightly better in this category (but well behind in others).
Lastly, K.J. Adams is a solid offensive rebounder, and it is this category which puts him above 0.00 on the offensive value scale. Although he is actually behind the other bigs in the rotation on a per-possession basis, he is still quite valuable on the offensive glass. His offensive rebounds against Omaha were certainly noteworthy, as they provided many second-shots that game. Next, we will break down his defensive value in a similar way.
Defense +0.79
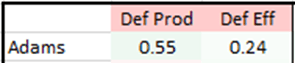
Defensive production and defensive efficiency are somewhat counterintuitive to think about. Defense here is thought of as being the inverse of offense. Therefore, defensive production looks at how well you prevent the other team from scoring, and defensive efficiency looks at how well you can block shots and collect rebounds, steals, and forced turnovers. The more defensive possessions you win, the more “leeway” you have in allowing points while still maintaining a good defensive efficiency score.
For Adams, he is stronger at not allowing points than he is on the defensive efficiency side of things. To note, this stat isn’t saying he has a 0.24 Def Eff. Rather, it is saying he adds 0.24 points per game above a bubble player’s expected defensive efficiency. At any rate, both subcategories of defense are above-bubble.

We will now go down the line, looking at statistical metrics that feed into the +0.79 Adj +/- value score. First, we see the defensive efficiency, not as a value-score as before but as the real defensive efficiency rating. At 0.94, this is better than the replacement efficiency of 0.977. In other words, given KU’s opponents, what we expect from a KU rotation player is to have a defensive efficiency rating of 0.977 or lower. Adams is lower than 0.977, albeit by just a small amount.
This rating is a product of a few things, none bigger than his points allowed. K.J. is allowing 7.5 points per game. We know from above that he is producing 7.6 points per game. So, despite him not being a solid scorer, he still produces more points than he allows. His defense is good enough to keep him on the floor.
The next column is also important, as it converts the 7.5 points allowed per game into a per possession metric. At 10.2 points allowed per 60 possessions, K.J.’s defense can be more easily compared to others. Looking at others battling for minutes at the 5-spot, we note that K.J.’s is better than Udeh’s points allowed per 60 (14.1) and Ejiofor’s (14.4). Clemence actually has a lower points-against per 60 rate (8.3), however this is in far fewer minutes. We aren’t sure if this is significant, first because Clemence has only played 45 minutes and second because Clemence doesn’t have to worry about things like foul trouble. Last season, Clemence was the worst rotation player on the team in giving up points. So, more data is needed. Cam Martin doesn’t have enough playing time yet to have a reasonable score.
The final metric we look is the possessions won, both per game and per 60 possessions. Adams only winning 6.4 defensive possessions per 60 is not good for a 5-man. Normally, the 5 will get a lot of defensive rebounds due to his height and proximity to the rim. Again, to compare against the other 5’s, we see that Udeh has 10.8 possessions won per 60 and Ejiofor has 13.8. Clemence (6.1) is slightly worse than Adams on this metric, again with limited playing time.
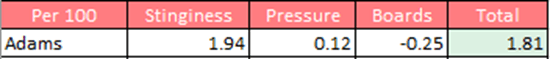
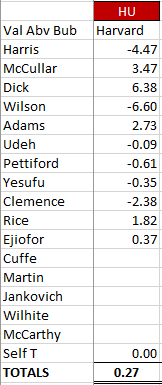
This graph shows Adams’ defensive value in terms of points per 100 possessions. The first category, Stinginess, indicates how well a defender does at not allowing his man to score. Here, Adams is better than the replacement, bubble-level defender by 1.94 points per 100 possessions. The next category is titled Pressure, but it refers to steals and other forced turnovers. Adams is slightly above bubble-level. Note that guards tend to score more highly in this category, so for KU to have its starting 5 above-bubble is a good sign. The last category is rebounding. The story here is different. At first, it doesn’t look so bad for Adams, just slightly below-bubble at -0.25 per 100 possessions. That’s a difference of 1 point over the course of about 8 games or so for Adams when compared to a bubble-level player. But remember that these values are not position-adjusted. Comparing him to other power forwards and centers, we see that each is well-above him (Wilson +1.69, Udeh +1.50, Clemence +1.38, Ejiofor +4.80). Even Gradey Dick has been a better defensive rebounder this season than Adams.
Wrapping everything up, let’s answer the question. How is K.J. Adams adding value? It’s truly very strange. Not that he is adding value, he is a great athlete and hard worker. He adds value on offense not through scoring but with high efficiency dunks and layups. But unlike other starting 5’s in recent KU history, such as David McCormack or Udoka Azubuike, K.J. Adams doesn’t score through post moves but by starting outside and cutting to the rim off of ball-screens and ball-rotation. He handles the ball fine for a big-man, which helps offset his lower-than-expected scoring marks. His strongest attribute is his offensive rebounding, but it is less through tip-ins or other boards at the rim as in the past and more through hustling down long rebounds.
Conversely, his defense is the reverse. He adds value through his defensive stinginess. Sure, he doesn’t score a bunch. But he doesn’t give up many points to his man on the other end. Furthermore, he gets enough steals and forced turnovers to add value, almost balancing out his negative-value ball-handling on offense. Lastly, despite being a strong offensive rebounder, K.J. is a minus defensive rebounder, a truly odd occurrence for any power forward given that these marks aren’t position-adjusted. Any position-adjusted look at these numbers would be even more skewed.
But we can think even more basic on this. K.J. Adams adds value because he competes. Game-in, game-out, he attempts to be better than his opponent. First to the ball, making plays on defense, sealing his man, switching onto any type of player while on defense, etc. In the 10 games so far, K.J. has produced positive value-scores in all but 2. Even after adjusting for opponent, K.J. has been positive in 7 out of 10 games, including each of the last 5. Sure, he has areas he can improve on. But regardless of whom he matches up against, he wants to win. He wants to win that matchup, that possession, that game. That’s why he is the starter, and why he will play a big role on this team in the future if he can continue to compete.
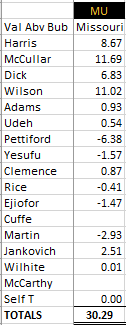
In KU’s 95-67 drubbing of Missouri, the bench only contributed 9 points (3 of those from Michael Jankovich) in 41 minutes. Four of the starters played 32+ minutes despite being in control of the game most of the way. Clearly Self doesn’t trust his bench.
https://247sports.com/college/kansas/Video/Bill-Self-looking-for-more-from-Kansas-bench-11512994/
KU’s bench has not been great, to put it mildly. The starting 5 has all had big moments in the team’s 9-1 start, but little production has come from the reserves. Sure, there are moments. Bobby Pettiford’s put-back reverse lay-up to beat Wisconsin comes to mind. But those were his only points of the game. M.J. Rice showed some great skill with his recent 19 point game, but that came against an overmatched Texas Southern squad (currently #253 on KenPom). He hasn’t been solid against the better teams on the schedule. Joe Yesufu is having a better season than last year, but he is clearly still playing at a level below the starters at the guard/wing positions. The various bigs have shown some skill, but nothing consistent enough to earn minutes. One game Udeh looks good, the other he doesn’t. And so on down the line.
Without further ado, I decided to rank the benches at KU by season. Before doing so I made some predictions on who would be the worst. My prediction was that the 2023 team will be second-worst, behind the 2012 team. But I also wanted to find out which benches were the best, and how 2023 compares to historic norms. To quantify this, a few rules are put in place. First, the main five starters will be deemed the starters, while anyone else is a bench player. Starting rotations can fluctuate, but for basically all seasons a starting 5 will emerge for Self during February and into March. Second, the quantitative measure will be total bench WAR over total team games played. This is to normalize the metric by number of games. Third, to make the number stand out better, we will convert it to a 36-game schedule. Last, the time period will be the Self-era (2004 through 2023). 20 seasons is good enough.
Results:

*The 2019 team lost Azubuike (to injury) in early January and Vick (personal reasons) in early February. Still, the starting 5 was clearly those 5 before these issues arose, so despite starting at the end of the year, guys like Agbaji and McCormack are considered “bench players.”
**The 2015 team lost Alexander (to eligibility) at the end of the year, and Lucas was the starter into March. Traylor actually made more starts than Lucas, but down-the-stretch it was Lucas as the starter. Traylor and Alexander are considered “bench players” for this exercise.
With the caveats out of the way, the Norm. column is what we want to focus on. It shows, per a 36-game schedule, how much bench value was provided that season. The average KU team provides 1.59 WAR off the bench over the course of 36 games. Most benches provide positive WAR on the season (14/20 or 70%). We see trends, with Self having better benches during the early years. The next chart will be the same as above, just sorted from best to worst.
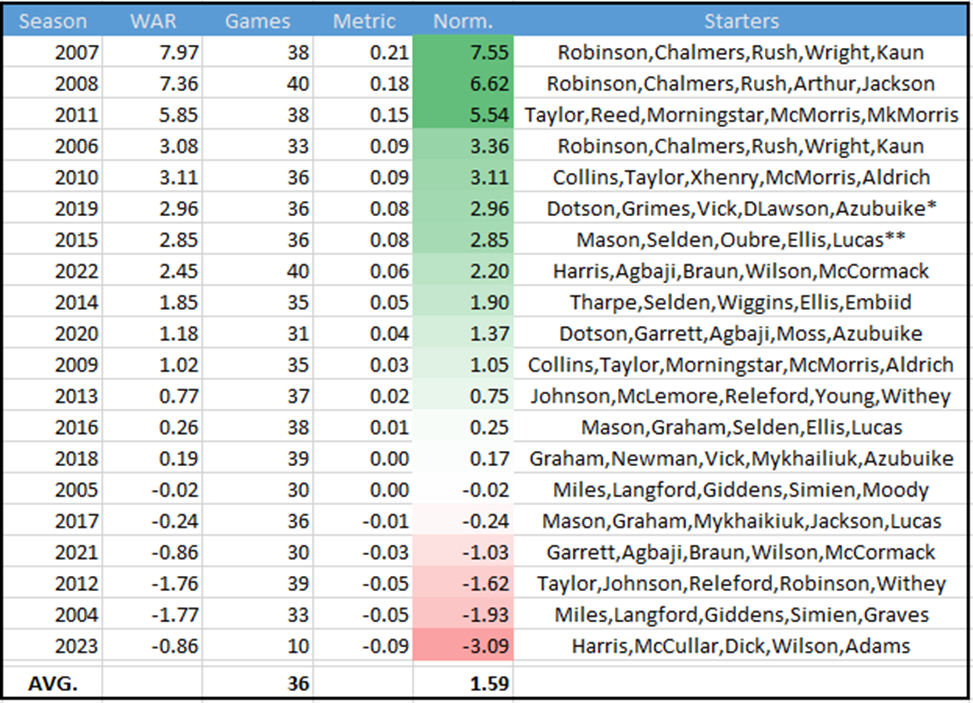
My initial projections on the worst benches were close. The 2023 team has had the worst bench in the last 20 years, however this is only after 10 games. Expect this number to trend closer to 0 as Self continues to be more selective in who he plays. The 2004 team had the second-worst bench. The best bench player that year was a partial-starter in David Padgett. Others off the bench that season were Michael Lee, Bryant Nash, Jeff Hawkins, Christian Moody, and Moulaye Niang. Not a lot of great choices there.
The 2012 team is the team which had the most success while having a negative-value bench. The national runners-up relied heavily on the starting 5. Bench guys like Conner Teahan and Kevin Young provided small, positive WAR, but the others (Tharpe, Wesley, and the walk-ons) caused that number to drop below zero.
On the flip side, both the 2007 and 2008 teams had tremendous benches. The 2008 National Champions played essentially 7 starters. Collins and Kaun had great seasons off the bench and would have been starters almost anywhere else around the country. Even the 8th and 9th men on that team (Rodrick Stewart, Aldrich) added value. 2007 was similar, with Collins coming off the bench. In addition, posts Arthur and Jackson (who would win starting roles that following year) played great as reserves.
Getting back to 2023. The player with the most value off the bench is Michael Jankovich, who has scored 8 points on 3-4 shooting in 13 minutes. This is a far cry from say, the 2011 bench, which had T-Rob and Mario Little filling in nicely for the Morris twins.
If the 2023 bench doesn’t show signs of improvement, Self will likely rely on his starters even more. K.J. Adams, despite playing out of position, has given KU five consecutive above-bubble performances (and 7/10 this year) as he has settled into a non-traditional 5-man role. Kevin McCullar’s last two games have been his best on the season, and his offense and defense have started to fit in nicely to what KU wants to do. Jalen Wilson, Gradey Dick, and Dejuan Harris have been consistently solid. It’s apparent when any of those guys are off the court, so I expect them to play around 35 minutes each in close games, leaving little time for their backups.
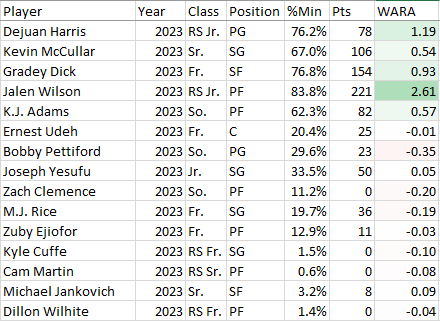
Last, here is the WAR for the 2023 team. The top 5 are starters, below that, the bench:
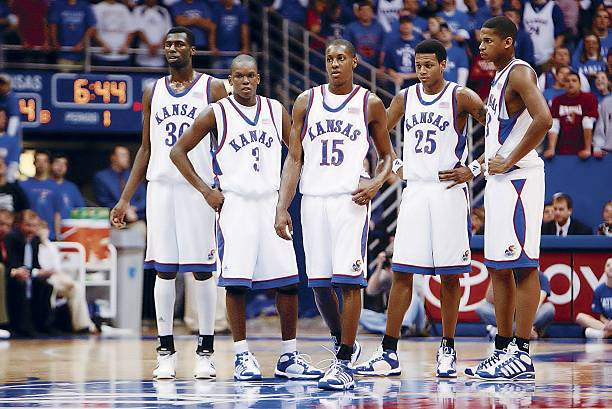
The 2006 Kansas Jayhawks finished the season with a 25-8 (13-3) record, winning a share of the Big 12 Regular Season as well as the Conference Tournament. The team earned a 4-seed in the NCAA Tournament, and would be eliminated in the Round of 64. The team’s Sports Reference link is here.
Offense
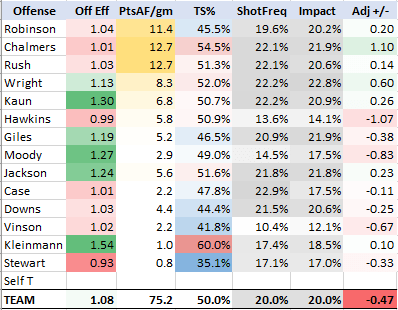
The 2006 Offense was a work in progress, with the team producing a value score below bubble-level for the season. Mario Chalmers led the team with a +1.10 value-score thanks to accounting for a team-leading 0.486 points per minute. Chalmers played fewer minutes than the other starting guards yet produced as much or more offense than Robinson and Rush. Julian Wright was the team’s second most-valuable offensive player. One area of note is the team’s offensive balance. Among its main starters, shot frequency ranged from 19.6% to 22.2%. Chalmers graded out as the team’s best shooter, but there wasn’t a large range of offensive performance as is seen in other years.
Defense
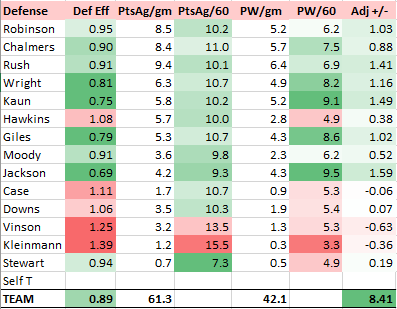
The 2006 Defense made up for the team’s offensive struggles, finishing the season as KenPom’s #2 defense overall. This defense would also be the first year of a three-year run of excellent defense; anchored by strong defenders such as Mario Chalmers, Brandon Rush, Russell Robinson, and Sasha Kaun. But the player who graded out as the team’s best defender in ’06 was actually Darnell Jackson, a strong rebounder and solid positional player in the post. The team was stingy about giving up points and competed for rebounds and loose balls. They also had a fair amount of balance on defense, with their guards winning possessions at a reasonable clip.
Adj. PPGAB +/-
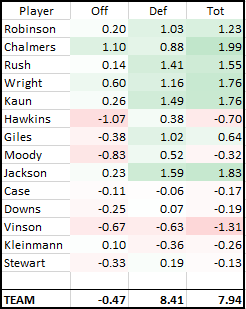
The 2006 team had six players post > +1.00 value scores on the season. Leading all Jayhawks was Mario Chalmers, whose score was a shade under +2.00. Darnell Jackson finished second on a per game basis despite playing only 26.5% of available minutes (some of this was due to eligibility issues). Julian Wright and Sasha Kaun graded out with equal value scores. Brandon Rush and Russell Robinson also had very solid seasons in 2006.
The TEAM score of +7.94 is below the average of +9.63 over the past 26 seasons (1997-2022), placing the team 19th of 26 over this period. This was a team that saw steady improvement as its younger players matured. After 11 games it was only performing at +3.10 points above bubble. By 16 games it was +4.66. And by 21 games it was +7.36.
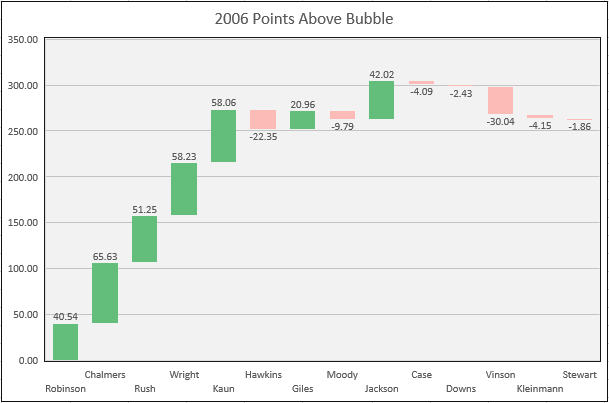
Much of the balance can be seen in this chart. Note that Jackson’s total points above bubble is fifth on the team, as he only played in 23 games.
Season Recap
After January 1, the 2006 Jayhawks went 18-4 (13-3), playing basketball at a true KU-level of +10.36 points above bubble. Although it wasn’t known at the time, this hot streak would be crucial in securing a share of the conference title (with Texas), and would become the second regular season Big 12 title in a stretch of 14 in a row. The co-champ Jayhawks and Longhorns would meet in Dallas for the tournament championship in March, with Kansas avenging its loss a few weeks earlier in an 80-68 fashion.
Despite the hot play late in the year, KU was only able to get a 4-seed in the NCAA Tournament and would draw a talented and experienced Bradley team. For the second season in a row, KU would lose in the First Round. But the core of the team would regroup, return, and go on to achieve considerably more in the next two seasons.
Julian Wright had an explosive freshman season.
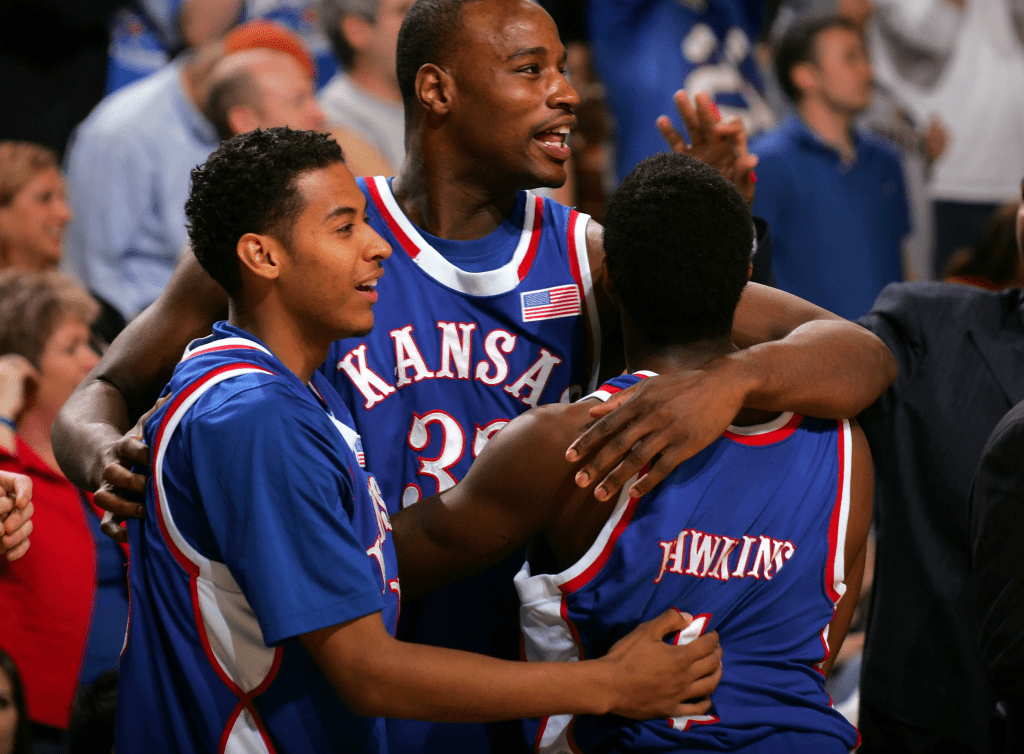
Despite the lack of collegiate experience, the 2006 team gelled during Big 12 play.
The 2023 Kansas Jayhawks went 28-8 (13-5). The team won the Big 12 Regular Season Championship and earned a 1 seed in the NCAA Tournament. Kansas reached the Round of 32 before losing. The team’s Sports Reference page is here.
Offense
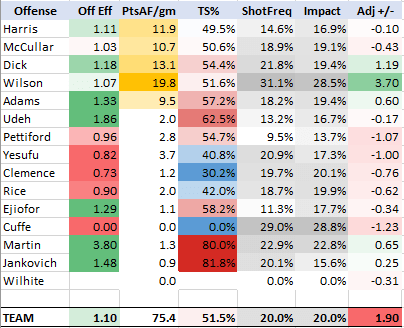
The 2023 Offense was led by Jalen Wilson. Wilson’s shot frequency was the team’s highest since Thomas Robinson in 2012 also had a 31.1% ShotFreq. Despite his high volume, Jalen was right on pace with the team average regarding true shooting percentage (TS%). Gradey Dick was the team’s second most-valuable player on offense, generating his value through scoring and high-percentage outside shooting. His ability to limit turnovers also was a plus. K.J. Adams was the other starter to add offensive value, largely due to his offensive rebounding and efficiency. Dajuan Harris improved the most toward the end of the season. Over his last 13 games, Juan was over +1.00 per game on offense.
Defense
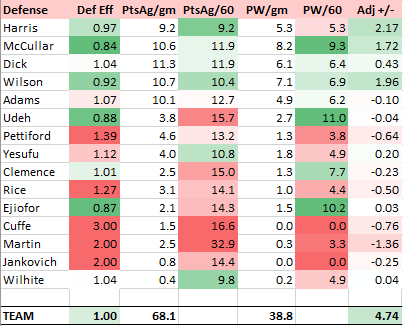
The 2023 defense was the better half of the ball for Kansas. Despite playing an undersized starting 5, KU finished the season as KenPom’s #11 defense. Dajuan Harris earned Big 12 DPOY honors, and his value is quantified best here at over 2 points per game above-bubble. Jalen Wilson and Kevin McCullar were also excellent defensive players. Gradey Dick was someone who got overly criticized for his defense. While he had some struggles, he hustled, rebounded, and had a fair amount of deflections. In total, he produced an above-bubble defensive effort to compliment the value he provided on the offensive side of things. K.J. Adams was around bubble-level while playing out of position. The bench had some acceptable defenders, with Joe Yesufu probably getting overlooked the most. Joe wasn’t a lock-down defender, but he also used his strength and quickness to bother bigger players. Freshman Ernest Udeh showed the most defensive potential as an athletic and long big-man. It will be interesting to see how his career develops on this end of the floor.
Total Adjusted PPGAB +/-
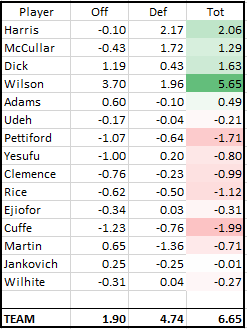
Jalen Wilson put up an All-American level of value, and with it, a 1st team nod. All starters were positive, while each bench player producing at or below-bubble. KU’s bench was bad this season, and finished as the worst in Self’s 20 seasons in Lawrence.
Value Seen 3 Ways
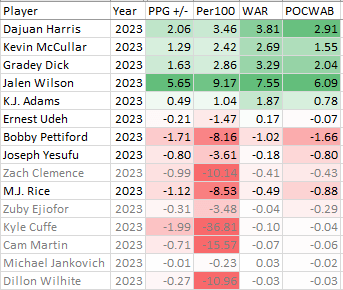
Player value can be shown in slightly different ways. This is because players have different levels of playing time based on a variety of factors. To best show this, we want to consider these four levels of player value.
First is PPG +/-. This is generally the best metric as it tracks closest with the traditional stats that are most intuitive to basketball fans, such as points per game or rebounds per game. This value metric estimates how much better, in net points per game, a player has been above that of a hypothetical bubble-level player.
Second is Per 100 possessions +/-. This value metric looks at how much better a player has been over a bubble-level player over the course of 100 possessions. This metric is valuable when comparing players who’ve played in different numbers of games but similar minutes. KU’s bench players, who tend to battle each other for backup playing time this season, are best compared against one another using this metric rather than PPG +/-.
Third is WAR, or Wins Above Replacement. This value metric compares KU players against a hypothetical replacement player who is an average D1 player instead of the (better) bubble-level player. It also converts points +/- into “wins” using a multiple. This metric is cumulative, so players with more minutes will have the chance to earn more WAR (provided they are above replacement…below replacement players will see their values dip).
Fourth is POCWAB, or Player’s Own Clutch Wins Against Bubble. This metric takes into account to relative toughness of the opponent, allowing a player to show his “clutchness” and weights games played against teams around bubble-level more than those low-major buy games.
Cumulative Points Above Bubble on the Season Chart
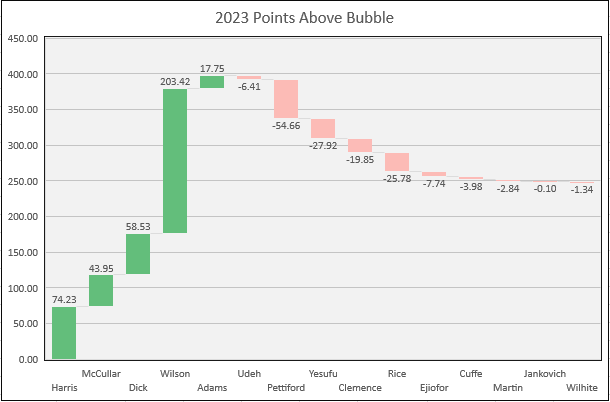
This chart is a telling picture of how the team’s starting 5 carried KU. Each starter is solidly positive, but this value begins to drop once you get to the bench. Ernest Udeh was KU’s best rotation bench player, yo-yoing above and below bubble on the season game-to-game. The reserve guards/wings were mostly dreadful, while the other bench bigs didn’t get many minutes.
Assessing the 2023 Team
Back in mid-October, the 2023 team’s value-stats were projected here.
Given who was returning, and attempting to project how good the incoming players would be, we estimated KU would have an average game score of +5.76. The 2023 team outperformed this benchmark by about 1 point. Given historic trends, KU’s estimated game score would have placed it around a 4-seed, whereas KU earned a 1-seed due to a great record in close games. With its toughest-in-the-nation strength of schedule and 17 Quad-1 wins, KU earned a 1-seed despite the various computer metrics placing the team around 10th. While the team lost in the second-round to an 8-seed, it was only 4 point favorites at tip, making the early exit less of an upset than one normally associates with 8-seed over 1-seed games. In total, the team overachieved in the regular season and underachieved in the Tournament. While one wishes these scenarios were reversed, they aren’t completely without hardware. The team did win a Big 12 Title outright by going 13-5. In (parentheses) are the preseason projections for the individual’s Adj PPG +/-. Actuals are in the table above.
Getting to individual performances, Jalen Wilson outdid his projection (+2.79) by nearly 3 value points per game. He became the volume scorer the team needed him to be, and finished the season as a 1st-team All-American thanks to the highly productive season he had.
Dajuan Harris was KU’s second-best player over the course of the season, and his season also exceeded expectations greatly (-0.28). It seems odd now that he was projected to be a (slightly) below-bubble player. But that is what he was his first two seasons. Harris showed an improved ability to score the ball, and became more comfortable running the show and making reads off the high-ball screen. His defense was also greatly improved, as evidenced by his conference DPOY award.
Gradey Dick’s freshman season was about as projected (+1.57). He started out the season on fire from behind the arc, but as teams started to defend him more aggressively he had to find other ways to contribute. It was the best freshman season since Devon Dotson in 2019, and despite the high expectations, Dick was the only newcomer to meet his projected score in 2023.
Kevin McCullar, a veteran newcomer, was slightly below his projected value (+1.94). This shouldn’t discount his season, which was still solid. Kevin’s defense was certainly where his value was. He was less of a stingy defender than expected, but he made up for this by proficient rebounding and forced turnover numbers. He was capable at switching and communicating things as well. KU isn’t anywhere near the 10th best defense without him.
K.J. Adams (+0.28) didn’t exceed expectations by as much as one might think, however a per-game above-bubble value score is only one way to quantify player value. Adams’ projection was premised on the idea he would get fewer minutes and play out-of-position less. The fact he was KU’s starting 5, played nearly 68% of available minutes, and still reached expectations means quite a bit. He was able to utilize the mismatch on the offensive side of things, being quicker than most opposing 5’s. His defensive rebounding was a work-in-progress for most of the year (although it did improve). His position moving into future seasons will be something to watch. While he proved he can handle the 5, where he plays will be predicated on the roster construction. If he does move to the power-forward role, expect his defense to improve (as he defends more perimeter-oriented players) and his offense to worsen (as he would be guarded by quicker players).
Ernest Udeh (+0.12) didn’t finish above-bubble as forecast, but he wasn’t too far off. Udeh was KU’s best bench player, and showed the most upside. While he is still underdeveloped on the offensive side of the ball, he should prove to be a good to great defender in upcoming seasons. And with a PG as good as Dajuan Harris finding him for lobs, he should still project to produce for the KU offense next season. Watch out, Udeh should be a good one.
Zuby Ejiofor (-0.18) was around his projection. Zuby’s rebounding abilities and instinct as a freshman were impressive. Like Udeh, he has great potential to be a very good defender on the interior. Questions still surround his offensive capabilities. If he can develop a back-to-the-basket game, it would improve his chance for minutes in future seasons.
Joe Yesufu (-0.35) had an improved season from last, but one still not good enough to reach projections. Joe shot poorly again in 2023 (28.6% from 3), while at least his defense did reach positive-value. To defend Yesufu a bit, he played more minutes than projected and had a Per100 score that was close to projection.
Zach Clemence (+0.47) was the most-disappointing returnee. After a freshman year that saw some him show toughness in moments (at TCU in 2022) and big shots (home vs. OU in 2022), he was picked to be the guy to have that sophomore jump. It never came, and instead went to K.J. Adams. Clemence graded out as a worse defender in 2023 while he never could get his shot to fall.
M.J. Rice (+0.69) was obviously over-projected, as one would expect his adjustment to be easier for a wing than it would be for the freshman bigs. Partly due to injury, Rice never got established in the rotation and didn’t see any court time in the NCAA Tournament. Rice was negative on both sides of the ball for the season. He showed flashes of potential (19 points vs. Texas Southern), but how much better he gets in future years will depend on how hard he is willing to work.
Bobby Pettiford (-0.59) had the worst season of any returning player and anyone who played at least 10% of available minutes. He missed his (already quite low) projected score by over 1 ppg. Injury issues were also a problem for him, but he hasn’t shown much over the past 2 seasons to project much success moving forward. He had trouble taking care of the ball at times, which is the one thing you absolutely needed from a player of his role.
Cam Martin (-0.31) played 10 and 1/2 minutes in an injury-affected season. Known for his shooting coming in, Martin went 3-4 from the floor and grabbed 2 offensive boards in that time. He only appeared in four games, but his biggest moment would come in his final game (at Texas Tech), where he would make a basket off a Pettiford feed in the 1st half in what would turn out to be a 3-point game. Martin’s defense and lateral quickness was worse than the other bigs.
Kyle Cuffe (-0.35) played a little of 6 minutes before a season-ending injury in November. He didn’t score during his time on the court. After redshirting in 2022, and no doubt getting a medical redshirt in 2023, he still has 4 more seasons of college basketball eligibility. One doesn’t know what his career will look like, but he still has time to figure that out and one hopes he can stay healthy.
Michael Jankovich (-0.36) reached his projection in limited playing time by sharp shooting (4-7 from 3). One wonders how close the staff was to playing him for a minute or so in a close game given his shooting abilities and the fact the other bench guards struggled.
Dillon Wilhite (-0.53) didn’t play much, but did get a rebound in his 7 minutes of play.
