Melvin Council and Past KU Guards

With the on-again, off-again availability of star Darryn Peterson creating uncertainty on the 2026 season, no other player has stepped up more for the Jayhawks than senior transfer point guard Melvin Council. Council is the team leader in minutes played, assists, steals, field goal attempts, and is third in overall points scored.

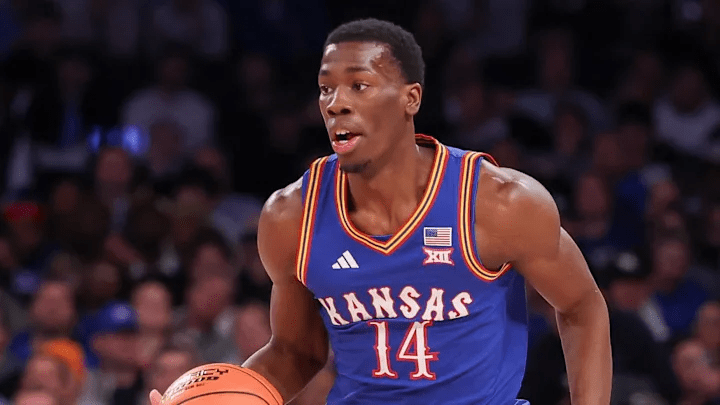
Council has been a fan favorite since before the season began, describing his play on the floor as tenacious, like a “dog,” and then delivering on this. Council’s heroics in Las Vegas, helping lead Kansas to a 3-0 record and third place finish in the 18-team Player’s Era showcase (including a huge comeback win against Tennessee), was really the first time that people thought about this team as being something more than just Darryn Peterson + role players.

At this point of the season, Council was certainly beloved by the fans but he wasn’t without flaws. Some thought he took too many bad shots; others worried about his outside shooting. With only 5 made 3’s on the season (in 28 attempts), N.C. State made the decision to double-team Darryn Peterson and guard other Jayhawks more closely, allowing Melvin open looks. Instead of this getting to his head, Council wound up going 9-15 from downtown that night en route to an-all time 36-point performance, leading KU to a 1-point overtime victory. Melvin has continued his hot play of late, including an efficient 20-point outing at UCF (taking over when Peterson checked out with injury) and of course his 18-point, 8 assist night in the comeback overtime win against TCU (9 of his points were in the extra session). Over his last 11 games, he’s scored in double figures 10 times (with the other game being a 9-point game against Missouri). The point is, not only has Council been what fans hoped he would be, he’s actually performed better than expected of late.

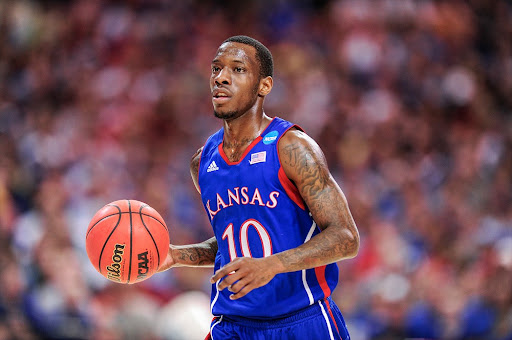
What we want to examine is another angle of this story, namely the comparison between he and former Kansas point guard Tyshawn Taylor. Taylor was a four-year Jayhawk, playing in the 2009 through 2012 seasons. A few months ago, Taylor had Council on his podcast. The two share a resemblance not only physically, but also how they play the game. Both are fast players with the ball who love to get to the rim, both play the same position, and neither is thought of as a great outside shooter. Even before the season fans (and Bill Self) were comparing Council to Taylor. These comparisons haven’t waned after watching Melvin play as a Jayhawk.

So let’s analyze this. How similar is Council to Taylor? First, the fact they share the same position counts for something. If Council were older/Taylor were younger, KU could switch one for the other and not have to change anyone else’s role on the floor. Another area we could compare is durability. In Tyshawn’s senior season (2012), the former Kansas guard played in 83.2% of possible minutes. Council this season is right in line with that mark (82.8%).

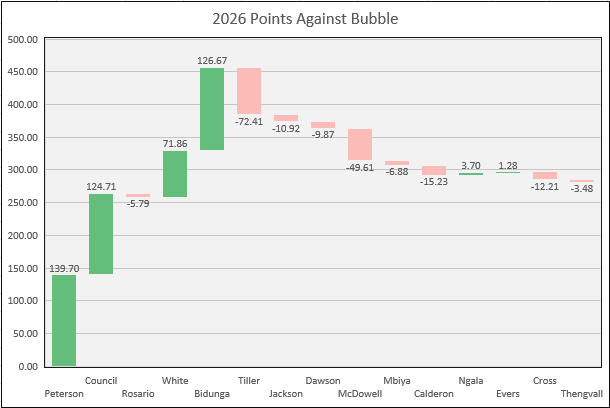
However if we go to past seasons, we see that Taylor was not as key of a piece. In 2011, his junior season, he only played 64.1% of possible minutes. As an underclassman he played similar minutes, but in these seasons he also played off the ball more given that the team had Sherron Collins to run point. In addition, Taylor’s first three seasons produced a cumulative points against bubble of -19.77 (about -0.20 per game). As we will see below, Taylor’s senior season is far more in alignment with Council’s senior season, and as Council only played one season in Lawrence, we will only compare their senior seasons…Taylor’s 2012 against Council’s 2026.

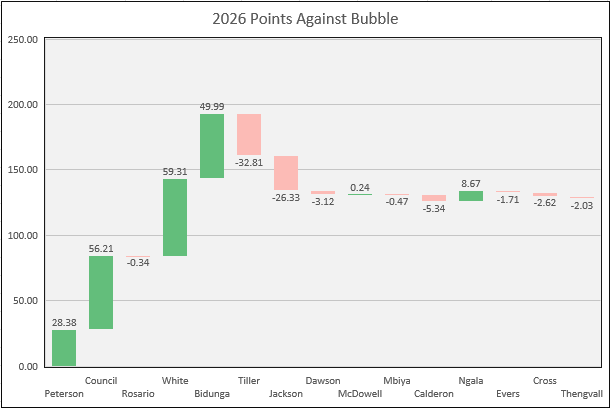
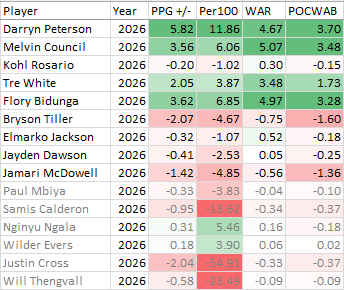
Let’s compare some value scores, noting that Melvin has only played 15 games and Taylor had a full season (39 games).

  • Tyshawn Taylor (2012): +3.01 PPGAB, +5.37 Per100, +5.19 WAR
  • Melvin Council (2026): +4.57 PPGAB, +8.03 Per100, +2.66 WAR (translates to +6.92 WAR over 39 games)

From a purely value perspective, Melvin has been even better than Tyshawn was at his best, to the rate of about a point and a half per game. Now this doesn’t mean that Council will have a better season; he still has to finish out conference play and the tournaments. How successful KU is, and how well Council leads the team during their stretch run, will also be a factor. Fans warmly remember Tyshawn being the PG of a national runner-up team. It is unlikely that Melvin will have that much team success. Furthermore, should Melvin have a few mediocre or poor games, his value marks will trend back toward where Taylor’s were in 2012. Still, it is undeniable that KU got a good point guard ala 2012 Tyshawn Taylor, they likely got a better version of him with the portal addition of Melvin Council.1

The next look at this will be more detailed. Do they actually play the same. I will posit that, despite notable similarities (position, height, body shape, skin tone, face shape, speed with the ball, average shooting abilities), there a quite a few differences as well.

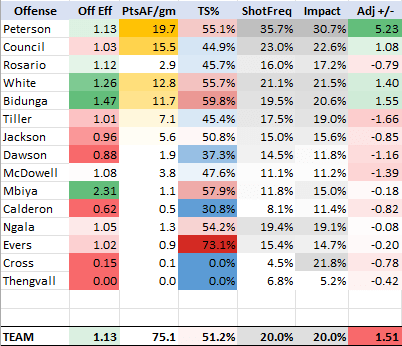
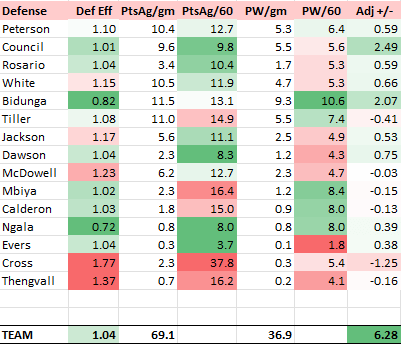
This is easier to see when we start breaking the player value down. In 2012, Tyshawn Taylor’s per game offense/defense breakdown was: +3.37/-0.36. He was an offense-heavy piece, taking 26.2% of the team’s shots (second on the team), did an excellent job of getting to the line (42.0 FT Rate), but also had a relatively high turnover rate (22.6).2 These numbers were also fairly consistent throughout his career. Sure, he was less important on offense before 2012, but he was always a better offensive piece than defender and he never became a good or even average defensive player.

Melvin, on the other hand, is a noticeably poorer shooter than Tyshawn was (Taylor was a career 37% 3-point shooter, believe it or not). Council’s TS% is currently 49.3% (in range with how he shot at St. Bonaventure and Wagner the prior two seasons), whereas Taylor’s TS% was 56.9% his senior year and never lower than 53.1% in a single season. Council doesn’t get to the line as often either (24.6 FT Rate).

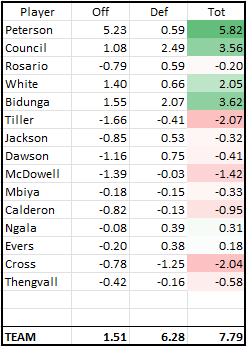
But Melvin handles the ball better. We should be careful some, given that the game has allowed for more liberal ball-handling maneuvers (and thus turnover percentages are down across the board), but Council turns it over about half the rate Taylor did. Melvin is adding an estimated 4.48 points per 100 on his ball-handling abilities alone (i.e. limiting turnovers while adding assists). We haven’t calculated Taylor’s ball-handling value component yet (this takes time to set up for past seasons), but a reasonable estimate would have him close to slightly above bubble-level. Overall, Council is a +2.28 offensive piece, about a full point worse than Taylor per game but still a very solid player on this end.

Where the differences lie, undeniably, is on the defensive end. We’ve gone over Taylor’s defensive weaknesses, but Council’s been KU’s best overall defender this season. He’s added +2.29 value points per game defensively (+4.02 per 100 possessions), and he’s done so in a system that relies on KU switching a bunch (meaning he has to be versatile as well). Council isn’t doing it through high rates of steals or rebounds (he’s about bubble level on these components), but through stinginess. Looking at Council’s game, other guards that put up similar offense/defense splits include Frank Mason as a junior (2016), Devon Dotson as a freshman (2019), and Mario Chalmers (especially 2008).3 With data going back only to 2018, there isn’t a closely similar player in terms of Council’s offensive breakdown among the three factors of scoring, ball-handling, and (offensive) rebounding. Council scores at a slightly-above bubble rate, but he’s been the best ball-handler since at least 2018, adding +4.48 points per 100 on this element of his game (Dajuan Harris’ best season was +3.83 and Devonte’ Graham’s 2018 year was +3.61 on this area, but Juan was a notably inferior scorer and Graham a notably superior scorer to Council so far).

In conclusion, Council has been even better than advertised and likely better than even KU fans are giving him for due to his defensive coverage and durability. While there are questions about his consistency doing this over a full season and ability to play alongside Darryn Peterson, there’s no denying that KU getting to 11-4 in a tough schedule without its star for 60% of the available games has been in large part to the play of Melvin Council. Council leads the 2025 team in POCWAB at +2.11, which is already in front of all players from last year over a full season aside from Hunter Dickinson.

  1. Currently, if we combine all three comparison looks at player value (per game, per possession, and per season), Council is playing as an 89.4%ile KU Jayhawk. Tyshawn Taylor in 2012 was at 90.4%ile. But this is comparing a full season for Tyshawn and only 15 games for Melvin. It’s likely that Melvin’s per game and per possession value regresses some, but his per season only grows. The best estimate is that he will have a more valuable season than Taylor did. ↩︎
  2. He was nicknamed “Tyshawn Turnover” after all. ↩︎
  3. Both Mason (2017) and Dotson (2020) would have offense-heavy seasons later in their careers. ↩︎

2025 College Football Ratings

Work in Progress. As of 1/4/2026, here are the Top 20 in Power Ratings:

  1. Indiana +38.11
  2. Oregon +31.55
  3. Ohio State +31.41
  4. Notre Dame +29.49
  5. Texas Tech +29.37
  6. Miami +26.09
  7. Utah +24.62
  8. Iowa +21.41
  9. Georgia +21.23
  10. Ole Miss +20.28
  11. USC +20.19
  12. Vanderbilt +19.91
  13. Texas A&M +19.66
  14. Alabama +19.53
  15. Washington +18.75
  16. Oklahoma +17.52
  17. Penn State +17.03
  18. BYU +16.50
  19. Texas +15.70
  20. Michigan +15.45

53. Kansas +4.46

The average ratings for each power conference is as follows:

  • SEC +12.57
  • Big10 +12.49
  • Big12 +6.67
  • ACC +4.26

Note that the best teams according to this rating are in the Big10 and Big12. Georgia is the SEC’s top team but doesn’t show up until spot #9. What the SEC does have in its favor is depth. Its worst team, Mississippi State, is #61 and bests 6 ACC schools, 6 Big 10 schools, and 5 Big 12 schools.

The playoff semifinals are set. Looking at these numbers, I’d put the odds as follows: Indiana (-6.5) vs. Oregon and Ole Miss (+6) against Miami. The actual odds are about -3.5 for Indiana and Miami, so these odds aren’t too far off from the market’s sentiment.

2026 Team – Christmas Break Review

The 2026 Kansas Jayhawks finished the non-conference portion of their schedule with a 10-3 record. At #17 in the AP Poll, #16 in KenPom, #15 in NET, and #11 in Torvik, the Jayhawks have proven they can play with about anybody with or without their star freshman, Darryn Peterson. KU has a +9.85 PPGAB value score (+1.82 Offense and +8.03 Defense), with KU’s defense ranking 7th in KP and 2nd in Torvik as of 12/23/2025. Torvik shows the Jayhawks with a +2.4 WAB.

The Waterfall chart above shows the total value per player. This is not rated in per game or possession, so it does a fine job of discounting Peterson given his limited minutes so far. We will look at the team by player, evaluating each’s role on the team now that we’re 13 games in.

Darryn Peterson

The much-hyped incoming recruit has been as good as advertised. Peterson is shooting an official 65.1% in true shooting on a high shot frequency (34.1% by our count), leading to an estimated offensive value of +14.5 PAB per 100 possessions. The problem at the moment is that he has only played 4 official games (and 20% of possible minutes) due to an ongoing leg injury.

The nature of the leg injury is oft-debated among the fans, many of whom have become frustrated by his unavailability. But let’s first look at his value profile. After all, he’s played in 4 games, helping KU win against power conference foes Missouri and N.C. State. Currently, he’s posting a team-best +7.09 PPGAB and +16.17 Per100. These numbers would put him in the top 99% of all KU players. Unfortunately, his limited playing time hurts his cumulative value. He is fourth in the team in WAR (+0.96), total PAB (+28.38) and POCWAB (+0.64). He has only played in one game in Allen Fieldhouse (vs. Green Bay), adding further frustration to the fanbase.

His overall value and place in KU lore will depend on what happens in the New Year. If he cannot play much more, and if he ultimately “shuts it down” and misses the bulk of conference play and NCAA Tournament on what appears to be a relatively minor issue, he will not be viewed favorably. However, if he can get healthy enough to play, his talent should catapult him into being a notable KU name among the one-and-dones.

Tre White

The senior transfer from Illinois, White was projected to be a comfortable above-bubble player but not a star. He’s far exceeded this, posting a +4.56 PPGAB and +9.08 Per100, helping him to lead the team in overall PAB and WAR. White is the team’s third-leading scorer in PPG (second overall) but is doing so at an incredibly high efficiency (67.9% TS). Lately White’s defense has also been solid, adding value by being a versatile iso defender who doesn’t get beat or allow many open 3’s for his man. He’s also KU’s best wing rebounder, complementing the Kansas bigs.

Without Peterson the question of how KU will score is still an issue, but White has stepped up admirably. White’s Per100 percentile is at 93.4% of all KU rotation-player-seasons since 1993. This puts him in the company of 2008 Mario Chalmers and 2023 Jalen Wilson.

Melvin Council

Council has been a fan-favorite since the off-season, but even the biggest Melvin Council fan couldn’t have predicted a season as well as the one Melvin has started to produce. He’s putting up a +4.32/+7.75 season so far, and is the team-leader in POCWAB (+1.67) thanks to a 36-point performance against N.C. State. Melvin’s durability is in sharp contrast to Peterson’s. Council has played a team-high 83% of possible minutes (he played an astonishing 93% of minutes last season, indicating there’s more in the tank for Kansas if they need him for Big 12 play) and in 33 or more minutes against each power conference opponent KU has faced.

More detail about Council’s value profile shows that he is a very good defender. His stinginess has disallowed easy baskets for opponents, and for a guard he rebounds quite well. His offensive profile is solid despite low shooting marks. Council’s best weapon is his ball-handling, indicated by his official 3.7 A/TO ratio (we indicate that this aspect of his game adds to the team 4.7 points per 100). Melvin’s low shooting marks have been improving since the N.C. State game. He has more confidence and is taking better shots in recent games.

Flory Bidunga

Among those who have been available (so, excluding Peterson), Flory is right along Council and White in terms of value. KU truly has a “big 3” of solid pieces this year, ironic given how much derision KU’s big 3 got last season. Flo’s current value marks are +3.85 and +7.60. He’s the team’s best rebounder by far and a menace around the rim (32 total dunks), particularly against weaker opponents. Flory’s opponent-adjusted numbers have been better against non-power conference foes (+5.70 per game) than for power-conference opponents (+2.69). Hopefully Flory can maximize his play against the better teams.

In a sense Bidunga might be KU’s most important piece. His rim protection and rebounding are clearly absent when he’s out of the game. He’s KU’s only real inside presence with solid value as we will see, so when he’s out, KU doesn’t really have much behind him.

Bryson Tiller

Now we arrive at the Kansas player with the fourth-most minutes played on the team. After Peterson and KU’s durable big 3, Tiller is the player Self trusts the most. Bryson had a break-out game, really half, against North Carolina in Chapel Hill by making 4 three-pointers out of 4, but has struggled to shoot from deep since.

His overall value is frankly not good. His TS% of 53.8% looks solid enough, but this is done off of assisted baskets primarily. He’s not great at getting his own shot, either by iso work or in put-backs (especially for someone his size). He plays soft at the rim at times, leading to missed layup chances and blown defensive coverage. His value (-2.52/-5.81) profile fits alongside someone like 2018 Mitch Lightfoot. He grades out as KU’s worst rotation defender on a per game basis (second-worst on Per100 basis).

Tiller’s playing about as well as one might expect a lower-ranked true freshman to. It’s not the end of the world. He has clear talent and skill that should lead to better things down the road. But he’s nowhere near the player many think he is, and the staff should play him less.

Jamari McDowell

McDowell has emerged as KU’s fifth starter when DP is out, and though he only had his first double-figure game of his career in the most-recent one against Davidson, McDowell has put up solid, bubble-level marks (+0.02/+0.06) while playing 44% of minutes. Jamari is doing this by hitting his threes (42.4%) and playing solid defense. He doesn’t create much offense, though he does see the floor well and has positive ball-handling marks with a 2.25 A/TO ratio.

The interesting thing to see will be what he can do if/when teams start crowding his shot. He has only taken 5 shots inside the arc (compared to 33 outside it) this year. The better teams will look to make him beat them off the bounce.

Elmarko Jackson

Jackson is the other returnee that Self has played more in games Peterson has missed, though Elmarko has been far inferior. Jackson’s value (-2.03/-7.02) has been plagued by very poor performances around a few solid ones. Elmarko scored 17 against Tennessee in KU’s comeback win in Las Vegas and followed that up with a solid 11 against stingy Connecticut, his two best efforts of the year. However, since that time he has only scored 5 total points in 78.5 total minutes. One area Elmarko has looked better in recently has been his ball-handling, which on the year is slightly above-bubble.

Aside from this, Jackson hasn’t been a good defender, he hasn’t rebounded in part due to his position, and he doesn’t do a lot to contribute on offense either. Jackson’s best role should be to put defensive pressure on opposing players and to spell Council when KU’s starter needs a break. While everyone has bad games, Jackson needs to find a way to make his bad games not outright terrible ones. Either way, Self is likely playing him too many minutes.

Kohl Rosario

Rosario is the third guard/wing type that Self is trying to fit in. Kohl has been electric at times finishing dunks. He’s 14-15 this year inside the arc (all at the rim), including 10 dunks. He makes hustle plays on the glass, and when it’s all said in done, is a bubble-level player (-0.03/-0.09). What is holding him back is a quick trigger (13-47 from 3, 27.7%) and little offensive creation abilities. He just isn’t anywhere near a KU-level player on the offensive side of the ball at this time.

His defense has been solid, especially guarding his man. He among the leaders in stinginess, adding about 5.3 points of value per 100 possession in this regard. Combined with a decent ability to generate steals and an average defensive rebounding profile as a guard, Kohl is a +4.2 per 100 defender. I’d roll with him over Jackson for the most part.

Jayden Dawson

Dawson rounds out our rotation of guards/wings that Self has experimented with, and despite coming in as an offensive weapon who could score with questions on his defense, Dawson has been a defense-first player with very poor offensive marks. Overall, his value (-0.28/-1.34) indicates that he has only earned a back-up role at this point.

It’s not always possible to know if the reason someone is shooting well or not is due to opportunity, but Dawson’s 6-26 (23.1%) mark from 3 hasn’t been what KU thought it would get. If Dawson played more there’s reason to think those numbers would increase, but at the moment someone like McDowell has hit shots at a higher clip. Ultimately, one has to believe that Dawson will have his moments and produce at some point even if he never becomes a star while in a Jayhawk uniform.

The Rest

Paul Mbiya gets a special call-out due to his position. Mbiya, though not a full rotation player (8.7% of minutes), does play as a back-up big whenever KU’s 2 main bigs are in foul trouble. This has led to the freshman center appearing in 10 of KU’s 13 games, including big minutes against Tennessee. Mbiya isn’t the most mobile, but he does have size and length that he uses well. His value numbers (-0.05, -0.62) are high enough to make you wonder if he should be getting some of Tiller’s, but we surmise that he would be exposed given KU’s defensive style.

Samis Calderon (-0.76/-6.88) is an athletic and potentially solid player, but he doesn’t have the ball-skills to do much on offense at this level at the moment. But his defense has allowed him to get spot minutes here and there.

Nginyu Ngala (+1.44/+17.98) torched the nets early on in spot minutes against weaker opponents, but Gee has only played 3 total minutes against power conference opponents this season (all against Syracuse). His size his limiting his ability to contribute.

The walk-ons have all appeared in 4 games each. Wilder Evers (-0.43/-9.44) is the only one to have scored (3 points), Justin Cross (-0.65/-20.90) has added an assist this year, and Will Thengvall (-0.51/-17.56), the only native Kansan on the roster, has a defensive rebound to his name.

Conclusion

The 2026 Kansas Jayhawks are getting much more from three starters than expected, and even without Peterson have been noticeably better than last year’s team. On the year the team is +8.76 in games without DP (and +12.31 in games he’s played). While KU needs Darryn back to be at its best and have the best chance at making a Final 4, even without him they can win games with elite defense and timely shooting.

All things considered, it’s better that KU isn’t reliant on one player like it looked they might be, and should Peterson get fully healthy, missing him for a large portion of the non-conference might be a benefit in that it helped others build confidence. Adding Peterson to the play of Council, White, and Bidunga is an exciting thought.

A Modest Proposal on the CFP

Recently we discussed that the sport of college football and its postseason was a mess of contradictory goals and values, ending with the statement that we don’t have a good fix for it. However, we do want to address what we see as the major issues of the sport and hopefully provide a better system. If it were up to us alone, we’d blow up the playoff completely and go back to smaller, traditional, regional conferences that play in traditional bowl games (i.e. Big 10 vs. Pac 10 [yes Pac 10 not 12] in the Rose Bowl). We’d also mention that a “plus one” system after the traditional bowl season wouldn’t harm things either…in other words keep the traditional bowl games and then re-rank teams in early January, taking the final two teams to play in a CFP championship game on a neutral field.

Of course this idealized version prioritizes tradition and pageantry over an objective playoff system, something the fans tend to want. So here’s our modest proposal. It is three-fold in how it is set up:

  • Use the model of the NCAA Tournament in basketball. Expand the field to 32, include all conference champions automatically, and then seed teams in an S-curve format.
  • Determine the field through a list of objective criteria, effectively doing away with the committee and (much) human opinion.1
  • Maintain the beloved and long-running 6 bowls as the quarterfinal and semifinal rounds of the playoff. The first two rounds (R32 and R16) will be on-campus games hosted by the better seed.

To set this up as a trial run, we did a mock exercise today (12/5/2025), just before the conference championship games kick off this weekend. In order to determine automatic qualifiers, we assumed each betting favorite as the winner of its respective conference championship game.

Using ESPN’s data, we set up a ranking system which included these following 5 categories under various weights:

  • Strength of Record (SOR): 40%
  • Football Power Index (FPI): 10%
  • AP Poll rank: 10%
  • Game Control (GC): 20%
  • Average Game Win Probability (AVGWP): 20%

The weighted average of each team’s ranking in these categories is then ranked, producing a final S-curve ranking. Of course these weights and metrics are open to change. We would also recommend not using ESPN’s data for these rankings and instead introduce a truly-independent team of statisticians to set up these criteria. But for our purposes, we used ESPN’s numbers to highlight what a bracket might look like.

Now that the S-curve ranking is set, we now go to the bracket. First, we have to include any conference champion otherwise outside the field. This means that presumed champions Boise State (MW), Kennesaw State (CUSA), and Western Michigan (MAC) knock out teams 30-32 on the original S-curve.

Taking #1 on the S-curve, Ohio State, we place the Buckeyes in the top-left corner against the #32 S-curve team, Western Michigan. Then, taking each team’s current FPI ranking and adding 2.5 points for home field advantage, we estimate that Ohio State would be 35.9 point favorites, corresponding to a 97.5% winning rate. We do this for each team to get a bracket that looks like this.

This bracket was set up using a rigid S-curve, which does differ from the basketball tournament where the committee has certain bracketing principles that prevent teams who played each other in the regular season to play in the first round, etc. We could introduce these same principles in football, i.e. switch things around in some of the potential 2-seed vs. 3-seed matchups so that prior matchups during the year (Georgia/Alabama, Notre Dame/Miami, and Ole Miss/Oklahoma) can’t recur in the round of 16. There are arguments to be made for either system (i.e. the NFL doesn’t adjust seeding to avoid inner-divisional matchups in the Wildcard round), and we don’t have strong opinions either way.

One might notice that the 1-seeds have a decided advantage by drawing lower-ranked, AQ teams; this mirrors basketball where the 1-seeds have a 98.8% winning probability since 1985 (158-2). The 4/5 matchups are mostly close games, though a few non-power conference champs with good records did overachieve to earn 5-seeds.2

Each conference gets a fair shot at making the field. Here is how conference bids shake out:

  • SEC – 9
  • Big Ten – 8
  • Big 12 – 4
  • ACC – 3
  • American – 3
  • FBS Indp – 1
  • Sun Belt – 1
  • Mountain West – 1
  • CUSA – 1
  • MAC – 1

In a surprise, the American Athletic Conference (AAC) got in three teams to tie with the ACC, a traditional power league. Next up is the Big 12 with 4. The Big Ten has 8 and the SEC has the most with 9 teams in the field. These numbers compare to basketball, where the best conferences tend to get around half of their teams into the Big Dance.

Just missing the field are the following teams, who were technically in the top 32 but got bounced out due to the provision that each conference champ gets in:

  • TCU (#30)
  • SMU (#31)
  • Louisville (#32)

This indicates that the Big 12 and ACC are close to getting more teams in, and that some years they likely would get 5 to 6 instead of 3 to 4. This seems justifiable given the relative strengths of the leagues.

This and That

We set up a hypothetical first round schedule, taking place on Friday, December 12 and Saturday, December 13. Starting at noon with Tulane at Georgia on ESPN, 8 games are played on Friday followed by 8 on Saturday. These games are presumed to be broadcast on ESPN’s networks, and like the basketball tournament these games have staggered start times and can be enjoyed all day.

Since we are using the AP poll, the question arises as how to rank teams that aren’t in the top 25 or even receive votes. We thought the best thing to do would be to take all the teams that aren’t in the top 25 (actually ~ 37 with teams receiving votes) and then rank the rest based on SOR. This won’t make a huge difference but will ensure that a team on the margin isn’t unduly punished or rewarded for not being ranked. Another suggestion would be for AP voters to rank a top 50 or 75.

Simulation

The final step would be to play the games. We simulated one instance to see how this might play out. In the first round, the Pitt Panthers knocked off A&M in a surprise 7-seed over 2-seed upset. But the upset of the tournament was Kennesaw State’s win over Indiana despite the Hoosiers being 37.5 point favorites. In the second round, Texas got revenge at Ohio State and the Buckeyes fell. Pitt continued its Cinderella run by beating BYU. Miami won at Notre Dame in a mild upset as well. The quarterfinal games are played at traditional bowl games with home field advantage being erased, and we had the best-remaining team Oregon selecting to play the Rose Bowl against Oklahoma. The Sooners would upset the Ducks in this sim. Next was Michigan playing Miami at the Orange Bowl, a de facto home game for the Hurricanes who would also win. Next was Alabama and Texas in the Peach Bowl (Tide would roll) and lastly Texas Tech over Pittsburgh in the Sugar Bowl, with Tech opting to play in New Orleans as the second-remaining 1-seed in the field.

The semifinal games would be Texas Tech defeating Alabama in the Cotton Bowl and Miami edging Oklahoma in the Fiesta Bowl. The final would showcase Texas Tech (-1) against Miami, with the winner being Miami in a close contest. Quite a wild sim.

Conclusion

Leaning into the March Madness model would expand the playoff (leading to more revenue), ensure each conference gets a bid, avoid the mess of having good teams miss the playoff (teams who miss the field starting around 30 don’t really have much argument), and still keep some tradition by having six prestigious bowls serve as playoff rounds just as with the 12-team format. Additionally, utilizing objective metrics in a sensible way could help avoid much of the bias perceived to be in the sport. Of course a committee could still be used to aid in setting the field should bracketing principles be part of the exercise, or even helping provide a human element to the poll portion of the ranking. We do think it necessary to move away from a pure committee model at this junction, however.

  1. The AP poll would play a small part of the final ranking ↩︎
  2. Looking at things closer, this may have been due to ESPN not adjusting to opponent for its AVGWP metric, essentially aiding teams with weaker schedules. Again, don’t take this bracket too seriously, it was merely our first attempt to construct a 32-team field. Presumably these metrics would be sound if implemented. ↩︎

The Mess That is College Football

The chorus of fans that wanted a “playoff” to determine the college football national champion eventually won out over tradition, and bowl season was effectively changed for good in 2024 when the 12-team CFP was introduced. Before this time, though traditional conference affiliations to bowls had been relegated to a secondary concern in place of getting the appropriate teams for whatever format (be that 2-team BCS or 4-team CFP), at least the tradition of the teams playing in bowl games tiered to similar-quality opponent was in tact. The only thing that really changed from the BCS era to the 4-team CFP era was a “plus-one” system where the winners of the two semifinal bowls met for the national title instead of just having the top two teams play each other as was the case during the BCS era.

But nowadays, the 12-team playoff means some important differences exist compared to past postseason eras. Firstly, the four losers of the first round CFP games (which are played on-campus) end their seasons without appearing in a bowl at all. This is a huge departure from tradition. These are some very good teams that don’t get to experience a bowl and end their seasons in mid-December instead of around New Year’s Day. Secondly, the four winners of the quarterfinal rounds play in 2 bowl games and the two semifinal winners will play at three neutral-site locations. This means that for a team like Ohio State last year, they will have won both the Rose Bowl and the Cotton Bowl (and CFP Title game) in the same season. Obviously no one had done this before because no one had the chance to do so. These changes–good teams not going to a bowl and better teams winning two bowl games in the same season–effectively changed the sport for good.1

While it may take some getting used to, this system could be worth it if it solved the dilemma fans wanted solved–a legitimate playoff system that didn’t exclude championship-contending teams and was fairly adjudicated to give all teams a fair shot at making the bracket.

Some “debates” are inane and should be immediately dismissed. Most mid-major teams with good records aren’t actually as good as the power conference teams with worse records based on much more difficult schedules. There’s a lot of silliness out there that wants to promote the underdog when it is nakedly obvious this underdog doesn’t belong. We won’t do that here.

Rather, what the 2025 playoff selection is shaping up to be is a complete mess. Teams are bunched, the order of the teams after about three doesn’t make much sense, and the sport still can’t answer what should qualify a team for the playoffs–resume, dominance through power metrics, some blend of the two, etc. The committee’s answers of where they slot the teams varies and is often contradictory.

The best way to explore this deeper is to look at the field as constructed. Below is the committee’s top 16 teams in order along with their overall records.

RankTeamRecord
1Ohio State12-0
2Indiana12-0
3Georgia11-1
4Texas Tech11-1
5Oregon11-1
6Ole Miss11-1
7Texas A&M11-1
8Oklahoma10-2
9Alabama10-2
10Notre Dame10-2
11BYU11-1
12Miami10-2
13Texas9-3
14Vanderbilt10-2
15Utah10-2
16USC9-3

There are a few questions that immediately arise seeing this list. After the two undefeated Big 10 teams, there are six 11-1 teams all from power conferences. The first five of these teams fill out spots 3-7 but the last 11-1 team, BYU, drops all the way to 11. BYU is behind three 10-2 teams for no discernable reason. Is the committee unaware that BYU is now in the Big 12 and has defeated ranked and bowl-bound teams like Utah, Arizona, and Iowa State? They are no longer playing Mountain West teams or a mismatch of teams under an Independent schedule.

Nonetheless, even if BYU were ranked in spot #8, the committee would still have to answer why they sorted the six 11-1 teams in the way they did. And the same thing with the 10-2 teams.

Let’s look at Texas A&M, a team that had been undefeated and at #3 before a loss to rival Texas on Thanksgiving weekend. A&M fell to #7 for a loss that certainly isn’t a bad one, and behind four other 1-loss teams. Now maybe the Aggies are the 7th best team in the country, but it is tough to ignore the strong evidence that the timing of the loss they suffered hurts them. When a team lost during the college football season has mattered for a long time, but one thing the committee system and the 12-team playoff was supposed to avoid was this dilemma. Had A&M lost to Texas in Week 1 and rattled off 11 straight wins, they would very likely be higher than #7. Given that being #6 or better is shaping up to be a much better draw in the bracket that spot #7 (we’ll get to this aspect later), this makes things all the messier.

Looking at the 10-2 teams, the order of the teams once again is something that has not been objectively determined, but one thing that stands out is Miami sitting behind Notre Dame. Despite having the same record and a head-to-head win, the Hurricanes are below the Irish and currently outside the bracket while Notre Dame is currently in. Head-to-head is one of the few things that the committee is allegedly tasked with including in their analysis. So why is the order the way it is?

Consolidation and Mega-Conferences

Another change that gets overlooked when looking at the playoff selection process is the fact the conference landscape has evolved further with the elimination of the Pac-12 (at least as a power conference, I know it will technically be re-established next season with Wazzu and Oregon State adding Mountain West teams) and 10 teams shifting to the Big 10, Big 12, and ACC. Additionally the Big 12 lost perennial powers in Texas and Oklahoma to the SEC.

This consolidation of college football conferences has done two things. It has made things so there are fewer power conference champions and fewer conferences to legitimately consider as being multiple-bid leagues, and it has also made it so conference schedules are quite different from team to team. Just because two teams in the same conference share the same conference record doesn’t mean their seasons were equally impressive. Perhaps A&M’s relatively-weak SEC schedule is another partial reason they dropped as far as they did.

The SEC has taken advantage of the larger league to put an astounding 7 teams in the top 14 of the rankings. Georgia (3), Ole Miss (6), A&M (7), Oklahoma (8), Alabama (9), Texas (13), and Vanderbilt (14) are all teams with 6-2 conference records or better. Of these teams only Texas has failed to win at least 10 regular season games (more on this later). These teams effectively won against the lower competition in the league and then shared wins and losses against each other.

Out of Conference Schedules

Texas A&M scheduled Notre Dame and won. But they played this game in Week 3 so it is not as fresh in the committee’s mind. Texas scheduled Ohio State and loss in Week 1, which gave them a third loss to go along with their 6-2 SEC record and 3 other non-con wins. This of course leads to the very real question, how much should a team be punished for playing a very difficult game that almost everyone would lose? Had Texas played a weaker Big 10 team, like Wisconsin or UCLA, they’d almost certainly be at 10-2 with wins over A&M, OU, and Vandy2 and in a stronger spot than #13.

Speaking of scheduling, the SEC has gotten criticism for only playing an 8-game conference schedule, though it should be pointed out that all SEC teams are required to play an out of conference power opponent. So just as Big 12, ACC, or Big 10 teams do, SEC teams play at least 9 power-conference foes each year. Another aspect is the fact SEC teams often schedule an easy out-of-conference opponent late in the season (often the week before their big rivalries). If when you lose matters to the committee, and we all know it likely does, then there is an advantage to scheduling easy wins for your 11th game of the year. While not against any rules, it is just another function of how messy the sport of college football has become.

Playoff Selection Rules – Trying to Make Everyone Happy

One thing that is not the committee’s fault (but is the fault of the designers of the CFP) is the rule that 5 conference winners must be selected. This rule was put in to alleviate concern that the little guy wouldn’t be shut out of the playoff system, but will effectively make a mockery of the bracket. Last year we saw the additional rule that the top 4 seeds had to be a conference champ (which led to both the 3-seed and the 4-seed being double-digit underdogs to the 6-seed and 5-seed in the quarterfinal round), though this rule has been eliminated for 2025. Still, if the playoff were today then only the top 10 teams would get into the field, with the final two spots going to two conference champions not yet represented in the field.

Making matters worse, #12 Miami is not the likely ACC representative because the Hurricanes aren’t even playing in their conference championship game (partly due to unbalanced conference scheduling due to the conferences being so large). The winner of #17 Virginia and unranked Duke will be crowned ACC champion. While Virginia will get in and be the #11 team in the bracket with a win, 5-loss Duke actually might not get in should the Blue Devils knock off the Cavaliers3. In this scenario the winner of the American Championship (between #20 Tulane and #24 North Texas) would likely get a guaranteed spot as conference #4, and should #25 James Madison win in the Sun Belt (where it is heavy favorites to do so), the Dukes–not Duke–could be the final conference champion to earn an auto bid.4

This is a giant mess. Not only has the 12-team playoff system not eliminated controversy, it has in fact added new ways of controversy!

Is Objective Any Better?

We come to the point of the article where I’m supposed to tell you that an objective system, something that takes into account each team’s schedule and results on the field and other metrics will give us an answer as to how teams should be ranked. But sadly this also isn’t the case. Let me show why.

An objective system is anything that uses non-subjective criteria that can rationally be tied to what the sport is trying to do, which is presumably field a fair 12-team playoff. The word fair is italicized because the current CFP system doesn’t really even list an objective standard or goal for how it wants its 12 teams to be viewed, so there is ambiguity as to how the committee even should be selecting teams. They don’t focus on most-deserving or even best. Obviously the the fifth-best conference champion isn’t going to be among the 12 best most years. And most-deserving would indicate privileging a team’s resume over its computer power metrics, something we will see briefly.

So to make as objective of a system as I could, to demonstrate, I took two different sources (Kelley Ford and ESPN) and also two different metrics from each–one resume metric from each and one power metric from each, and got an average ranking for all four of these metrics to then “objectively” rank the teams.

Objective RankingTeamKFord PowerKford Most DesESPN FPIESPN SORAvg.Committee RankDiff
1Indiana11211.252+1
2Ohio State22121.751-1
3Oregon43443.755+2
4Georgia85856.53-1
5Texas A&M1041036.757+2
6Alabama610687.59+3
7Texas Tech5115107.754-3
8Notre Dame313313810+2
9Ole Miss1271279.56-3
10Miami7127141012+2
11BYU17615611110
T12Oklahoma13916911.758-4
T12Vanderbilt148141111.7514+2
14Utah9159151215+1
15Texas1514131213.513-2
16USC1116111713.75160

There’s a lot here, but basically the objective ranking is averaging the four criteria with a straight average and then sorting from best to worst. The final column looks at the difference between what the CFP committee said and what it would be under this objective ranking.5

As we see, even an objective system introduces problems. To begin, the top three teams are all Big 10 teams. Assuming the Ohio State/Indiana Big 10 championship game is a close contest and the loser doesn’t fall much, the final objective ranking system would produce the top three seeds from the same conference.

Now maybe this is the fairest thing, after all it isn’t impossible for the Big 10 to have the three best or most-deserving teams, but with unbalanced schedules, note that only Indiana and Oregon have faced off against each other (and Oregon avoided other solid Big 10 teams like Michigan). The point is that it looks messy for college football, a sport which once pitted teams from different conferences in the post-season bowl system to see which region of the country truly had the best football teams, to now have inter-regional mega-conferences which have all the talent and are stacked at the top of the 12-team bracket.

Moving beyond this, we see that 2-loss Alabama actually jumps from #9 to #6 in this system, ahead of 1-loss Tech, Ole Miss, and BYU. If the committee had the Tide currently at #6 everyone would be saying this was because of brand bias. But here’s a system, unbiased as I could make it, saying the Tide are under-rated.

If we explore further, we see that teams have vastly different power rankings and most-deserving rankings. BYU is ranked as the 17th or 15th-best team (using power metrics) but the 6th most-deserving team. When we average this out we get the Cougars as #11. Texas Tech, their Big 12 opponent in the conference championship game, is kind of the reverse (#5 in both power metrics) but #11 or #10 in terms of resume.6

The objective system does help 11-1 A&M (who lost late in the season, something the objective system avoids considering) and Notre Dame (who some think are included due to brand). It also catapults Miami into the top 10 and kicks Oklahoma down to 12.

To Play or Not to Play

Another messy thing is that certain teams will play a 13th game while others will sit at home this week. Alabama, sitting at 10-2 and at #9 in the standings, would certainly like to beat Georgia and move up but should the Crimson Tide lose, this would push their record down to 10-3. While the committee has indicated it wouldn’t necessarily punish them for this, a double-digit loss to the Bulldogs might change people’s minds. Georgia is 2.5 point favorites, so this is a real possibility. But why should Alabama be punished for being good enough in SEC play to play in this game when #6 Ole Miss and #7 Texas A&M sit comfortably in the field?7

Contrast this with Notre Dame, a team at #10 who could benefit from being idle. Certainly the Irish would fall below current #11 BYU should the Cougars win against Tech, but they could also jump ahead of Alabama should the Tide lose. Notre Dame will want BYU to lose, but should the Cougars win, certainly Bama to then fall to Georgia.

Looking at Texas Tech, at #4 this team would skip to the quarterfinal round had the playoff started today. A win might move them to #3, but only if Georgia loses to Alabama, but in all reality there is more risk in playing and losing the Big 12 title game than in what they get for winning that game. And this is the messy part. Instead of conference championship games being crucial for a team’s bowl assignment and potential for playing for a national championship, they are instead a potential hindrance and introduce the concept that it can sometimes be better to finish third in your conference instead of second.

Concluding Thoughts

In trying to wrap this all up, I think the main idea is that the sport of college football is a broken system. The incentive structure is off on many layers–scheduling tough teams can unfairly hurt teams that lose these marquee non-conference matchups, when you lose games in the season matters, brand names seem to get a boost in the eyes of the committee, the 12-team format means the conference championship games can introduce more risk to a team’s national title hopes than reward, the postseason format has changed much of the charm of once the sport once was, conference realignment has dramatically altered the regional nature of the sport, the size of these consolidated conferences has introduced unbalanced schedule issues, the desire to include the “little guy” in lesser conferences can unfairly exclude much better teams in the power conferences, and finally and perhaps ultimately there is no real objective or clean way to tie all these loose ends together.

The sport of college football is a mess, and one we don’t really know how to best fix. Returning to smaller conferences and traditional bowl tie-ins would help things feel like the “good ole days,” but those days had their own problems and led to where we are now. Growing the bracket from 12 to more teams would further diminish the bowl aspect of the sport’s postseason and likely introduce more issues.

Addendum

We didn’t even mention the Lane Kiffin drama. A team who is #6 in the playoff ranking and will almost certainly host a CFP first-round game (and likely be strong favorites to win that game) has lost its head coach to a rival in-conference school. There is very little guidelines as to when coaches can be fired and hired, the portal and NIL issues also dictate much of what happens and are poorly regulated, adding to even more messiness.

  1. Technically winners of the four-team CFP also won two “bowl” games though the CFP National Championship game was never labeled with the “bowl” label. And even more technically the BCS era introduced an additional National Championship Game that was outside the bowl system, though this NCG was played a week or so later at the same site of the actual bowl game. ↩︎
  2. UT’s loss to Florida is a solid rebuttal and one the committee pointed out. But at 10-2, with losses to Georgia and Florida while also having solid wins, Texas would be on much firmer ground than they currently are. The point is that they were effectively punished for scheduling a big time opponent. ↩︎
  3. This is not that unlikely. Duke is only 4-point underdogs and has a 43.7% chance of winning according to ESPN’s FPI. ↩︎
  4. Frankly I’m rooting for this scenario. The CFP criteria is that it takes not members from 5 different conferences, but rather that it takes the top 5 conference winners among its 12-team field. The ACC would have Miami, a team in the top 12, not get into the playoff but be leapfrogged by conference winners in the American and Sun Belt who are ahead of the ACC’s actual champion, currently unranked Duke. ↩︎
  5. Note that “objective” does not equate with “accurate” or “true.” Objective just means we select a set of criteria that isn’t determined by brand name or a committee’s opinion. We just take what the computer calculations are and rank the teams. ↩︎
  6. Another messy aspect is that Tech and BYU played each other in the regular season and Tech won handily. With both teams at 11-1 and in the same conference, if we went purely by just resume, BYU would have the better argument despite being outmatched in the teams’ first meeting. ↩︎
  7. Alabama can’t blame the anyone but themselves for losing in Week 1 to Florida State, but in the scenario where they lose to Georgia in the SEC championship game and fall out of the top 10, what will prevent them from being in the field is the fact they won the tie-breakers among the 7-1 SEC teams (and went 10-2 with a loss to non-conference FSU instead of going 10-2 with two SEC losses). ↩︎

Through 5 Games – Peterson is Currently Out

The 2026 season is turning into another one of “those” seasons. Like 2024, when KU was without Kevin McCullar for much of conference play, hoping he would be healthy enough for the NCAA Tournament, only to find out a few days before the First Round that he wasn’t going to play again for KU. (That same season there was question about Hunter Dickinson’s availability, as the center did miss the Big 12 game with injury). Or like 2014 when Joel Embiid’s seemingly-mild back injury lingered until the tournament. We were told that Embiid might have returned if the team made it to the Sweet 16, but this is tough to believe in retrospect. Or what about 2015? Kansas lost burgeoning big man Cliff Alexander to an eligibility concern late in the season, never to play him again as he was never cleared. The Hawks lost an interior presence and solid scorer en route to a Round of 32 loss. Remember 2018? That’s when KU’s fan base waited and waited for a thin frontcourt to get needed depth, hoping that Billy Preston and/or Silvio De Sousa would get NCAA clearance. Finally De Sousa was cleared (this turned out to be a pyrrhic victory) but Preston would never suit up to play for Kansas in a regular season game. 2011 was a bit similar with Josh Selby. As was 2016 with Cheick Diallo. In the end, both heralded prospects would eventually be allowed to play though there was still drama as to when they could see the court. We could throw 2019 in the mix with Udoka Azubuike’s injury, the difference being that after the news broke that Doke was hurt we were informed that his injury was a season-ender. 2023 wasn’t great either; we saw Coach Bill Self’s health scare, and the team was without their hall-of-famer for the Big 12 and NCAA Tournaments. 2022’s Remy drama turned out for the best given how the season ended, but this was yet another incident in what seems like the endless off-court saga surrounding Kansas basketball. We could also throw in the Arterio Morris situation, everything that surrounded the FBI investigation and NCAA scandal, and of course yearly recruiting/portal drama.

What these incidents share in common, for the most part, is that there is an important Kansas player that is out indefinitely. Desiring information as to how long said player is expected to be out, the media asks Coach Self for details about the situation. Then, Coach Self gives a pseudo-answer couched in vague phrasing, leading to the fan base to go read between the lines or outright speculate as to what’s really going on. This season, this drama has centered around top recruit Darryn Peterson and his cramping hamstring injury1.

When he plays, Peterson has looked exceptional in his 2 official games (and 3 total including the first exhibition). He has scored, handled, and defended like a professional. His charted value has matched the eye-test, producing a PPGAB of +8.72 and Per100 of +20.35 in 50 minutes of regular season play. Peterson’s value above bubble is all offensive-based, indicating sustainability. One assumes his defense will level out at a solid number (maybe around +1.00).

But this is all for naught if he doesn’t return. No matter how good of a teammate he is, the Jayhawks need him on the floor. The fact he isn’t, combined with the fact there has been conflicting information on his injury, combined also with the fact it seems like something similar happens every year at KU, combined with the fact that KU has struggled (relative to expectations) in recent seasons has put an already fidgety fan base further on edge. Assume Peterson can come back, and assuming this injury doesn’t recur at an inopportune time, KU has a competitive team with pro talent, athleticism, and depth across the board. But that’s a few big “ifs.”

Regardless of Peterson’s availability, Kansas will need other players to add value if it wants to maximize its chances of success this season, and the two that have emerged as clear value-adders this year are Flory Bidunga (+5.01/+10.80) and Tre White (+2.36/+5.22). Both have been extremely efficient (75.0% TS% for Bidunga; 70.3% TS% for White) with the big difference so far being that Bidunga has added defensive value while White has lost value on this end. I’d like to see about 12-15 games before really judging defense, but for White this is partly due to him being asked to carry more of the offensive load. He’s scored in double figures in the team’s last four games, working hard to get to the line (attempted 29 FT’s, nearly 6 per game) instead of settling for less-efficient jump shots.

After these two, senior transfers Melvin Council (+1.24/+2.45) and Jayden Dawson (+0.72/+2.24) have been serviceable KU-level rotation-types. Neither has shot the ball all that well, so hopefully there is additional room for growth if shots start falling. Both are competing defensively and have added value by being in the right spot and not giving up numerous easy baskets. I think Dawson in particular will have to start hitting shots, as his current defensive value (+2.13 per game) is likely unsustainable.

Next is a couple of freshmen who people are excited about, but the value scores have started to reveal that these players are indeed still freshmen. Kohl Rosario (-1.30/-3.33) and Bryson Tiller (-1.49/-4.17) have each shown signs of athleticism and skill. Each belongs on this team, and getting a second and third year at this program will only pay dividends for both Kansas and their future pro careers. But this season, there have been signs that their games have much improvement to do. Rosario has shot the ball poorly from downtown (yet continues to hoist up tough shots) and can get lost on defense by over-pursuing at times. Tiller’s defense isn’t great, but while he has been shooting well from deep he hasn’t scored inside enough or shown enough skill that he can make plays on the block. Given his height and frame, he needs to be more than just a pick-n-pop threat.

This is KU’s clear top seven, though it is currently six with Peterson’s injury. And that is another thing that shouldn’t get missed. Peterson’s absence hurts Kansas in two ways. Obviously the team is worse when he is not out there. KU’s #2 scoring threat has to become the #1 option, #3 has to slide up to #2, and so on. But the less-obvious way it hurts Kansas is due to depth. KU now has to go deeper into its bench. Let’s look at how that bench is doing.

KU has two returning perimeter players, both of whom are redshirt sophomores after having sat out last season. Jamari McDowell (-0.38/-2.69) has played less (20.5% mins) but been a bit more valuable than Elmarko Jackson (-3.93/-13.71) (42.0% mins). Both have been poor offensively (McDowell -8.40 Per100, Jackson -12.83 Per100) with McDowell grading out better on the defensive side of things in the early-goings. If we’re being frank, neither has shown any reason why he should be playing outside of garbage time.

Other potential minutes, this time at the forward/center positions, are Paul Mbiya (-0.53/-5.39) and Samis Calderon (-0.76/-6.59). Neither has shown much offensive ability at the major conference level. Spot minutes, particularly to spell those in foul trouble, would be all one could expect here.

This is the top 11 players in terms of minutes played, with 7 clearly being at or above the line while 4 are below it. Still there is one final player that needs consideration – Nginyu Ngala. Gee has only played in the 3 home bye games so far, but he is playing very well in these (+3.78/+34.39). While this value has been put up against inferior competition, the numbers are adjusted to account for opponent quality. Look, we’ve seen what Jackson and McDowell can do, and even against lesser opponents they are still limited in their offensive games. Ngala has skill. His size will limit his role, true, but if his role is KU’s 8th/9th man, one assumes the team would get more from him than they would others in back-up roles on the perimeter.

The TEAM has produced a +5.61/+8.23 value score, putting them above-bubble but on pace for a middling seed. KU is actually above-bubble without Peterson because he has only played in 2 games, but if we look at the rest of the team for guys who’ve played 10%+ minutes, we’re looking at a +1.00 PPGAB team. While trading out Jackson’s minutes for Ngala’s would likely help some, there’s no way that Gee continues to play like an all-American with more exposure (and Jackson will likely regress up some anyway). Still, without Peterson Kansas is not a solid NCAA Tournament team (I’d give them a 60% chance). They need Darryn back.

  1. Seriously, how do cramps go to hamstring injury? The information we get from Self in these instances is always a bit off. Simply stating something clearly and with authority would help out most of the time. ↩︎

2016 High School Football Ratings

Power Ratings for 2016. To compare teams, subtract one team’s rating from the other. This will provide an estimated skill difference in points per game.

RankTeamClassRecordRating
1Bishop Miege4A-I12-168.24
2Shawnee Mission East6A10-262.57
3Blue Valley6A12-161.41
4Derby6A13-059.67
5Lawrence Free State6A9-351.59
6Goddard5A11-247.41
7Blue Valley North6A7-445.35
8St. Thomas Aquinas5A8-445.30
9Manhattan6A9-145.27
10Lawrence6A6-443.64
11Mill Valley5A9-439.12
12Hoisington3A12-138.53
13Wichita Heights5A9-237.53
14Hutchinson6A9-237.04
15Holcomb4A-II10-236.45
16Junction City6A8-236.12
17Bishop Carroll5A7-336.04
18Basehor-Linwood4A-I11-135.58
19Washburn Rural6A7-434.90
20Andale4A-I8-233.95
21Pratt4A-II12-133.56
22Maize South4A-I10-233.31
23Olathe South6A4-632.90
24Garden City6A9-132.89
25Buhler4A-I11-232.86
26McPherson4A-I8-332.68
27Wichita Northwest6A6-432.08
28Topeka6A5-432.00
29Scott Community4A-II7-331.94
30Phillipsburg3A11-130.63
31Mulvane4A-I8-330.31
32Gardner Edgerton6A4-630.21
33Shawnee Mission West6A6-430.18
34Great Bend5A10-229.72
35Hesston3A10-429.19
36Wichita Collegiate4A-II7-429.15
37Olathe Northwest6A3-628.73
38Halstead3A9-228.33
39De Soto4A-I7-328.04
40Pittsburg5A5-427.87
41Blue Valley Northwest6A2-727.85
42Louisburg4A-I8-327.39
43Shawnee Mission North6A6-527.28
44St. James Academy5A6-526.63
45Olathe East6A3-626.29
46Dodge City6A5-426.22
47Blue Valley Southwest5A2-826.10
48Plainville2A-1A11-225.10
49Valley Center5A9-225.09
50Ottawa4A-I8-324.44
51Silver Lake3A10-123.62
52Olathe North6A3-623.52
53Rossville3A13-123.47
54Wichita South6A4-522.90
55Nemaha Central3A12-122.57
56Topeka Seaman5A8-321.66
57Smith Center2A-1A9-320.33
58Spring Hill4A-I5-419.89
59Blue Valley West6A2-719.19
60Sabetha3A9-218.59
61Marysville3A7-317.07
62Nickerson4A-II6-417.07
63Andover5A6-416.38
64Augusta4A-I6-416.27
65Shawnee Heights5A3-616.11
66Norton3A7-415.85
67Garden Plain3A10-215.44
68Chaparral3A9-215.42
69Maize5A7-315.03
70Shawnee Mission Northwest6A1-814.30
71Riley County3A5-514.14
72Abilene4A-I7-313.89
73Frontenac4A-II10-113.09
74Kapaun Mt. Carmel5A2-712.97
75Topeka Hayden4A-II8-512.91
76Troy2A-1A13-012.79
77Southeast of Saline3A7-312.34
78Bonner Springs5A4-611.09
79Clay Center4A-II5-510.93
80Hugoton4A-II5-410.92
81Wichita West6A3-610.61
82Paola4A-I4-510.16
83Kansas City Piper4A-I6-49.81
84Campus6A3-69.51
85Holton4A-II7-59.14
86Goddard Eisenhower5A3-68.67
87Colby4A-II5-58.66
88Atchison4A-I6-38.28
89Conway Springs3A7-27.85
90Meade2A-1A8-27.55
91Salina South5A1-87.19
92Smoky Valley4A-II8-37.07
93Hays4A-I2-76.74
94Tonganoxie4A-I5-45.59
95Leavenworth5A1-85.54
96Clearwater4A-II3-65.49
97Washington County2A-1A8-35.40
98Marion3A7-25.28
99Larned3A3-84.82
100Independence4A-I8-24.78
101Eudora4A-I2-73.93
102Ulysses4A-I4-63.38
103Beloit3A6-32.86
104Arkansas City5A3-62.68
105Liberal5A4-52.65
106Ellsworth3A5-42.64
107Wamego4A-I4-52.61
108Newton5A1-82.32
109Emporia5A4-61.90
110Cimarron3A7-31.87
111Rose Hill4A-I3-61.82
112Kansas City Schlagle5A8-2-0.43
113Perry-Lecompton3A4-6-0.78
114Shawnee Mission South6A0-9-0.96
115Wellsville3A10-2-1.13
116Lansing5A4-5-1.43
117Wichita Trinity Academy4A-II3-6-1.48
118Cheney3A5-4-1.53
119Fort Scott4A-I3-6-1.78
120Santa Fe Trail4A-II7-2-1.87
121Andover Central4A-I2-7-2.06
122Wabaunsee2A-1A4-5-2.25
123Kingman4A-II3-6-2.31
124Columbus4A-II8-2-2.45
125El Dorado4A-I3-6-2.59
126Labette County4A-I5-5-3.22
127Sterling3A6-4-3.27
128Galena3A8-3-3.59
129Salina Central5A0-9-4.51
130Rock Creek4A-II2-7-4.62
131Valley Heights2A-1A7-3-4.77
132Wichita East6A2-7-4.96
133Hillsboro3A3-6-5.14
134La Crosse2A-1A5-6-5.52
135Jackson Heights2A-1A6-3-5.52
136Baldwin4A-II3-7-6.34
137Goodland4A-II3-6-6.85
138Jefferson County North2A-1A8-2-7.18
139Topeka Highland Park5A0-9-7.77
140St. Mary’s-Colgan2A-1A8-4-7.81
141Republic County2A-1A5-6-7.94
142Lakin3A5-5-9.37
143Circle4A-I1-8-9.89
144Concordia4A-II1-8-9.96
145Sedgwick2A-1A7-3-10.56
146Wichita Southeast6A1-8-10.93
147Winfield4A-I1-8-11.40
148Centralia2A-1A1-8-11.56
149Hutchinson Trinity3A5-4-11.82
150Lyndon2A-1A9-2-12.37
151Mission Valley3A6-4-12.38
152Wichita Independent3A3-7-12.40
153Wellington4A-I0-9-13.22
154Girard4A-II5-6-13.37
155Field Kindley4A-I4-5-15.00
156Chanute4A-I3-6-16.43
157Topeka West5A1-8-16.49
158Salina Sacred Heart2A-1A3-6-16.69
159Caney Valley3A9-3-16.72
160Kansas City Turner5A5-5-17.63
161Burlington4A-II5-4-18.20
162Thomas More Prep-Marian3A2-7-18.30
163Elkhart2A-1A6-4-18.33
164St. Marys3A4-5-18.43
165Haven3A1-8-19.22
166Ell-Saline2A-1A3-6-19.69
167Ellis2A-1A4-5-19.72
168Maur Hill Prep3A7-3-20.54
169Olpe2A-1A5-5-21.03
170Iola4A-II4-6-21.25
171Chase County2A-1A6-3-22.15
172Council Grove3A6-3-22.18
173Russell3A2-7-22.44
174Hiawatha3A4-5-23.07
175Royal Valley3A3-6-23.40
176Fredonia3A7-3-25.14
177Osawatomie4A-II2-8-25.17
178Jayhawk Linn3A9-1-25.20
179Oakley2A-1A1-8-26.16
180Moundridge2A-1A3-7-26.73
181Kansas City Washington5A3-6-26.76
182Baxter Springs4A-II5-4-27.54
183Prairie View4A-II2-7-28.00
184Osage City3A5-6-28.16
185Riverside3A3-6-28.28
186Wichita North6A0-9-28.73
187Kansas City Wyandotte6A2-6-28.93
188Chapman4A-II1-8-30.71
189Douglass3A3-7-30.93
190Parsons4A-II1-8-30.98
191Jefferson West4A-II1-8-31.68
192Pleasant Ridge3A3-7-32.09
193McLouth2A-1A4-5-32.73
194Doniphan West2A-1A2-7-33.43
195Inman2A-1A3-6-34.39
196Kansas City Harmon5A0-8-34.40
197Minneapolis3A1-8-35.39
198Neodesha3A5-4-35.50
199Anderson County4A-II2-7-36.43
200Lyons3A0-9-36.45
201Oskaloosa3A4-5-36.70
202Belle Plaine3A2-7-38.78
203Kansas City Sumner5A2-6-39.05
204Remington2A-1A2-7-39.11
205Cherryvale3A5-4-39.22
206Medicine Lodge2A-1A0-9-39.36
207Southwestern Heights3A2-7-40.21
208Syracuse3A3-6-41.26
209Humboldt3A4-6-44.84
210Horton2A-1A1-8-46.46
211Riverton3A2-8-46.60
212West Franklin3A2-7-46.64
213Northern Heights2A-1A2-7-49.03
214Erie3A2-7-54.62
215Stanton County2A-1A2-7-57.64
216Oswego2A-1A3-7-57.98
217Bishop Ward4A-II0-9-58.18
218Atchison County3A0-9-58.40
219Central Heights3A1-8-59.96
220Bluestem3A2-7-61.17
221Maranatha Academy3A2-7-62.75
222Yates Center2A-1A2-7-63.35
223Uniontown2A-1A2-7-64.10
224Southeast3A0-9-74.35
225Sublette2A-1A0-9-81.52
226Eureka3A0-9-83.59
227Northeast3A0-9-92.18
ClassAverage RatingState ChampionRunner-Up
6A25.93DerbyBlue Valley
5A9.89Mill ValleyGoddard
4A-I11.82Bishop MiegeBuhler
4A-II-4.09PrattTopeka Hayden
3A-16.77RossvilleHesston
2A-1A-22.11TroyPlainville

2026 Kansas Jayhawks

The 2026 Kansas Jayhawks were 24-11 and earned a 4-seed in the NCAA Tournament. They advanced to the Round of 32 before losing. The team’s College Basketball Reference page is here.

Traditional Stats

Value Offense

Value Defense

Combined Value PPGAB

Value 4-Way

Where We are Now

Kansas’ season is done after the Jayhawks fell to St. John’s on a buzzer beater in the R32. A final recap of the season will be posted following the National Championship game.

Over the last 10 games, here are the PPGAB marks for main 7 in the rotation:

  • Peterson +5.99
  • Council +0.48
  • White +1.14
  • Bidunga +1.17
  • Tiller -3.29
  • Jackson +0.65
  • McDowell -1.15

The decline of the starters (aside from Peterson) is really the story here. Darryn wasn’t the problem down the stretch; he was an excellent scorer and a plus defender. But when he came back full time, the others couldn’t find a way to be complementary pieces. Another positive piece, relatively speaking, was Elmarko Jackson. This is ironic given the way in which the season ended, but he showed improvement on all facets of the game.

Season Write-Ups

2026 Player Projections (10/23/2025)

Through 5 Games – Peterson is Currently Out (11/19/2025)

KU Through Christmas Break Recap (12/23/2025)

Melvin Council and Past KU Guards (1/9/2026)

Looking Ahead to the Rest of the Season (1/9/2026)

Elmarko Jackson, Darryn Peterson, and Value (2/19/2026)

The Importance of Quality Depth (3/4/2026)

Beware of the Phog Update (3/9/2026)

Tournament Preview – KU’s Path (3/17/2026)