NCAA Tournament Selection – 2026 Case Study

Miami (OH) is in the midst of a magical season. The RedHawks are currently (3/5/2026) 30-0 and poised to return to the NCAA Tournament for the first time since 2007. Miami (OH) had 15 consecutive seasons with a losing record before a solid 25-9 campaign last year, but they’ve leveled up even more in Coach Travis Steele’s fourth season.

With a record as good as Miami (OH)’s is, one would normally think them to be a shoe-in to the NCAA Tournament, but things aren’t this straightforward. Let’s first consider their chances at getting the automatic bid. Although undefeated, the Red Hawks aren’t a super strong team according to the metrics. They are 88th right now in KenPom, 53rd in NET, and 83rd in Torvik. They aren’t the strongest team in the MAC, either. Akron sits at 63rd in KenPom (69th in Torvik) and would be favored in a neutral-site matchup. In fact, Torvik has Akron as the MAC tournament favorites, with Miami (OH) projected to win their conference tourney only 30.6% of the time. There are more than a few teams that Miami (OH) can reasonably lose to in the MAC.

Ok, so what? Even if Miami (OH) loses in the conference tournament, they will still have a great record (30-something and 1) and will get an at-large bid. Right?

This is where things get interesting. Recently former coach Bruce Pearl said that Miami (OH) shouldn’t get an at-large spot in this scenario, causing a ruckus in which the administration and coach at Miami (OH) responded with indignity.

Here’s the interesting thing, however. Both sides have a good point. What Miami (OH) has done is truly impressive, yet at the same time theirs good reason to doubt they could’ve qualified for an at-large spot had they been in a power conference and played a tougher schedule. What we want to do is to examine the RedHawks’ tournament resume as the committee will and explain more about this process.

It is our conjecture that the NCAA Tournament committee has a challenging job and is overly criticized. Yes, sometimes they get it wrong. But consider what they are tasked with. They are asked to rank a number of different basketball teams playing in different conferences and oftentimes wildly different schedules. It is tough enough to try and compare the 6th-best team in the Big 12 with the 6th-best team in the Big 10, now try comparing a top team from the MAC to average teams in the SEC or how MWC teams stack up against A10 teams.

In order to guide the committee, the room has team sheets which show a team’s numbers and its wins and losses based on things which can be compared, that is quadrants. If Team A is 5-4 in Q1 games and Team B is 3-6 in Q1 games, the committee can easily judge that, in terms of Q1 record alone, Team A is preferrable. Now it may be that Team B has done better at avoiding bad losses, has a better overall strength and schedule and computer ratings, etc. that wind up seeding Team B better than Team A, but this process helps the committee make some sense of the numbers. Here are a list of important things the committee considers:

  • Wins and overall record against quadrants
  • Computer efficiency metrics (i.e. KenPom, NET)
  • Resume metrics (i.e. WAB)
  • Strength of Schedule

Let’s bring in Bracket Matrix to get a consensus look at where things stand today. The consensus thinks Miami (OH) is in the tournament (they are given the MAC auto-bid at this point by many systems), albeit as an 11-seed. Should Miami (OH) lose to Akron in the MAC finals, how much this would change their status remains to be seen, but they’d likely be a quintessential bubble team.

To see why this is, put yourself in the committee’s shoes. Instead of romanticizing the dream season of the mid-major, look at things objectively. In this scenario, Miami (OH) would be 33-1. Sure, this is impressive. But they also currently have the 344th best SOS according to Warren Nolan. Digging into their resume a bit more, you’d see these marks by quadrant:

TeamQ1-A RecordQ1 RecordQ2 RecordQ3 RecordQ4 Record
Miami (OH)0-00-01-010-016-0

The first thing we’d notice is the goose egg in terms of all Q1 games, followed by the sole Q2 win. Miami (OH) has gone 3-0 in non-D1 games, which don’t really count at all, meaning their overall 30-0 record is really 27-0…still impressive but you get what’s happening. This initial strong element of the resume has started getting chipped away.

Looking at a few computer metrics, here is how Miami (OH) looks

  • 53 in NET
  • 88 in KenPom
  • 30 in WAB

The efficiency metrics aren’t great, but helpful to Miami (OH) is the WAB number. This metric shows the RedHawks as having the caliber of resume of a typical 8 seed.

Let’s compare this to a similarly-placed team in Bracket Matrix, TCU. The Horned Frogs’ team sheet looks something like this:

TeamQ1-A RecordQ1 RecordQ2 RecordQ3 RecordQ4 Record
TCU3-55-75-13-17-1
  • 42 in NET
  • 45 in KenPom
  • 36 in WAB

Looking at these two resumes, which one looks more impressive? This what Miami (OH) is up against. Yes, the 30-0 (or 33-1 potentially) looks great, but once you look at what is presented on the team sheets, it stacks up poorly against teams that have a number of quality wins.

Having said that, TCU going 10-2 in Q3/Q4 should be pulling the Horned Frogs down, and it is. TCU is currently projected to be the lowest 10-seed, i.e. just barely avoiding the First Four play-in. But it is better to have a few “hiccup” games against Q3/Q4 opponents if you win enough Q1 games than it is to go unbeaten against Q3/Q4 teams while not playing (or winning) many Q1/Q2 games.

Another factor helping TCU here is SOS, which sits at 46. This is the same thing for other non-Miami (OH) bubble teams. Ohio State has the 23rd-ranked SOS. Santa Clara’s is 87th. VCU’s is 101st. New Mexico’s is 93rd. Even the other mid-majors on the bubble have way-better SOS than Miami (OH).

What’s really holding Miami (OH) in the at-large picture at all is its WAB and the fact it has avoided bad losses (nearly every game it played, would it have lost, would be a “bad loss”).

Pearl’s Comments and the response

Bruce Pearl’s comments were not taken well, with Miami (OH)’s administration mentioning that Pearl is saying as such to promote Auburn, where his son is the head coach. Auburn was on the bubble but has lost 7 of its last 9 to fall to 16-14 on the year. The Tigers still have an outside shot of making the Big Dance if they can rack up a few wins in the SEC Tournament, but despite having the 3rd-best overall SOS, they’ve lost too many games at the moment to be in the field.

But let’s consider his point. He’s saying that Miami (OH) has benefitted from an incredibly easy schedule, and that were they to play in a power conference, they’d likely be out of the tournament. To explore this, we compared the team with the closest WAB to Miami (OH), Georgia (29), who is conveniently another SEC team.

Georgia’s gone 21-9 this year, but has won 7 Q1 games while only losing 1 Q3 game (and 0 Q4 losses). They’ve racked up impressive wins against Alabama, Cincinnati, Arkansas, Missouri, and Kentucky. We can’t say that Miami (OH) has done this. Maybe they could have, but we can’t say they did. That’s why Georgia’s WAB ranking feels truly “earned” and the committee will likely have them in the 7-8 seed range.

To Miami (OH)’s point, sure the MAC is easier than the SEC, but they’re undefeated, something that many bubble teams can’t say when looking at just Q3/Q4 results. New Mexico has two Q3 losses. TCU lost to lowly New Orleans at home (Q4) earlier in the year. Santa Clara has a Q4 loss as well. Some of the other teams on the bubble (Ohio St., Indiana, VCU) have taken care of games against Q3/Q4 opponents but have paltry records in Q1/Q2. What’s really the difference between going 1-8 in Q1 games versus going 0-0?

What people tend to ignore is that the committee functions in a certain way, namely they function by being able to compare each team against those around it. After a rough draft seed list is created, they go through the “scrubbing” process which is effectively taking two similar teams and using a fine-tooth comb to separate their resumes. The better team moves up a spot and is compared to the team above it. The worse team moves down and is compared to the team below it. Do this for a few iterations, and you’ve made a consensus decision on how the S-curve should be 1-68.

Because of this process, what the committee wants to see is that teams are easier to compare. It is easier to compare teams with similar(ish) Q1 contests, SOS marks, etc. than it is to compare a Miami (OH) and a TCU. The committee is trying to weight wins and losses, and this gets tougher to do when a team’s opponents played are skewed to the low-end of the quadrant scale.

To combat this, the NCAA has consistently signaled the importance of strength of schedule. Teams with poor SOS marks get dinged, and not just on the bubble. Iowa State fell a few spots on the S-curve (and missed a chance at a 1-seed) a couple years back because of its poor non-con SOS. They don’t want to be told they have to parse one team’s results against competitive teams against that of another’s games against non-competitive ones.

WAB, Hypothetic Results, and Scheduling

Running concurrent to this is the recent inclusion of Wins Above Bubble (WAB), which allows a team to play a weak schedule yet still build a resume as long as they have a very good record (i.e. undefeated or 1 loss). This is what Miami (OH) has done in 2026.

The metric is saying that Miami (OH)’s 30-0 record is equally as impressive as Georgia’s 21-9 record against a far harder schedule. What Bruce Pearl is saying is that Miami (OH) would still struggle to achieve something the likes of which Georgia has done against Georgia’s schedule. And what we’re saying is that both are right.

Had Miami (OH) played Georgia’s schedule, a computer metric like KenPom would project the RedHawks to have a 15-15 record. Even if we gave hypothetical Miami (OH) a few more wins playing that schedule, 17-13 isn’t likely getting a team in (that’s about 62nd in WAB).

The better response for Miami (OH) than to insult Pearl would be to point out that most teams couldn’t finish 30-0 against the RedHawks’ schedule. If Georgia had played the schedule Miami (OH) did, computers would project them to be at 28-2 or 29-1…only 21% of the time would we think they could run the table. Yes, they’d be favored in every game. But eventually someone would trip them up, they’d have an off-night, etc. With five total games on the schedule in which they’d be favored to win less than 90% of the time, it isn’t unlikely they’d drop one along the way.

Now the committee doesn’t really consider hypothetical results as such, that’s what WAB is attempting to control, but it does show how the argument becomes circular.

The other element within this is scheduling. A harder schedule for Miami (OH) would have allowed us to see how they would have done against opponents closer to the quality of Georgia’s (or TCU’s or Ohio State’s). Now Miami (OH) couldn’t schedule better within its conference. The MAC is the 17th-best conference per KenPom, truly a mid-major league. The MAC schedule has provided Miami (OH) with a number of Q3/Q4 games and its only Q2 contest (Akron). I believe the committee would be sympathetic to the RedHawks if them being in a weaker league was the only reason for their poor SOS numbers. Where Miami (OH) has been hurt, however, is in the weakness of its non-conference schedule.

The RedHawks have the 364th ranked non-con SOS, having played three non-D1 teams as well as a slew of other low-majors. Playing 8 teams outside of the top 300 in KenPom in your non-con while also playing a mediocre conference slate is a recipe for a disastrous SOS metric. For most teams at the non-power conference level, this matters not since they aren’t trying to get an at-large bid. But for Miami (OH), it might become a nightmare.

Miami (OH)’s coach tried to justify this. As ESPN reported:

Coach Travis Steele recently told ESPN that high-major squads have refused to schedule the RedHawks due to the potential for an upset.

This has become the typical sentiment from mid-major coaches and supporters of these teams. But it isn’t based on much evidence. Looking at the rest of the MAC and using KenPom numbers, Miami (OH) had the worst non-con schedule by far. Its average non-con opponent (excluding non-D1 teams) had a rating of -9.91. The average non-con opponent of all the other MAC teams was -1.97. This is a difference of about 5.6 points per game easier for Miami (OH) than others in their league faced.

Obviously they could have scheduled harder. But even the claim that high-major teams refused to schedule Miami (OH) is far-fetched. Fellow MAC school Eastern Michigan faced four power conference foes in the non-con. The Eagles played at Pitt, Louisville, Cincy, and Butler. These were all Q1/Q2 games. Other teams in the MAC were also able to schedule power conference opponents.

The more obvious solution here is that Miami (OH) didn’t expect to be 30-0 on March 5, and they just weren’t concerned with building an at-large resume when they scheduled last off-season. They were hoping to play well during the regular season to get a good seed in the conference tournament and hopefully get a bid through automatic qualification. Which is fine, a majority of the conferences are one-bid leagues. But don’t pretend your abysmal SOS is the fault of other programs.

Projecting Miami (OH) in the Field

Wrapping this up, what do we think about Miami (OH)’s chances? We’ve been all over the map in this analysis, but this is kind of everything the committee will be considering (well, besides the hypothetical scenarios). Obviously Miami (OH) can take care of things by winning its conference tournament. But what if they don’t?

Let’s say Miami (OH) wins its final regular season game (at home against Ohio). This is actually a key game, as it will allow the RedHawks to have 1 loss at most following the conference tournament. I don’t think Miami (OH) gets in if they lose the regular season finale and in the MAC tournament.

If they finish the regular season 31-0 and lose in the conference tournament, preferably in the championship game to Akron (Q2 opponent), this is where things get interesting. Their WAB would drop a bit (likely to around 38-40), which by itself would get them in the field but not by much. Combined with weak efficiency metrics, no Q1 wins or even games played, and of course that SOS, it is going to be close.

Either way, if Miami (OH) finishes at these records here are the chances I give them:

  • (34-0) – 100%. 10-seed estimate.
  • (33-1) – 60%. 11-seed First Four.
  • (32-1) – 30%. Out but if in 11-seed.
  • (31-1) – 25%. Out but if in 11-seed.
  • (32-2) – 0%. A 2-loss team with that bad SOS won’t get in.

Bid thieves in leagues like the A10, MWC, and WCC (as well as any power league) are also lurking which would change this calculus. At the moment, Torvik projects Miami (OH) in the field 67% of the time, with them earning an at-large bid 49.6% of the time, a true coin flip.
The Importance of Quality Depth, a Case Study

The 2010 Kansas team, despite its untimely end, was the paradigm of a well-constructed roster. It had veteran leadership alongside young pro talent, a compliment of shooting to go along with interior play, stars who took over in the big moments to go along with role players who did the little things, and continuity that ensured everyone was on the same page.

Taking a look at its top 4 players, here are their value stats:

PlayerPPGABPer100 ABWAR/36
Marcus Morris+4.14+9.61+5.29
Cole Aldrich+4.02+8.62+5.27
Sherron Collins+3.48+6.05+5.03
Xavier Henry+2.39+4.99+3.70

The final value stat, WAR/36 just normalizes the season WAR to a 36-game schedule so we can compare across seasons.

All four of these players would go on to play at least some in the NBA. Marcus Morris was a very underrated player who continued to improve and was a very efficient Jayhawk even by his sophomore season.

Now let’s take a look at the 2026 roster’s top 4 players, through 30 games of the season.

PlayerPPGABPer100 ABWAR/36
Darryn Peterson+5.54+12.32+4.48
Melvin Council+4.03+7.15+5.89
Flory Bidunga+4.03+7.68+5.73
Tre White+2.39+4.46+4.05

What stands out is that, by all value metrics, the 2026 top four is as good or slightly better than the 2010 top four. Peterson’s WAR is a bit lower due to him being out of the lineup for 11 games, but other than that the stars of both teams are at worst comparable.

So why does it feel like the 2026 team is so much worse than 2010? Obviously this is due to the rest of the rosters. Let’s take a look at 2010’s role players to begin:

PlayerPPGABPer100 ABWAR/36
Markieff Morris+1.22+4.00+2.06
Tyrel Reed+0.78+2.89+1.53
Tyshawn Taylor+0.26+0.65+1.37
Elijah Johnson-0.03-0.27+0.18
Thomas Robinson-0.69-5.52-0.31
Brady Morningstar-1.30-3.48-0.20

In total, these role players in 2010 had the following value:

+23.22 Points Against Bubble (+0.65 per game)

+4.46 WAR

Contrast this with the 2026 role guys.

PlayerPPGABPer100 ABWAR/36
Kohl Rosario-0.31-1.54+0.25
Jayden Dawson-0.35-2.22+0.10
Elmarko Jackson-0.49-1.63+0.39
Jamari McDowell-1.51-4.87-0.63
Bryson Tiller-1.94-4.28-0.63

The cumulative totals for these five rotation players are:

-133.48 Points Against Bubble (-4.45 per game)

-0.52 WAR

This final table should contrast things nicely:

SeasonStars PAB/gmRole Guys PAB/gmTotal PPGAB1
2010+14.03+0.65+14.68
2026+13.96-4.459.51

Basically, 2026’s role players are spotting a typical opponent 4-and-a half points a game that the stars have to make up. Most nights they can, but some nights, when shots aren’t falling or things aren’t going well, this can result in an unexpected loss.

Back in 2010, KU could get some value from the likes of Tyshawn, or when it went to its bench was able to maintain a solid level of play thanks to the efforts of Markieff and Tyrel Reed. Even with the struggles of freshman T-Rob and Brady Morningstar, Kansas was an elite team.

  1. These totals won’t add up to each team’s season totals for PPGAB as these totals exclude coach technicals, walk-ons, and other non-rotation players (those playing fewer than 10% of possible minutes). ↩︎

Elmarko Jackson, Darryn Peterson, and Conceptualizing Player Value

Since our last write-up in the 2026 season, a lot has happened. KU now sits at 10-3 and in a tie for third place in the Big 12, only 1 game back of first, and is positioned as the 10th best team in Bracket Matrix (corresponding to a 3-seed in the NCAA Tournament). KU is far closer to the optimistic outlook we presented about 6 weeks ago, though things haven’t turned out exactly like we imagined.

Let’s start with Elmarko Jackson, a player Kansas fans have been overlooking due to the on-again, off-again status of Darryn Peterson (more below on him). In our Christmas Break Recap earlier in the season, we had this to say about Elmarko:

While everyone has bad games, Jackson needs to find a way to make his bad games not outright terrible ones. Either way, Self is likely playing him too many minutes.

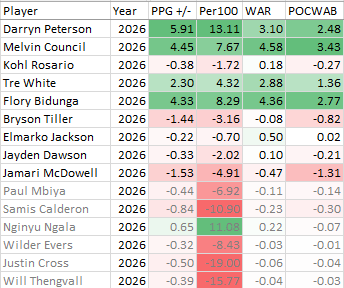
At that point Jackson had not been playing well, matching his disappointing freshman season, but ever since the third game of conference play he’s really turned things around. In fact when you look at the numbers, its kind of shocking. In these 10 most-recent games he’s played in (he missed the Utah game due to injury), Elmarko is putting up +2.96 PPGAB/+8.95 Per100, doing this both on offense and defense. For the season he’s now a -0.22 PPGAB/-0.70 Per100 player, solidifying KU’s bench.

Jackson had his best game of his career against Oklahoma State last night, going for 14 points, 4 assists, and 3 rebounds on efficient shooting numbers; but also defending well. This earned Jackson a team-MVP in our system and career-first +10 outing. While defense tends to fluctuate some game-to-game based on matchups and what the opponent does, Elmarko’s season-long defensive value is in the green (+1.41 Per100) indicating he has become a reliable defender.

Now onto Darryn Peterson. Peterson looked absolutely unstoppable out the gates against the Cowboys, scoring 13 points before the first TV timeout, and he coasted to a 23-point, 18-minute performance before sitting the bulk of the second half. Peterson checking himself out for cramps was met with much hostility by the fans, and their frustration is understandable if not a bit overblown.

In Peterson’s defense, he added an estimated 8.63 points over a hypothetical bubble-level player last night. On a per possession basis this is even more impressive given he only played 18 minutes (+26.71 Per100!), but the main point here is that if you can only get some of Darryn, you take it. Kansas building a big first half lead thanks in large part to his shooting and defensive attention allowed the team to play less-than-inspired ball the second half and still win comfortably. This has happened more than once this season–that Peterson doesn’t finish a game but KU not really need him to because he helped them grow a lead during the first half. Fans would be better to appreciate this aspect.

Still, the unpredictability of the situation isn’t ideal. Peterson checking himself out and casually sitting there or riding an exercise bike (while not returning) reeks of self-interest (i.e. show the scouts his obviously superior talent while not risking further injury) that can hurt the team long term. Will he be able to go a full game if/when the team needs him in the NCAA Tournament? If he doesn’t do so in the regular season (or does so sparingly), what confidence is there he can do so when the games really matter?

Let’s put aside a few talking points that have been debunked. Many fans were speculating that Peterson was “done” back in November/December. They were clearly wrong. Darryn has played in 11 of 13 conference games and finished one with a sore ankle (Colorado). He also effectively won the Texas Tech game down the stretch with two late 3’s. He has clearly added value to this team during the season. His POCWAB is also +2.48, a solid mark (third on the team) that can also isolate player value by weighting quality opponents and utilizing total performance.

Finally, let’s explore some conceptual elements of player value. Conceptually, when Peterson plays, he makes the team better by scoring efficiently (you need points to win), forcing opponents to concentrate on guarding him (which should help his teammates get better shots), and eating minutes (meaning KU’s other starters can rest while the bench doesn’t need to play as much). That’s why fans should recognize the difference between playing 20 minutes vs. 0. Peterson has played 57% of available minutes in conference play. While it would be better at 75-80%, this is far better than him sitting.

But concept is different from result. In games Darryn has played, KU is a +9.23 team, while in games he’s missed they’re a +10.99 team. Some of this may be due to KU loading up against non-power conference teams during the portion of the season Peterson was injured (and outperforming the adjustment factor against these weaker foes), but if we isolate only the games against top 100 KenPom teams, KU is a +8.41 team with and a +10.52 without. They’ve played well with him; they’ve played well without him. They’ve had down games with him and down games without him. This isn’t to say that KU would be as good or better without him for a full season or that KU’s ceiling isn’t higher with him, but that sometimes numbers show funny things.

According to Hoop Explorer, KU is only slightly better with Peterson on the floor than they are with him off it (about 1.5 points per 100). This puts him behind Council, Bidunga, Tiller, and McDowell. While On/Off data can fluctuate, more data is needed (likely 100 games worth), and the function of who replaces you matters (that’s one reason why Flory’s On/Off is so positive, KU is better with 2 bigs and doesn’t have a good one behind him); Peterson’s impact should be higher than it is.

KU’s offense has been better in DP games (+4.38 vs. +2.07) but its defense has been far inferior (+4.85 vs. +8.92). With defense being a bit less predictable maybe randomness is at play, but at the same time KU really locks in defensively without DP. And while Peterson has good defensive skills, he doesn’t always have the motor to play 100% and will give up occasional open looks or transition opportunities. On the season he is right at bubble-level defensively (+0.08 PPGAB/+0.18 Per100), which when paired with his elite offensive game isn’t necessarily bad.

Player Value Thru 26 Games in 2026

For posterity, here was how things stood on 2/19/2026. KU has 5 regular season games remaining and at least 1 Big 12 Tournament and 1 NCAA Tournament game to play.

Looking Ahead to the Rest of the Season

Erasing a 15-point comeback in under 5 minutes, Kansas’ win against TCU to move to 11-4 (1-1) was significant in a lot of ways. It prevented KU from going 0-2 in conference play for the first time since 1991. It added a win that will help its overall resume come March (certainly a loss would have hurt). It was only the 13th time a team erased as large of a deficit with as little time as it did (15 points or more in 5 minutes or less). These factors are all important from a historical or resume perspective, but one area we cannot determine yet is the area of momentum.

Momentum here refers to the team’s momentum and how the rest of the season will play out. With KU being without its star player for much of the year, and now getting him back (for the most part), now the other Jayhawks are trying to learn how to play with Darryn Peterson while still making winning plays. Certainly Peterson has been good in his return(s) to the court. But not everyone has been as good.

Looking at game scores, KU has been a +8.78 team in the games Peterson has missed and a +8.29 team in the games he’s played. If we ignore the non-power opponents (we’ll explain why more later), then the split gets a bit worse with Peterson, +4.96 with and +6.72 without.

The offense has been noticeably better with Peterson (+5.57 with, +0.54 without), meaning that the defense has been that much worse with him (+2.71 with, +8.24 without). And while it might be tempting to blame Peterson for this, he’s actually graded out as an adequate defender both using the charting method and the eye test.

How good will KU be the rest of the way? That depends of course, but we wanted to break down this team’s chances from a pessimistic and optimistic outlook.

Pessimistic Outlook

Let’s start at the pessimistic level of things. Even though it was nice for KU to avoid losing to TCU, under this view there’d be no reason to think it will lead to clear skies moving forward. After all, the last two teams have put up 81 and 100 points (in game paces where they were expected to score 78.5 and 88.4 against a bubble team’s defense). With more game film and rotations being set, teams in conference are scouting KU’s propensity to switch and purposefully taking advantage of mismatches. Can KU make an adjustment? If it does change its defense to play more straight up, does this hurt it in other areas (such as 3-point defense, which has been solid)?

More specifically to position, KU’s interior has looked shaky. Now we shouldn’t conflate Flory Bidunga (mostly solid, +3.39 per game) with Bryson Tiller (routinely overmatched, -3.32 per game), but the fact is that KU is only comfortable with these two bigs, and this is likely another reason why KU’s front court overall has struggled (-0.78 per game). Tiller has played far more than he should, in turn Flory is asked to do more than he needs to, and on top of this foul trouble biting you is always a lingering concern. Mbiya and Calderon haven’t been reliable pieces. The last pessimistic angle we’ll look at is the splits between mid/low-major teams and the power opponents. In 15 games, KU has played 5 “bye” games, that is the games against the sub-100, non-power conference teams, and dominated them to the tune of an average margin of 29.2 points. And while dominating bad teams is a sign that your team should be good (and helps the metrics sites predict a team’s overall strength), it would be a mistake to assume there is a pure linear relationship between all 365 teams.1

Contrast this performance to the 10 games KU has played against power conference opponents. Going 6-4 in these games, KU has outscored these opponents by only 1.5 points per game. We mentioned the Kansas front court earlier, and in the case of Flory Bidunga, these splits show themselves as well. After adjusting for opponent strength and location, Bidunga’s value against bye teams (+5.71) is noticeably better than his value against better opponents (+2.24). If KU’s only real presence inside sees his value wane when playing good teams, how will that help in remaining conference and tournament games?

Look, the comeback win and getting Darryn Peterson doesn’t change the fact the team has shown itself to have real flaws.

Optimistic Outlook

Now we’ll turn to the happier view of things. KU sits at 11-4 and a WAB of +2.3, indicating a 4-seed or potentially a 5-seed as things sit now. All this without Darryn Peterson for games such as Duke, Tennessee, UConn, and Notre Dame. KU has shown it can win games without him (i.e. Tennessee) as well as put everything together with him (i.e. Missouri). With more games and more reps, guys will naturally find their roles and KU’s talent will begin to win out.

Let’s look at offense/defense splits. Far from being a concern, it is actually a reason for optimism. KU’s offense is functioning as a top 20 (if not better) group with Peterson, not around 50 as they’ve been for the whole season. And while the defense has gone down recently, the video shows this isn’t due to Peterson as much as it is due to scouting KU’s propensity to switch. Once Self makes defensive adjustments, and he has the pieces for this team to be a good defense (Council, Bidunga, Rosario, even Peterson), this team’s defense should be very competitive.

Another positive factor is that KU’s depth has gotten better. Peterson getting 30 minutes or more a game would mean that others (White, Council) are asked to do less. It also means KU doesn’t have to play a guard or wing who isn’t ready to get major minutes. Jackson or McDowell or Rosario or Dawson or whoever should be able to get comfortable by coming in for a few minutes and playing hard on defense. In particular, Rosario has shown some ability to do this, and Jackson had a number of key steals late against TCU. Peterson’s elite offensive skill allows for more specialization elsewhere.

Winning breeds winning. This team expects it’s going to win moving forward after taking TCU’s best shot and responding. It showed grit and never stopped fighting. Energy, a very tough thing to quantify yet nevertheless a very important part of the game, is something players and teams have to learn to play at. KU showed tremendous energy late against TCU to steal the win, and there is good reason to think they can repeat this.

The Louisville game is another data point which adds some optimism. No, the game didn’t count. But it was a competitive contest in which a good team playing on its home court attempted to win but was outmatched by Darryn Peterson, etc. This shows us that KU has the talent and team to beat other good teams (this was an estimated game score of +19, which is a good enough performance to win any other game on the team’s schedule).

The final sign of optimism is the obvious fact that good players do not make teams worse but in fact better. In short, KU has Darryn Peterson so chin up. Sure, KU hasn’t been better with Peterson yet. But why think that will continue? KU was better with its best player on the floor in 2025 (Hunter Dickinson), 2024 (Kevin McCullar), 2023 (Jalen Wilson), 2022 (Ochai Agbaji), etc. even if there were times in the season where the team struggled despite having its best piece. After 10 more competitive conference games with Peterson in the line-up, this reality has to show itself in the numbers.

Peterson is looking healthier and healthier. He’s playing more minutes each game he returns, even if his legs are tiring out late in games. He’s played KU’s last 4 competitive, non-bye games (with KU going 3-1). Despite people over-reading into the situation, he truly wants to play and he truly makes the team better.

  1. A mistake we admittedly make in our opponent adjustments to calculate PAB/WAR. But we need a simple way to adjust to opponent and believe that because “bye” games serve only a small portion of the schedule, it won’t matter by season’s end. ↩︎

Melvin Council and Past KU Guards

With the on-again, off-again availability of star Darryn Peterson creating uncertainty on the 2026 season, no other player has stepped up more for the Jayhawks than senior transfer point guard Melvin Council. Council is the team leader in minutes played, assists, steals, field goal attempts, and is third in overall points scored.

Council has been a fan favorite since before the season began, describing his play on the floor as tenacious, like a “dog,” and then delivering on this. Council’s heroics in Las Vegas, helping lead Kansas to a 3-0 record and third place finish in the 18-team Player’s Era showcase (including a huge comeback win against Tennessee), was really the first time that people thought about this team as being something more than just Darryn Peterson + role players.

At this point of the season, Council was certainly beloved by the fans but he wasn’t without flaws. Some thought he took too many bad shots; others worried about his outside shooting. With only 5 made 3’s on the season (in 28 attempts), N.C. State made the decision to double-team Darryn Peterson and guard other Jayhawks more closely, allowing Melvin open looks. Instead of this getting to his head, Council wound up going 9-15 from downtown that night en route to an-all time 36-point performance, leading KU to a 1-point overtime victory. Melvin has continued his hot play of late, including an efficient 20-point outing at UCF (taking over when Peterson checked out with injury) and of course his 18-point, 8 assist night in the comeback overtime win against TCU (9 of his points were in the extra session). Over his last 11 games, he’s scored in double figures 10 times (with the other game being a 9-point game against Missouri). The point is, not only has Council been what fans hoped he would be, he’s actually performed better than expected of late.

What we want to examine is another angle of this story, namely the comparison between he and former Kansas point guard Tyshawn Taylor. Taylor was a four-year Jayhawk, playing in the 2009 through 2012 seasons. A few months ago, Taylor had Council on his podcast. The two share a resemblance not only physically, but also how they play the game. Both are fast players with the ball who love to get to the rim, both play the same position, and neither is thought of as a great outside shooter. Even before the season fans (and Bill Self) were comparing Council to Taylor. These comparisons haven’t waned after watching Melvin play as a Jayhawk.

So let’s analyze this. How similar is Council to Taylor? First, the fact they share the same position counts for something. If Council were older/Taylor were younger, KU could switch one for the other and not have to change anyone else’s role on the floor. Another area we could compare is durability. In Tyshawn’s senior season (2012), the former Kansas guard played in 83.2% of possible minutes. Council this season is right in line with that mark (82.8%).

However if we go to past seasons, we see that Taylor was not as key of a piece. In 2011, his junior season, he only played 64.1% of possible minutes. As an underclassman he played similar minutes, but in these seasons he also played off the ball more given that the team had Sherron Collins to run point. In addition, Taylor’s first three seasons produced a cumulative points against bubble of -19.77 (about -0.20 per game). As we will see below, Taylor’s senior season is far more in alignment with Council’s senior season, and as Council only played one season in Lawrence, we will only compare their senior seasons…Taylor’s 2012 against Council’s 2026.

Let’s compare some value scores, noting that Melvin has only played 15 games and Taylor had a full season (39 games).

  • Tyshawn Taylor (2012): +3.01 PPGAB, +5.37 Per100, +5.19 WAR
  • Melvin Council (2026): +4.57 PPGAB, +8.03 Per100, +2.66 WAR (translates to +6.92 WAR over 39 games)

From a purely value perspective, Melvin has been even better than Tyshawn was at his best, to the rate of about a point and a half per game. Now this doesn’t mean that Council will have a better season; he still has to finish out conference play and the tournaments. How successful KU is, and how well Council leads the team during their stretch run, will also be a factor. Fans warmly remember Tyshawn being the PG of a national runner-up team. It is unlikely that Melvin will have that much team success. Furthermore, should Melvin have a few mediocre or poor games, his value marks will trend back toward where Taylor’s were in 2012. Still, it is undeniable that KU got a good point guard ala 2012 Tyshawn Taylor, they likely got a better version of him with the portal addition of Melvin Council.1

The next look at this will be more detailed. Do they actually play the same. I will posit that, despite notable similarities (position, height, body shape, skin tone, face shape, speed with the ball, average shooting abilities), there a quite a few differences as well.

This is easier to see when we start breaking the player value down. In 2012, Tyshawn Taylor’s per game offense/defense breakdown was: +3.37/-0.36. He was an offense-heavy piece, taking 26.2% of the team’s shots (second on the team), did an excellent job of getting to the line (42.0 FT Rate), but also had a relatively high turnover rate (22.6).2 These numbers were also fairly consistent throughout his career. Sure, he was less important on offense before 2012, but he was always a better offensive piece than defender and he never became a good or even average defensive player.

Melvin, on the other hand, is a noticeably poorer shooter than Tyshawn was (Taylor was a career 37% 3-point shooter, believe it or not). Council’s TS% is currently 49.3% (in range with how he shot at St. Bonaventure and Wagner the prior two seasons), whereas Taylor’s TS% was 56.9% his senior year and never lower than 53.1% in a single season. Council doesn’t get to the line as often either (24.6 FT Rate).

But Melvin handles the ball better. We should be careful some, given that the game has allowed for more liberal ball-handling maneuvers (and thus turnover percentages are down across the board), but Council turns it over about half the rate Taylor did. Melvin is adding an estimated 4.48 points per 100 on his ball-handling abilities alone (i.e. limiting turnovers while adding assists). We haven’t calculated Taylor’s ball-handling value component yet (this takes time to set up for past seasons), but a reasonable estimate would have him close to slightly above bubble-level. Overall, Council is a +2.28 offensive piece, about a full point worse than Taylor per game but still a very solid player on this end.

Where the differences lie, undeniably, is on the defensive end. We’ve gone over Taylor’s defensive weaknesses, but Council’s been KU’s best overall defender this season. He’s added +2.29 value points per game defensively (+4.02 per 100 possessions), and he’s done so in a system that relies on KU switching a bunch (meaning he has to be versatile as well). Council isn’t doing it through high rates of steals or rebounds (he’s about bubble level on these components), but through stinginess. Looking at Council’s game, other guards that put up similar offense/defense splits include Frank Mason as a junior (2016), Devon Dotson as a freshman (2019), and Mario Chalmers (especially 2008).3 With data going back only to 2018, there isn’t a closely similar player in terms of Council’s offensive breakdown among the three factors of scoring, ball-handling, and (offensive) rebounding. Council scores at a slightly-above bubble rate, but he’s been the best ball-handler since at least 2018, adding +4.48 points per 100 on this element of his game (Dajuan Harris’ best season was +3.83 and Devonte’ Graham’s 2018 year was +3.61 on this area, but Juan was a notably inferior scorer and Graham a notably superior scorer to Council so far).

In conclusion, Council has been even better than advertised and likely better than even KU fans are giving him for due to his defensive coverage and durability. While there are questions about his consistency doing this over a full season and ability to play alongside Darryn Peterson, there’s no denying that KU getting to 11-4 in a tough schedule without its star for 60% of the available games has been in large part to the play of Melvin Council. Council leads the 2025 team in POCWAB at +2.11, which is already in front of all players from last year over a full season aside from Hunter Dickinson.

  1. Currently, if we combine all three comparison looks at player value (per game, per possession, and per season), Council is playing as an 89.4%ile KU Jayhawk. Tyshawn Taylor in 2012 was at 90.4%ile. But this is comparing a full season for Tyshawn and only 15 games for Melvin. It’s likely that Melvin’s per game and per possession value regresses some, but his per season only grows. The best estimate is that he will have a more valuable season than Taylor did. ↩︎
  2. He was nicknamed “Tyshawn Turnover” after all. ↩︎
  3. Both Mason (2017) and Dotson (2020) would have offense-heavy seasons later in their careers. ↩︎

2025 College Football Ratings

Top 20 in Power Ratings:

  1. Indiana +38.79
  2. Ohio State +31.33
  3. Notre Dame +29.49
  4. Oregon +29.41
  5. Texas Tech +29.01
  6. Miami +26.86
  7. Utah +24.42
  8. Georgia +21.24
  9. Iowa +21.09
  10. Ole Miss +20.44
  11. USC +19.87
  12. Vanderbilt +19.86
  13. Texas A&M +19.71
  14. Alabama +19.54
  15. Washington +18.42
  16. Oklahoma +17.49
  17. Penn State +16.75
  18. BYU +16.33
  19. Texas +15.65
  20. Michigan +15.27

53. Kansas +4.25

The average ratings for each power conference is as follows:

  • SEC +12.57
  • Big10 +12.20
  • Big12 +6.46
  • ACC +4.31

Note that the best teams according to this rating are in the Big10 and Big12. Georgia is the SEC’s top team but doesn’t show up until spot #8. What the SEC does have in its favor is depth. Its worst team, Mississippi State, is #61 and bests 6 ACC schools, 6 Big 10 schools, and 5 Big 12 schools.

These difficulty with college football ratings is that what they are most useful for (comparing conference strengths) isn’t as valid until after the postseason, when we get more cross-conference games. After the playoffs and bowl games, we get a better sense of how the conferences shake out. There should be more cross-play in the regular season with fewer conference games; this is particularly true given the playoff system now in place.

2026 Team – Christmas Break Review

The 2026 Kansas Jayhawks finished the non-conference portion of their schedule with a 10-3 record. At #17 in the AP Poll, #16 in KenPom, #15 in NET, and #11 in Torvik, the Jayhawks have proven they can play with about anybody with or without their star freshman, Darryn Peterson. KU has a +9.85 PPGAB value score (+1.82 Offense and +8.03 Defense), with KU’s defense ranking 7th in KP and 2nd in Torvik as of 12/23/2025. Torvik shows the Jayhawks with a +2.4 WAB.

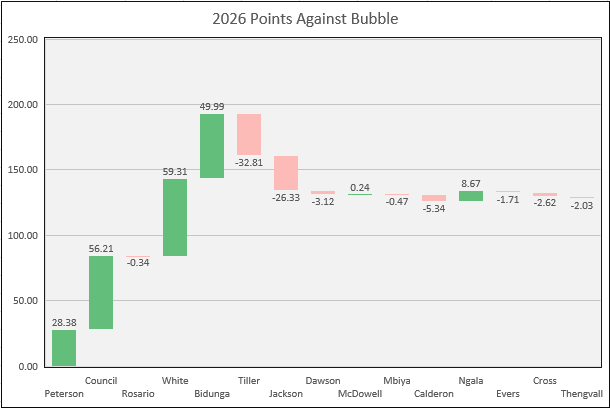
The Waterfall chart above shows the total value per player. This is not rated in per game or possession, so it does a fine job of discounting Peterson given his limited minutes so far. We will look at the team by player, evaluating each’s role on the team now that we’re 13 games in.

Darryn Peterson

The much-hyped incoming recruit has been as good as advertised. Peterson is shooting an official 65.1% in true shooting on a high shot frequency (34.1% by our count), leading to an estimated offensive value of +14.5 PAB per 100 possessions. The problem at the moment is that he has only played 4 official games (and 20% of possible minutes) due to an ongoing leg injury.

The nature of the leg injury is oft-debated among the fans, many of whom have become frustrated by his unavailability. But let’s first look at his value profile. After all, he’s played in 4 games, helping KU win against power conference foes Missouri and N.C. State. Currently, he’s posting a team-best +7.09 PPGAB and +16.17 Per100. These numbers would put him in the top 99% of all KU players. Unfortunately, his limited playing time hurts his cumulative value. He is fourth in the team in WAR (+0.96), total PAB (+28.38) and POCWAB (+0.64). He has only played in one game in Allen Fieldhouse (vs. Green Bay), adding further frustration to the fanbase.

His overall value and place in KU lore will depend on what happens in the New Year. If he cannot play much more, and if he ultimately “shuts it down” and misses the bulk of conference play and NCAA Tournament on what appears to be a relatively minor issue, he will not be viewed favorably. However, if he can get healthy enough to play, his talent should catapult him into being a notable KU name among the one-and-dones.

Tre White

The senior transfer from Illinois, White was projected to be a comfortable above-bubble player but not a star. He’s far exceeded this, posting a +4.56 PPGAB and +9.08 Per100, helping him to lead the team in overall PAB and WAR. White is the team’s third-leading scorer in PPG (second overall) but is doing so at an incredibly high efficiency (67.9% TS). Lately White’s defense has also been solid, adding value by being a versatile iso defender who doesn’t get beat or allow many open 3’s for his man. He’s also KU’s best wing rebounder, complementing the Kansas bigs.

Without Peterson the question of how KU will score is still an issue, but White has stepped up admirably. White’s Per100 percentile is at 93.4% of all KU rotation-player-seasons since 1993. This puts him in the company of 2008 Mario Chalmers and 2023 Jalen Wilson.

Melvin Council

Council has been a fan-favorite since the off-season, but even the biggest Melvin Council fan couldn’t have predicted a season as well as the one Melvin has started to produce. He’s putting up a +4.32/+7.75 season so far, and is the team-leader in POCWAB (+1.67) thanks to a 36-point performance against N.C. State. Melvin’s durability is in sharp contrast to Peterson’s. Council has played a team-high 83% of possible minutes (he played an astonishing 93% of minutes last season, indicating there’s more in the tank for Kansas if they need him for Big 12 play) and in 33 or more minutes against each power conference opponent KU has faced.

More detail about Council’s value profile shows that he is a very good defender. His stinginess has disallowed easy baskets for opponents, and for a guard he rebounds quite well. His offensive profile is solid despite low shooting marks. Council’s best weapon is his ball-handling, indicated by his official 3.7 A/TO ratio (we indicate that this aspect of his game adds to the team 4.7 points per 100). Melvin’s low shooting marks have been improving since the N.C. State game. He has more confidence and is taking better shots in recent games.

Flory Bidunga

Among those who have been available (so, excluding Peterson), Flory is right along Council and White in terms of value. KU truly has a “big 3” of solid pieces this year, ironic given how much derision KU’s big 3 got last season. Flo’s current value marks are +3.85 and +7.60. He’s the team’s best rebounder by far and a menace around the rim (32 total dunks), particularly against weaker opponents. Flory’s opponent-adjusted numbers have been better against non-power conference foes (+5.70 per game) than for power-conference opponents (+2.69). Hopefully Flory can maximize his play against the better teams.

In a sense Bidunga might be KU’s most important piece. His rim protection and rebounding are clearly absent when he’s out of the game. He’s KU’s only real inside presence with solid value as we will see, so when he’s out, KU doesn’t really have much behind him.

Bryson Tiller

Now we arrive at the Kansas player with the fourth-most minutes played on the team. After Peterson and KU’s durable big 3, Tiller is the player Self trusts the most. Bryson had a break-out game, really half, against North Carolina in Chapel Hill by making 4 three-pointers out of 4, but has struggled to shoot from deep since.

His overall value is frankly not good. His TS% of 53.8% looks solid enough, but this is done off of assisted baskets primarily. He’s not great at getting his own shot, either by iso work or in put-backs (especially for someone his size). He plays soft at the rim at times, leading to missed layup chances and blown defensive coverage. His value (-2.52/-5.81) profile fits alongside someone like 2018 Mitch Lightfoot. He grades out as KU’s worst rotation defender on a per game basis (second-worst on Per100 basis).

Tiller’s playing about as well as one might expect a lower-ranked true freshman to. It’s not the end of the world. He has clear talent and skill that should lead to better things down the road. But he’s nowhere near the player many think he is, and the staff should play him less.

Jamari McDowell

McDowell has emerged as KU’s fifth starter when DP is out, and though he only had his first double-figure game of his career in the most-recent one against Davidson, McDowell has put up solid, bubble-level marks (+0.02/+0.06) while playing 44% of minutes. Jamari is doing this by hitting his threes (42.4%) and playing solid defense. He doesn’t create much offense, though he does see the floor well and has positive ball-handling marks with a 2.25 A/TO ratio.

The interesting thing to see will be what he can do if/when teams start crowding his shot. He has only taken 5 shots inside the arc (compared to 33 outside it) this year. The better teams will look to make him beat them off the bounce.

Elmarko Jackson

Jackson is the other returnee that Self has played more in games Peterson has missed, though Elmarko has been far inferior. Jackson’s value (-2.03/-7.02) has been plagued by very poor performances around a few solid ones. Elmarko scored 17 against Tennessee in KU’s comeback win in Las Vegas and followed that up with a solid 11 against stingy Connecticut, his two best efforts of the year. However, since that time he has only scored 5 total points in 78.5 total minutes. One area Elmarko has looked better in recently has been his ball-handling, which on the year is slightly above-bubble.

Aside from this, Jackson hasn’t been a good defender, he hasn’t rebounded in part due to his position, and he doesn’t do a lot to contribute on offense either. Jackson’s best role should be to put defensive pressure on opposing players and to spell Council when KU’s starter needs a break. While everyone has bad games, Jackson needs to find a way to make his bad games not outright terrible ones. Either way, Self is likely playing him too many minutes.

Kohl Rosario

Rosario is the third guard/wing type that Self is trying to fit in. Kohl has been electric at times finishing dunks. He’s 14-15 this year inside the arc (all at the rim), including 10 dunks. He makes hustle plays on the glass, and when it’s all said in done, is a bubble-level player (-0.03/-0.09). What is holding him back is a quick trigger (13-47 from 3, 27.7%) and little offensive creation abilities. He just isn’t anywhere near a KU-level player on the offensive side of the ball at this time.

His defense has been solid, especially guarding his man. He among the leaders in stinginess, adding about 5.3 points of value per 100 possession in this regard. Combined with a decent ability to generate steals and an average defensive rebounding profile as a guard, Kohl is a +4.2 per 100 defender. I’d roll with him over Jackson for the most part.

Jayden Dawson

Dawson rounds out our rotation of guards/wings that Self has experimented with, and despite coming in as an offensive weapon who could score with questions on his defense, Dawson has been a defense-first player with very poor offensive marks. Overall, his value (-0.28/-1.34) indicates that he has only earned a back-up role at this point.

It’s not always possible to know if the reason someone is shooting well or not is due to opportunity, but Dawson’s 6-26 (23.1%) mark from 3 hasn’t been what KU thought it would get. If Dawson played more there’s reason to think those numbers would increase, but at the moment someone like McDowell has hit shots at a higher clip. Ultimately, one has to believe that Dawson will have his moments and produce at some point even if he never becomes a star while in a Jayhawk uniform.

The Rest

Paul Mbiya gets a special call-out due to his position. Mbiya, though not a full rotation player (8.7% of minutes), does play as a back-up big whenever KU’s 2 main bigs are in foul trouble. This has led to the freshman center appearing in 10 of KU’s 13 games, including big minutes against Tennessee. Mbiya isn’t the most mobile, but he does have size and length that he uses well. His value numbers (-0.05, -0.62) are high enough to make you wonder if he should be getting some of Tiller’s, but we surmise that he would be exposed given KU’s defensive style.

Samis Calderon (-0.76/-6.88) is an athletic and potentially solid player, but he doesn’t have the ball-skills to do much on offense at this level at the moment. But his defense has allowed him to get spot minutes here and there.

Nginyu Ngala (+1.44/+17.98) torched the nets early on in spot minutes against weaker opponents, but Gee has only played 3 total minutes against power conference opponents this season (all against Syracuse). His size his limiting his ability to contribute.

The walk-ons have all appeared in 4 games each. Wilder Evers (-0.43/-9.44) is the only one to have scored (3 points), Justin Cross (-0.65/-20.90) has added an assist this year, and Will Thengvall (-0.51/-17.56), the only native Kansan on the roster, has a defensive rebound to his name.

Conclusion

The 2026 Kansas Jayhawks are getting much more from three starters than expected, and even without Peterson have been noticeably better than last year’s team. On the year the team is +8.76 in games without DP (and +12.31 in games he’s played). While KU needs Darryn back to be at its best and have the best chance at making a Final 4, even without him they can win games with elite defense and timely shooting.

All things considered, it’s better that KU isn’t reliant on one player like it looked they might be, and should Peterson get fully healthy, missing him for a large portion of the non-conference might be a benefit in that it helped others build confidence. Adding Peterson to the play of Council, White, and Bidunga is an exciting thought.

A Modest Proposal on the CFP

Recently we discussed that the sport of college football and its postseason was a mess of contradictory goals and values, ending with the statement that we don’t have a good fix for it. However, we do want to address what we see as the major issues of the sport and hopefully provide a better system. If it were up to us alone, we’d blow up the playoff completely and go back to smaller, traditional, regional conferences that play in traditional bowl games (i.e. Big 10 vs. Pac 10 [yes Pac 10 not 12] in the Rose Bowl). We’d also mention that a “plus one” system after the traditional bowl season wouldn’t harm things either…in other words keep the traditional bowl games and then re-rank teams in early January, taking the final two teams to play in a CFP championship game on a neutral field.

Of course this idealized version prioritizes tradition and pageantry over an objective playoff system, something the fans tend to want. So here’s our modest proposal. It is three-fold in how it is set up:

  • Use the model of the NCAA Tournament in basketball. Expand the field to 32, include all conference champions automatically, and then seed teams in an S-curve format.
  • Determine the field through a list of objective criteria, effectively doing away with the committee and (much) human opinion.1
  • Maintain the beloved and long-running 6 bowls as the quarterfinal and semifinal rounds of the playoff. The first two rounds (R32 and R16) will be on-campus games hosted by the better seed.

To set this up as a trial run, we did a mock exercise today (12/5/2025), just before the conference championship games kick off this weekend. In order to determine automatic qualifiers, we assumed each betting favorite as the winner of its respective conference championship game.

Using ESPN’s data, we set up a ranking system which included these following 5 categories under various weights:

  • Strength of Record (SOR): 40%
  • Football Power Index (FPI): 10%
  • AP Poll rank: 10%
  • Game Control (GC): 20%
  • Average Game Win Probability (AVGWP): 20%

The weighted average of each team’s ranking in these categories is then ranked, producing a final S-curve ranking. Of course these weights and metrics are open to change. We would also recommend not using ESPN’s data for these rankings and instead introduce a truly-independent team of statisticians to set up these criteria. But for our purposes, we used ESPN’s numbers to highlight what a bracket might look like.

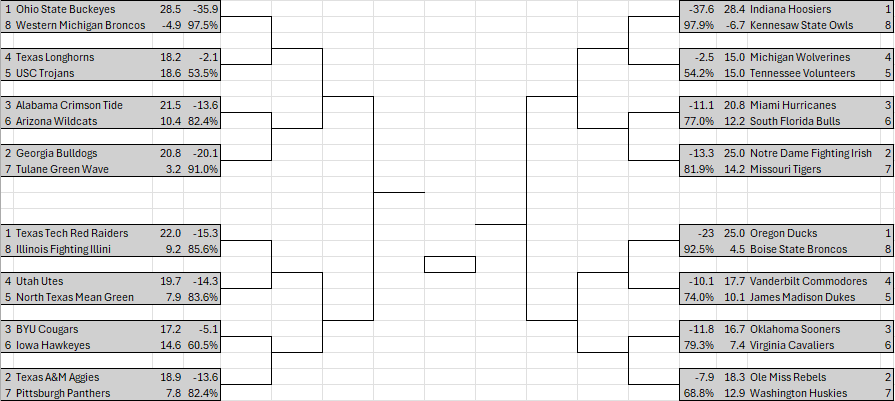
Now that the S-curve ranking is set, we now go to the bracket. First, we have to include any conference champion otherwise outside the field. This means that presumed champions Boise State (MW), Kennesaw State (CUSA), and Western Michigan (MAC) knock out teams 30-32 on the original S-curve.

Taking #1 on the S-curve, Ohio State, we place the Buckeyes in the top-left corner against the #32 S-curve team, Western Michigan. Then, taking each team’s current FPI ranking and adding 2.5 points for home field advantage, we estimate that Ohio State would be 35.9 point favorites, corresponding to a 97.5% winning rate. We do this for each team to get a bracket that looks like this.

This bracket was set up using a rigid S-curve, which does differ from the basketball tournament where the committee has certain bracketing principles that prevent teams who played each other in the regular season to play in the first round, etc. We could introduce these same principles in football, i.e. switch things around in some of the potential 2-seed vs. 3-seed matchups so that prior matchups during the year (Georgia/Alabama, Notre Dame/Miami, and Ole Miss/Oklahoma) can’t recur in the round of 16. There are arguments to be made for either system (i.e. the NFL doesn’t adjust seeding to avoid inner-divisional matchups in the Wildcard round), and we don’t have strong opinions either way.

One might notice that the 1-seeds have a decided advantage by drawing lower-ranked, AQ teams; this mirrors basketball where the 1-seeds have a 98.8% winning probability since 1985 (158-2). The 4/5 matchups are mostly close games, though a few non-power conference champs with good records did overachieve to earn 5-seeds.2

Each conference gets a fair shot at making the field. Here is how conference bids shake out:

  • SEC – 9
  • Big Ten – 8
  • Big 12 – 4
  • ACC – 3
  • American – 3
  • FBS Indp – 1
  • Sun Belt – 1
  • Mountain West – 1
  • CUSA – 1
  • MAC – 1

In a surprise, the American Athletic Conference (AAC) got in three teams to tie with the ACC, a traditional power league. Next up is the Big 12 with 4. The Big Ten has 8 and the SEC has the most with 9 teams in the field. These numbers compare to basketball, where the best conferences tend to get around half of their teams into the Big Dance.

Just missing the field are the following teams, who were technically in the top 32 but got bounced out due to the provision that each conference champ gets in:

  • TCU (#30)
  • SMU (#31)
  • Louisville (#32)

This indicates that the Big 12 and ACC are close to getting more teams in, and that some years they likely would get 5 to 6 instead of 3 to 4. This seems justifiable given the relative strengths of the leagues.

This and That

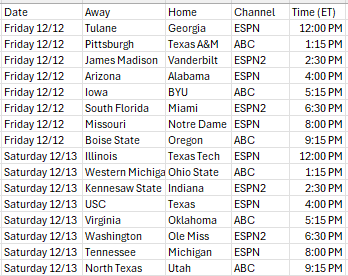
We set up a hypothetical first round schedule, taking place on Friday, December 12 and Saturday, December 13. Starting at noon with Tulane at Georgia on ESPN, 8 games are played on Friday followed by 8 on Saturday. These games are presumed to be broadcast on ESPN’s networks, and like the basketball tournament these games have staggered start times and can be enjoyed all day.

Since we are using the AP poll, the question arises as how to rank teams that aren’t in the top 25 or even receive votes. We thought the best thing to do would be to take all the teams that aren’t in the top 25 (actually ~ 37 with teams receiving votes) and then rank the rest based on SOR. This won’t make a huge difference but will ensure that a team on the margin isn’t unduly punished or rewarded for not being ranked. Another suggestion would be for AP voters to rank a top 50 or 75.

Simulation

The final step would be to play the games. We simulated one instance to see how this might play out. In the first round, the Pitt Panthers knocked off A&M in a surprise 7-seed over 2-seed upset. But the upset of the tournament was Kennesaw State’s win over Indiana despite the Hoosiers being 37.5 point favorites. In the second round, Texas got revenge at Ohio State and the Buckeyes fell. Pitt continued its Cinderella run by beating BYU. Miami won at Notre Dame in a mild upset as well. The quarterfinal games are played at traditional bowl games with home field advantage being erased, and we had the best-remaining team Oregon selecting to play the Rose Bowl against Oklahoma. The Sooners would upset the Ducks in this sim. Next was Michigan playing Miami at the Orange Bowl, a de facto home game for the Hurricanes who would also win. Next was Alabama and Texas in the Peach Bowl (Tide would roll) and lastly Texas Tech over Pittsburgh in the Sugar Bowl, with Tech opting to play in New Orleans as the second-remaining 1-seed in the field.

The semifinal games would be Texas Tech defeating Alabama in the Cotton Bowl and Miami edging Oklahoma in the Fiesta Bowl. The final would showcase Texas Tech (-1) against Miami, with the winner being Miami in a close contest. Quite a wild sim.

Conclusion

Leaning into the March Madness model would expand the playoff (leading to more revenue), ensure each conference gets a bid, avoid the mess of having good teams miss the playoff (teams who miss the field starting around 30 don’t really have much argument), and still keep some tradition by having six prestigious bowls serve as playoff rounds just as with the 12-team format. Additionally, utilizing objective metrics in a sensible way could help avoid much of the bias perceived to be in the sport. Of course a committee could still be used to aid in setting the field should bracketing principles be part of the exercise, or even helping provide a human element to the poll portion of the ranking. We do think it necessary to move away from a pure committee model at this junction, however.

  1. The AP poll would play a small part of the final ranking ↩︎
  2. Looking at things closer, this may have been due to ESPN not adjusting to opponent for its AVGWP metric, essentially aiding teams with weaker schedules. Again, don’t take this bracket too seriously, it was merely our first attempt to construct a 32-team field. Presumably these metrics would be sound if implemented. ↩︎

The Mess That is College Football

The chorus of fans that wanted a “playoff” to determine the college football national champion eventually won out over tradition, and bowl season was effectively changed for good in 2024 when the 12-team CFP was introduced. Before this time, though traditional conference affiliations to bowls had been relegated to a secondary concern in place of getting the appropriate teams for whatever format (be that 2-team BCS or 4-team CFP), at least the tradition of the teams playing in bowl games tiered to similar-quality opponent was in tact. The only thing that really changed from the BCS era to the 4-team CFP era was a “plus-one” system where the winners of the two semifinal bowls met for the national title instead of just having the top two teams play each other as was the case during the BCS era.

But nowadays, the 12-team playoff means some important differences exist compared to past postseason eras. Firstly, the four losers of the first round CFP games (which are played on-campus) end their seasons without appearing in a bowl at all. This is a huge departure from tradition. These are some very good teams that don’t get to experience a bowl and end their seasons in mid-December instead of around New Year’s Day. Secondly, the four winners of the quarterfinal rounds play in 2 bowl games and the two semifinal winners will play at three neutral-site locations. This means that for a team like Ohio State last year, they will have won both the Rose Bowl and the Cotton Bowl (and CFP Title game) in the same season. Obviously no one had done this before because no one had the chance to do so. These changes–good teams not going to a bowl and better teams winning two bowl games in the same season–effectively changed the sport for good.1

While it may take some getting used to, this system could be worth it if it solved the dilemma fans wanted solved–a legitimate playoff system that didn’t exclude championship-contending teams and was fairly adjudicated to give all teams a fair shot at making the bracket.

Some “debates” are inane and should be immediately dismissed. Most mid-major teams with good records aren’t actually as good as the power conference teams with worse records based on much more difficult schedules. There’s a lot of silliness out there that wants to promote the underdog when it is nakedly obvious this underdog doesn’t belong. We won’t do that here.

Rather, what the 2025 playoff selection is shaping up to be is a complete mess. Teams are bunched, the order of the teams after about three doesn’t make much sense, and the sport still can’t answer what should qualify a team for the playoffs–resume, dominance through power metrics, some blend of the two, etc. The committee’s answers of where they slot the teams varies and is often contradictory.

The best way to explore this deeper is to look at the field as constructed. Below is the committee’s top 16 teams in order along with their overall records.

RankTeamRecord
1Ohio State12-0
2Indiana12-0
3Georgia11-1
4Texas Tech11-1
5Oregon11-1
6Ole Miss11-1
7Texas A&M11-1
8Oklahoma10-2
9Alabama10-2
10Notre Dame10-2
11BYU11-1
12Miami10-2
13Texas9-3
14Vanderbilt10-2
15Utah10-2
16USC9-3

There are a few questions that immediately arise seeing this list. After the two undefeated Big 10 teams, there are six 11-1 teams all from power conferences. The first five of these teams fill out spots 3-7 but the last 11-1 team, BYU, drops all the way to 11. BYU is behind three 10-2 teams for no discernable reason. Is the committee unaware that BYU is now in the Big 12 and has defeated ranked and bowl-bound teams like Utah, Arizona, and Iowa State? They are no longer playing Mountain West teams or a mismatch of teams under an Independent schedule.

Nonetheless, even if BYU were ranked in spot #8, the committee would still have to answer why they sorted the six 11-1 teams in the way they did. And the same thing with the 10-2 teams.

Let’s look at Texas A&M, a team that had been undefeated and at #3 before a loss to rival Texas on Thanksgiving weekend. A&M fell to #7 for a loss that certainly isn’t a bad one, and behind four other 1-loss teams. Now maybe the Aggies are the 7th best team in the country, but it is tough to ignore the strong evidence that the timing of the loss they suffered hurts them. When a team lost during the college football season has mattered for a long time, but one thing the committee system and the 12-team playoff was supposed to avoid was this dilemma. Had A&M lost to Texas in Week 1 and rattled off 11 straight wins, they would very likely be higher than #7. Given that being #6 or better is shaping up to be a much better draw in the bracket that spot #7 (we’ll get to this aspect later), this makes things all the messier.

Looking at the 10-2 teams, the order of the teams once again is something that has not been objectively determined, but one thing that stands out is Miami sitting behind Notre Dame. Despite having the same record and a head-to-head win, the Hurricanes are below the Irish and currently outside the bracket while Notre Dame is currently in. Head-to-head is one of the few things that the committee is allegedly tasked with including in their analysis. So why is the order the way it is?

Consolidation and Mega-Conferences

Another change that gets overlooked when looking at the playoff selection process is the fact the conference landscape has evolved further with the elimination of the Pac-12 (at least as a power conference, I know it will technically be re-established next season with Wazzu and Oregon State adding Mountain West teams) and 10 teams shifting to the Big 10, Big 12, and ACC. Additionally the Big 12 lost perennial powers in Texas and Oklahoma to the SEC.

This consolidation of college football conferences has done two things. It has made things so there are fewer power conference champions and fewer conferences to legitimately consider as being multiple-bid leagues, and it has also made it so conference schedules are quite different from team to team. Just because two teams in the same conference share the same conference record doesn’t mean their seasons were equally impressive. Perhaps A&M’s relatively-weak SEC schedule is another partial reason they dropped as far as they did.

The SEC has taken advantage of the larger league to put an astounding 7 teams in the top 14 of the rankings. Georgia (3), Ole Miss (6), A&M (7), Oklahoma (8), Alabama (9), Texas (13), and Vanderbilt (14) are all teams with 6-2 conference records or better. Of these teams only Texas has failed to win at least 10 regular season games (more on this later). These teams effectively won against the lower competition in the league and then shared wins and losses against each other.

Out of Conference Schedules

Texas A&M scheduled Notre Dame and won. But they played this game in Week 3 so it is not as fresh in the committee’s mind. Texas scheduled Ohio State and loss in Week 1, which gave them a third loss to go along with their 6-2 SEC record and 3 other non-con wins. This of course leads to the very real question, how much should a team be punished for playing a very difficult game that almost everyone would lose? Had Texas played a weaker Big 10 team, like Wisconsin or UCLA, they’d almost certainly be at 10-2 with wins over A&M, OU, and Vandy2 and in a stronger spot than #13.

Speaking of scheduling, the SEC has gotten criticism for only playing an 8-game conference schedule, though it should be pointed out that all SEC teams are required to play an out of conference power opponent. So just as Big 12, ACC, or Big 10 teams do, SEC teams play at least 9 power-conference foes each year. Another aspect is the fact SEC teams often schedule an easy out-of-conference opponent late in the season (often the week before their big rivalries). If when you lose matters to the committee, and we all know it likely does, then there is an advantage to scheduling easy wins for your 11th game of the year. While not against any rules, it is just another function of how messy the sport of college football has become.

Playoff Selection Rules – Trying to Make Everyone Happy

One thing that is not the committee’s fault (but is the fault of the designers of the CFP) is the rule that 5 conference winners must be selected. This rule was put in to alleviate concern that the little guy wouldn’t be shut out of the playoff system, but will effectively make a mockery of the bracket. Last year we saw the additional rule that the top 4 seeds had to be a conference champ (which led to both the 3-seed and the 4-seed being double-digit underdogs to the 6-seed and 5-seed in the quarterfinal round), though this rule has been eliminated for 2025. Still, if the playoff were today then only the top 10 teams would get into the field, with the final two spots going to two conference champions not yet represented in the field.

Making matters worse, #12 Miami is not the likely ACC representative because the Hurricanes aren’t even playing in their conference championship game (partly due to unbalanced conference scheduling due to the conferences being so large). The winner of #17 Virginia and unranked Duke will be crowned ACC champion. While Virginia will get in and be the #11 team in the bracket with a win, 5-loss Duke actually might not get in should the Blue Devils knock off the Cavaliers3. In this scenario the winner of the American Championship (between #20 Tulane and #24 North Texas) would likely get a guaranteed spot as conference #4, and should #25 James Madison win in the Sun Belt (where it is heavy favorites to do so), the Dukes–not Duke–could be the final conference champion to earn an auto bid.4

This is a giant mess. Not only has the 12-team playoff system not eliminated controversy, it has in fact added new ways of controversy!

Is Objective Any Better?

We come to the point of the article where I’m supposed to tell you that an objective system, something that takes into account each team’s schedule and results on the field and other metrics will give us an answer as to how teams should be ranked. But sadly this also isn’t the case. Let me show why.

An objective system is anything that uses non-subjective criteria that can rationally be tied to what the sport is trying to do, which is presumably field a fair 12-team playoff. The word fair is italicized because the current CFP system doesn’t really even list an objective standard or goal for how it wants its 12 teams to be viewed, so there is ambiguity as to how the committee even should be selecting teams. They don’t focus on most-deserving or even best. Obviously the the fifth-best conference champion isn’t going to be among the 12 best most years. And most-deserving would indicate privileging a team’s resume over its computer power metrics, something we will see briefly.

So to make as objective of a system as I could, to demonstrate, I took two different sources (Kelley Ford and ESPN) and also two different metrics from each–one resume metric from each and one power metric from each, and got an average ranking for all four of these metrics to then “objectively” rank the teams.

Objective RankingTeamKFord PowerKford Most DesESPN FPIESPN SORAvg.Committee RankDiff
1Indiana11211.252+1
2Ohio State22121.751-1
3Oregon43443.755+2
4Georgia85856.53-1
5Texas A&M1041036.757+2
6Alabama610687.59+3
7Texas Tech5115107.754-3
8Notre Dame313313810+2
9Ole Miss1271279.56-3
10Miami7127141012+2
11BYU17615611110
T12Oklahoma13916911.758-4
T12Vanderbilt148141111.7514+2
14Utah9159151215+1
15Texas1514131213.513-2
16USC1116111713.75160

There’s a lot here, but basically the objective ranking is averaging the four criteria with a straight average and then sorting from best to worst. The final column looks at the difference between what the CFP committee said and what it would be under this objective ranking.5

As we see, even an objective system introduces problems. To begin, the top three teams are all Big 10 teams. Assuming the Ohio State/Indiana Big 10 championship game is a close contest and the loser doesn’t fall much, the final objective ranking system would produce the top three seeds from the same conference.

Now maybe this is the fairest thing, after all it isn’t impossible for the Big 10 to have the three best or most-deserving teams, but with unbalanced schedules, note that only Indiana and Oregon have faced off against each other (and Oregon avoided other solid Big 10 teams like Michigan). The point is that it looks messy for college football, a sport which once pitted teams from different conferences in the post-season bowl system to see which region of the country truly had the best football teams, to now have inter-regional mega-conferences which have all the talent and are stacked at the top of the 12-team bracket.

Moving beyond this, we see that 2-loss Alabama actually jumps from #9 to #6 in this system, ahead of 1-loss Tech, Ole Miss, and BYU. If the committee had the Tide currently at #6 everyone would be saying this was because of brand bias. But here’s a system, unbiased as I could make it, saying the Tide are under-rated.

If we explore further, we see that teams have vastly different power rankings and most-deserving rankings. BYU is ranked as the 17th or 15th-best team (using power metrics) but the 6th most-deserving team. When we average this out we get the Cougars as #11. Texas Tech, their Big 12 opponent in the conference championship game, is kind of the reverse (#5 in both power metrics) but #11 or #10 in terms of resume.6

The objective system does help 11-1 A&M (who lost late in the season, something the objective system avoids considering) and Notre Dame (who some think are included due to brand). It also catapults Miami into the top 10 and kicks Oklahoma down to 12.

To Play or Not to Play

Another messy thing is that certain teams will play a 13th game while others will sit at home this week. Alabama, sitting at 10-2 and at #9 in the standings, would certainly like to beat Georgia and move up but should the Crimson Tide lose, this would push their record down to 10-3. While the committee has indicated it wouldn’t necessarily punish them for this, a double-digit loss to the Bulldogs might change people’s minds. Georgia is 2.5 point favorites, so this is a real possibility. But why should Alabama be punished for being good enough in SEC play to play in this game when #6 Ole Miss and #7 Texas A&M sit comfortably in the field?7

Contrast this with Notre Dame, a team at #10 who could benefit from being idle. Certainly the Irish would fall below current #11 BYU should the Cougars win against Tech, but they could also jump ahead of Alabama should the Tide lose. Notre Dame will want BYU to lose, but should the Cougars win, certainly Bama to then fall to Georgia.

Looking at Texas Tech, at #4 this team would skip to the quarterfinal round had the playoff started today. A win might move them to #3, but only if Georgia loses to Alabama, but in all reality there is more risk in playing and losing the Big 12 title game than in what they get for winning that game. And this is the messy part. Instead of conference championship games being crucial for a team’s bowl assignment and potential for playing for a national championship, they are instead a potential hindrance and introduce the concept that it can sometimes be better to finish third in your conference instead of second.

Concluding Thoughts

In trying to wrap this all up, I think the main idea is that the sport of college football is a broken system. The incentive structure is off on many layers–scheduling tough teams can unfairly hurt teams that lose these marquee non-conference matchups, when you lose games in the season matters, brand names seem to get a boost in the eyes of the committee, the 12-team format means the conference championship games can introduce more risk to a team’s national title hopes than reward, the postseason format has changed much of the charm of once the sport once was, conference realignment has dramatically altered the regional nature of the sport, the size of these consolidated conferences has introduced unbalanced schedule issues, the desire to include the “little guy” in lesser conferences can unfairly exclude much better teams in the power conferences, and finally and perhaps ultimately there is no real objective or clean way to tie all these loose ends together.

The sport of college football is a mess, and one we don’t really know how to best fix. Returning to smaller conferences and traditional bowl tie-ins would help things feel like the “good ole days,” but those days had their own problems and led to where we are now. Growing the bracket from 12 to more teams would further diminish the bowl aspect of the sport’s postseason and likely introduce more issues.

Addendum

We didn’t even mention the Lane Kiffin drama. A team who is #6 in the playoff ranking and will almost certainly host a CFP first-round game (and likely be strong favorites to win that game) has lost its head coach to a rival in-conference school. There is very little guidelines as to when coaches can be fired and hired, the portal and NIL issues also dictate much of what happens and are poorly regulated, adding to even more messiness.

  1. Technically winners of the four-team CFP also won two “bowl” games though the CFP National Championship game was never labeled with the “bowl” label. And even more technically the BCS era introduced an additional National Championship Game that was outside the bowl system, though this NCG was played a week or so later at the same site of the actual bowl game. ↩︎
  2. UT’s loss to Florida is a solid rebuttal and one the committee pointed out. But at 10-2, with losses to Georgia and Florida while also having solid wins, Texas would be on much firmer ground than they currently are. The point is that they were effectively punished for scheduling a big time opponent. ↩︎
  3. This is not that unlikely. Duke is only 4-point underdogs and has a 43.7% chance of winning according to ESPN’s FPI. ↩︎
  4. Frankly I’m rooting for this scenario. The CFP criteria is that it takes not members from 5 different conferences, but rather that it takes the top 5 conference winners among its 12-team field. The ACC would have Miami, a team in the top 12, not get into the playoff but be leapfrogged by conference winners in the American and Sun Belt who are ahead of the ACC’s actual champion, currently unranked Duke. ↩︎
  5. Note that “objective” does not equate with “accurate” or “true.” Objective just means we select a set of criteria that isn’t determined by brand name or a committee’s opinion. We just take what the computer calculations are and rank the teams. ↩︎
  6. Another messy aspect is that Tech and BYU played each other in the regular season and Tech won handily. With both teams at 11-1 and in the same conference, if we went purely by just resume, BYU would have the better argument despite being outmatched in the teams’ first meeting. ↩︎
  7. Alabama can’t blame the anyone but themselves for losing in Week 1 to Florida State, but in the scenario where they lose to Georgia in the SEC championship game and fall out of the top 10, what will prevent them from being in the field is the fact they won the tie-breakers among the 7-1 SEC teams (and went 10-2 with a loss to non-conference FSU instead of going 10-2 with two SEC losses). ↩︎