
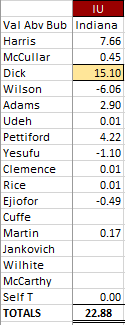
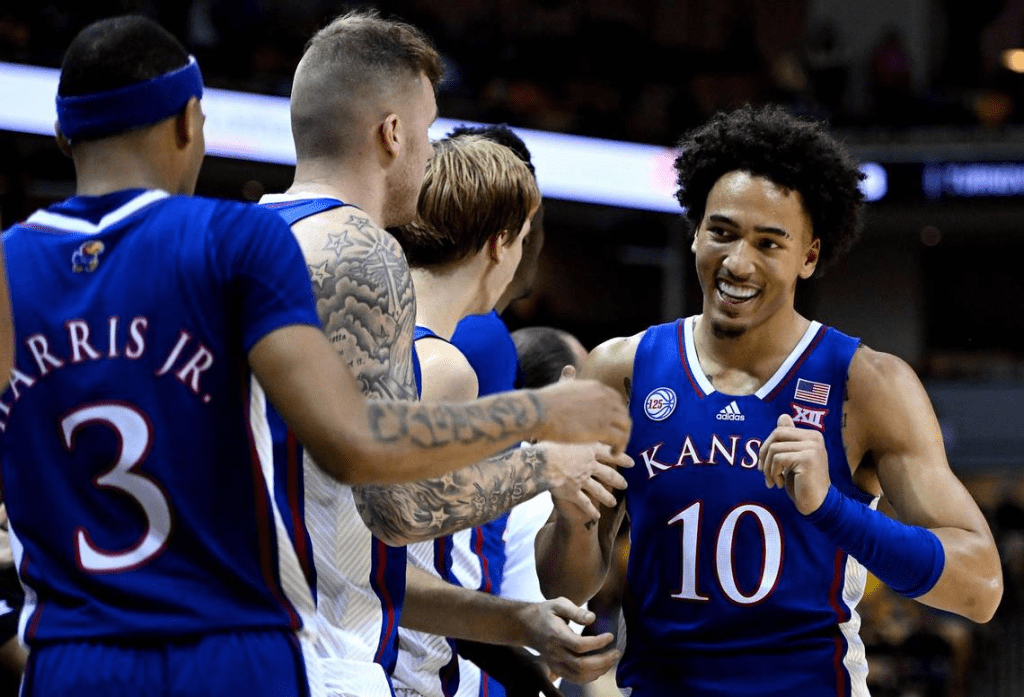
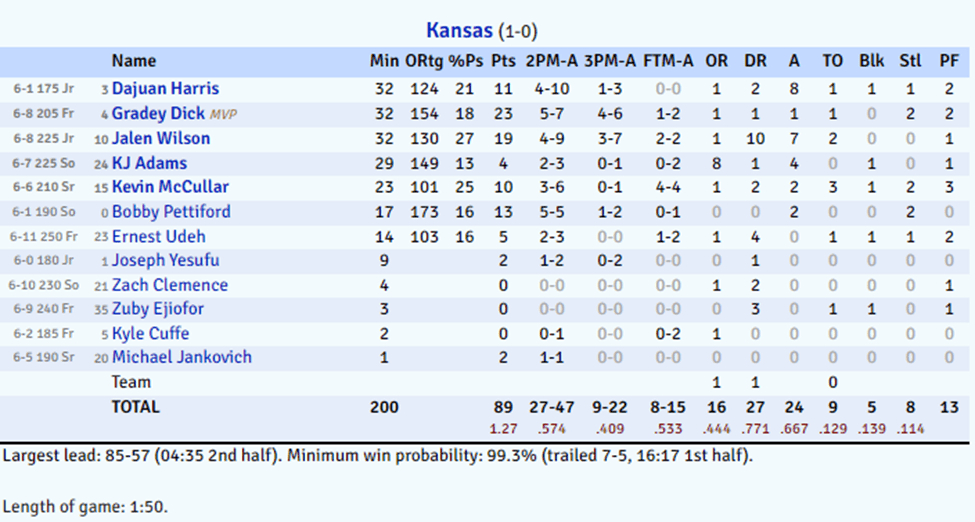
Gradey Dick had his second team-MVP game of the season while putting up the best individual performance of any Jayhawk so far thanks to great shooting and very solid defense.

Gradey Dick had his second team-MVP game of the season while putting up the best individual performance of any Jayhawk so far thanks to great shooting and very solid defense.
The “5” spot in the rotation this year was hotly debated by KU fans coming into the season. Some like Zach Clemence due to his perceived shooting ability. Others were high on 5-star freshman Ernest Udeh with his 6’11 frame. Other have pointed out Zuby Ejiofor’s ability, especially now that we have seen his rebounding skill. Still others wanted to see what D-2 transfer Cam Martin could do, given his prolific scoring ability at the lower level.
Despite all this, the man who has won the starting job is K.J. Adams. Undersized for a 5, Adams is neither a post-up scorer nor an outside shooter (he is 0-1 from 3, and 4-13 total on shots outside the paint). His free throw shooting is poor (8-21). Yet, he finds a way to average a respectable 8.2 PPG, currently good for fourth on the team.
His defensive rebounding rate is 8.7%, which is very low for a post player. Despite this, and his lack of size for his position, he attacks the offensive glass effectively. His 4.5 RPG is not great, but it does add some value for Kansas. He blocks a fair number of shots (his 9 leads the team). He has 24 assists as well, good for third. On the other hand, he only has 9 steals, which is the fewest among the starters.
The question, “how is K.J. Adams adding value” is not meant to disparage Adams. It is merely a curiosity. He plays an unorthodox style, yet does so effectively for Kansas. Through 10 games, Adams has added +0.83 points per game above bubble. Anything positive is a good score, and Adams’ score indicates he would earn minutes on about any Kansas team (although there are many years in which he wouldn’t start at either front-court position).
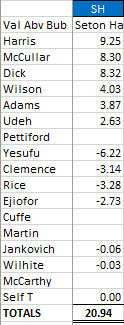
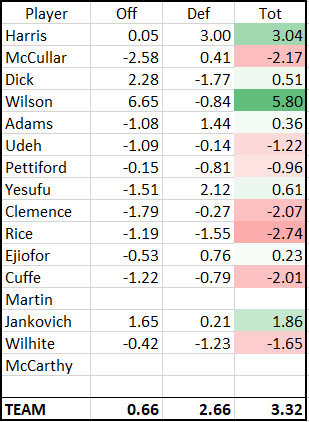
Let’s first answer this through breaking down his value stats as calculated on this website. Adams is adding +0.83 per game. Broken down, his value is +0.04 from offense and +0.79 from defense. Let’s start with his offense.
Offense +0.04
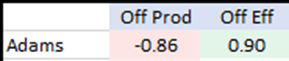
This first split breaks down K.J.’s offensive value into Production and Efficiency. These are points of value relative to bubble, with 0.00 being bubble-level. K.J. hasn’t been super-productive. He is averaging 8.2 PPG, which in 25 minutes per game, is not outstanding. However, he is getting those points through efficient play, which cancels out the low productivity. Basketball Reference has him with a TS% of 64.1%, which is second-highest among the rotation players. He gets a lot of his points from layups and dunks. Most of these are set up from a teammate, as he is scoring 79.2% of his points off an assist.

Another way to breakdown his value is through the following categories. K.J.’s Offensive Efficiency is 1.49, second-highest among the rotation players and best among the starters. We see that his Points accounted for per game at 7.6, or below his official PPG mark. This is because he scores off an assist more than he sets up plays for himself or others. The True shooting percentage of 58.4% is lower than the calculated one on Basketball Reference, as assisted baskets are discounted in this formula. Still, it is a very good number for one who is not traditionally thought of as a good shooter. He knows his limitations, and takes shots that are good for him. This validated by his Shot Frequency of 14.4%, which is below the mean of 20%. His Impact, however, on offense is at 17.4%, partly due to his solid assist numbers (for a big) and his offensive rebounding marks. At Missouri, Adams had a career-high 19 points. All of his points came through dunks (4), layups (5), or free throws (1). He found gaps and finished. He also made two nice passes to Kevin McCullar for assists. Here is a highlight video to get a visual of his offensive play.
A lot of Adams’ baskets are of him starting away from the goal and diving to the rim, although he scored a few this game in the post by sealing his man top-side. Still, his baskets are all at the rim. According to the box score stats, the last “jumper” made by K.J. Adams was against Tennessee, at a play at the 18:39 mark of the 2nd half. In this play, Adams finished a floater through contact while in the lane. Even Adams’ shots which aren’t layups are still relatively close.
We can break down offensive value further. This will convert elements of offense into three buckets…scoring, ball-handling, and rebounding. Scoring accounts for a player’s ability to score. It can be through volume, good outside shooting, getting to the line, or finishing tough shots. Doesn’t matter. All that matters is points. Ball-handling takes into account assists and turnovers. Assists are good, turnovers are bad. A conservative player with the ball like Gradey Dick might not turn it over much (increasing his handling score), but this comes with a price (fewer assists, which decreases the score). Rebounding looks at all the offensive rebounds won by a player, as well as any hustle play to retain possession after a teammate has a near-turnover (such as the loose-ball K.J. dove on the floor for in the above video).
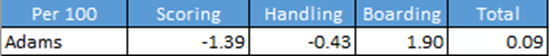
K.J. Adams’ scores break down like this. Instead of having this as a per-game stat, it is per-100 possessions. This coverts to a +0.09 score. Adams’ Scoring value is below-bubble. This isn’t too surprising, as he isn’t a tremendous scorer. Still, his Scoring value isn’t terrible either. It is above Udeh, Pettiford, Clemence, and Ejiofor. Only Yesufu and Rice grade out as better bench-scorers among the rotation.
Ball-handling is also better than it looks. Adams is a post-man, and traditionally they have fewer assists. For a 5, having a score close to 0.00 is really good. Of the other big men, Adams tops Udeh and Ejiofor by a wide margin. Zach Clemence, with only 2 official turnovers this year, is slightly better in this category (but well behind in others).
Lastly, K.J. Adams is a solid offensive rebounder, and it is this category which puts him above 0.00 on the offensive value scale. Although he is actually behind the other bigs in the rotation on a per-possession basis, he is still quite valuable on the offensive glass. His offensive rebounds against Omaha were certainly noteworthy, as they provided many second-shots that game. Next, we will break down his defensive value in a similar way.
Defense +0.79
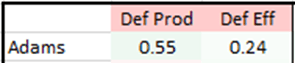
Defensive production and defensive efficiency are somewhat counterintuitive to think about. Defense here is thought of as being the inverse of offense. Therefore, defensive production looks at how well you prevent the other team from scoring, and defensive efficiency looks at how well you can block shots and collect rebounds, steals, and forced turnovers. The more defensive possessions you win, the more “leeway” you have in allowing points while still maintaining a good defensive efficiency score.
For Adams, he is stronger at not allowing points than he is on the defensive efficiency side of things. To note, this stat isn’t saying he has a 0.24 Def Eff. Rather, it is saying he adds 0.24 points per game above a bubble player’s expected defensive efficiency. At any rate, both subcategories of defense are above-bubble.

We will now go down the line, looking at statistical metrics that feed into the +0.79 Adj +/- value score. First, we see the defensive efficiency, not as a value-score as before but as the real defensive efficiency rating. At 0.94, this is better than the replacement efficiency of 0.977. In other words, given KU’s opponents, what we expect from a KU rotation player is to have a defensive efficiency rating of 0.977 or lower. Adams is lower than 0.977, albeit by just a small amount.
This rating is a product of a few things, none bigger than his points allowed. K.J. is allowing 7.5 points per game. We know from above that he is producing 7.6 points per game. So, despite him not being a solid scorer, he still produces more points than he allows. His defense is good enough to keep him on the floor.
The next column is also important, as it converts the 7.5 points allowed per game into a per possession metric. At 10.2 points allowed per 60 possessions, K.J.’s defense can be more easily compared to others. Looking at others battling for minutes at the 5-spot, we note that K.J.’s is better than Udeh’s points allowed per 60 (14.1) and Ejiofor’s (14.4). Clemence actually has a lower points-against per 60 rate (8.3), however this is in far fewer minutes. We aren’t sure if this is significant, first because Clemence has only played 45 minutes and second because Clemence doesn’t have to worry about things like foul trouble. Last season, Clemence was the worst rotation player on the team in giving up points. So, more data is needed. Cam Martin doesn’t have enough playing time yet to have a reasonable score.
The final metric we look is the possessions won, both per game and per 60 possessions. Adams only winning 6.4 defensive possessions per 60 is not good for a 5-man. Normally, the 5 will get a lot of defensive rebounds due to his height and proximity to the rim. Again, to compare against the other 5’s, we see that Udeh has 10.8 possessions won per 60 and Ejiofor has 13.8. Clemence (6.1) is slightly worse than Adams on this metric, again with limited playing time.
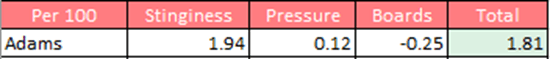
This graph shows Adams’ defensive value in terms of points per 100 possessions. The first category, Stinginess, indicates how well a defender does at not allowing his man to score. Here, Adams is better than the replacement, bubble-level defender by 1.94 points per 100 possessions. The next category is titled Pressure, but it refers to steals and other forced turnovers. Adams is slightly above bubble-level. Note that guards tend to score more highly in this category, so for KU to have its starting 5 above-bubble is a good sign. The last category is rebounding. The story here is different. At first, it doesn’t look so bad for Adams, just slightly below-bubble at -0.25 per 100 possessions. That’s a difference of 1 point over the course of about 8 games or so for Adams when compared to a bubble-level player. But remember that these values are not position-adjusted. Comparing him to other power forwards and centers, we see that each is well-above him (Wilson +1.69, Udeh +1.50, Clemence +1.38, Ejiofor +4.80). Even Gradey Dick has been a better defensive rebounder this season than Adams.
Wrapping everything up, let’s answer the question. How is K.J. Adams adding value? It’s truly very strange. Not that he is adding value, he is a great athlete and hard worker. He adds value on offense not through scoring but with high efficiency dunks and layups. But unlike other starting 5’s in recent KU history, such as David McCormack or Udoka Azubuike, K.J. Adams doesn’t score through post moves but by starting outside and cutting to the rim off of ball-screens and ball-rotation. He handles the ball fine for a big-man, which helps offset his lower-than-expected scoring marks. His strongest attribute is his offensive rebounding, but it is less through tip-ins or other boards at the rim as in the past and more through hustling down long rebounds.
Conversely, his defense is the reverse. He adds value through his defensive stinginess. Sure, he doesn’t score a bunch. But he doesn’t give up many points to his man on the other end. Furthermore, he gets enough steals and forced turnovers to add value, almost balancing out his negative-value ball-handling on offense. Lastly, despite being a strong offensive rebounder, K.J. is a minus defensive rebounder, a truly odd occurrence for any power forward given that these marks aren’t position-adjusted. Any position-adjusted look at these numbers would be even more skewed.
But we can think even more basic on this. K.J. Adams adds value because he competes. Game-in, game-out, he attempts to be better than his opponent. First to the ball, making plays on defense, sealing his man, switching onto any type of player while on defense, etc. In the 10 games so far, K.J. has produced positive value-scores in all but 2. Even after adjusting for opponent, K.J. has been positive in 7 out of 10 games, including each of the last 5. Sure, he has areas he can improve on. But regardless of whom he matches up against, he wants to win. He wants to win that matchup, that possession, that game. That’s why he is the starter, and why he will play a big role on this team in the future if he can continue to compete.
In KU’s 95-67 drubbing of Missouri, the bench only contributed 9 points (3 of those from Michael Jankovich) in 41 minutes. Four of the starters played 32+ minutes despite being in control of the game most of the way. Clearly Self doesn’t trust his bench.
https://247sports.com/college/kansas/Video/Bill-Self-looking-for-more-from-Kansas-bench-11512994/
KU’s bench has not been great, to put it mildly. The starting 5 has all had big moments in the team’s 9-1 start, but little production has come from the reserves. Sure, there are moments. Bobby Pettiford’s put-back reverse lay-up to beat Wisconsin comes to mind. But those were his only points of the game. M.J. Rice showed some great skill with his recent 19 point game, but that came against an overmatched Texas Southern squad (currently #253 on KenPom). He hasn’t been solid against the better teams on the schedule. Joe Yesufu is having a better season than last year, but he is clearly still playing at a level below the starters at the guard/wing positions. The various bigs have shown some skill, but nothing consistent enough to earn minutes. One game Udeh looks good, the other he doesn’t. And so on down the line.
Without further ado, I decided to rank the benches at KU by season. Before doing so I made some predictions on who would be the worst. My prediction was that the 2023 team will be second-worst, behind the 2012 team. But I also wanted to find out which benches were the best, and how 2023 compares to historic norms. To quantify this, a few rules are put in place. First, the main five starters will be deemed the starters, while anyone else is a bench player. Starting rotations can fluctuate, but for basically all seasons a starting 5 will emerge for Self during February and into March. Second, the quantitative measure will be total bench WAR over total team games played. This is to normalize the metric by number of games. Third, to make the number stand out better, we will convert it to a 36-game schedule. Last, the time period will be the Self-era (2004 through 2023). 20 seasons is good enough.
Results:

*The 2019 team lost Azubuike (to injury) in early January and Vick (personal reasons) in early February. Still, the starting 5 was clearly those 5 before these issues arose, so despite starting at the end of the year, guys like Agbaji and McCormack are considered “bench players.”
**The 2015 team lost Alexander (to eligibility) at the end of the year, and Lucas was the starter into March. Traylor actually made more starts than Lucas, but down-the-stretch it was Lucas as the starter. Traylor and Alexander are considered “bench players” for this exercise.
With the caveats out of the way, the Norm. column is what we want to focus on. It shows, per a 36-game schedule, how much bench value was provided that season. The average KU team provides 1.59 WAR off the bench over the course of 36 games. Most benches provide positive WAR on the season (14/20 or 70%). We see trends, with Self having better benches during the early years. The next chart will be the same as above, just sorted from best to worst.
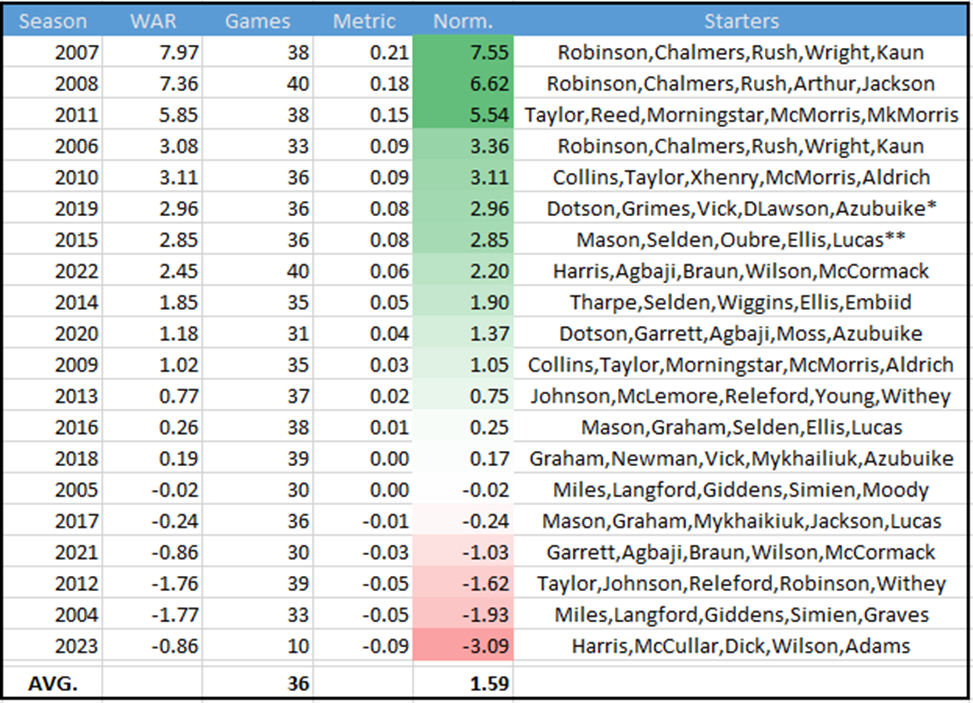
My initial projections on the worst benches were close. The 2023 team has had the worst bench in the last 20 years, however this is only after 10 games. Expect this number to trend closer to 0 as Self continues to be more selective in who he plays. The 2004 team had the second-worst bench. The best bench player that year was a partial-starter in David Padgett. Others off the bench that season were Michael Lee, Bryant Nash, Jeff Hawkins, Christian Moody, and Moulaye Niang. Not a lot of great choices there.
The 2012 team is the team which had the most success while having a negative-value bench. The national runners-up relied heavily on the starting 5. Bench guys like Conner Teahan and Kevin Young provided small, positive WAR, but the others (Tharpe, Wesley, and the walk-ons) caused that number to drop below zero.
On the flip side, both the 2007 and 2008 teams had tremendous benches. The 2008 National Champions played essentially 7 starters. Collins and Kaun had great seasons off the bench and would have been starters almost anywhere else around the country. Even the 8th and 9th men on that team (Rodrick Stewart, Aldrich) added value. 2007 was similar, with Collins coming off the bench. In addition, posts Arthur and Jackson (who would win starting roles that following year) played great as reserves.
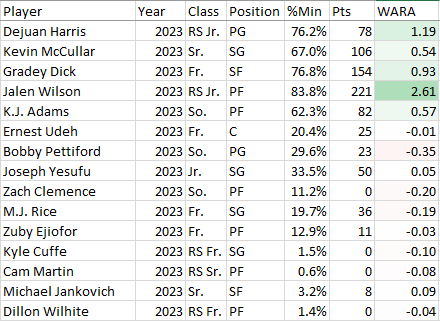
Getting back to 2023. The player with the most value off the bench is Michael Jankovich, who has scored 8 points on 3-4 shooting in 13 minutes. This is a far cry from say, the 2011 bench, which had T-Rob and Mario Little filling in nicely for the Morris twins.
If the 2023 bench doesn’t show signs of improvement, Self will likely rely on his starters even more. K.J. Adams, despite playing out of position, has given KU five consecutive above-bubble performances (and 7/10 this year) as he has settled into a non-traditional 5-man role. Kevin McCullar’s last two games have been his best on the season, and his offense and defense have started to fit in nicely to what KU wants to do. Jalen Wilson, Gradey Dick, and Dejuan Harris have been consistently solid. It’s apparent when any of those guys are off the court, so I expect them to play around 35 minutes each in close games, leaving little time for their backups.
Last, here is the WAR for the 2023 team. The top 5 are starters, below that, the bench:
After a decade plus of irrelevance, Coach Lance Leipold has the 2022 Kansas Jayhawks football team at 6-5, and eligible for a bowl game for the first time since 2008. This achievement occurred a few weeks back when the Hawks won their 6th game of the season against Oklahoma St. Since that time, other teams have become bowl eligible, leading us to examine this question.
For more background, being “bowl eligible” is different from receiving a bowl invite. Being bowl eligible just means you have a 6-win season (in a 12-game schedule). Receiving a bowl invite occurs when a specific bowl invites your team to play in it. Theoretically, a team can be bowl eligible but not make a bowl.
This happens, but not often. There are so many bowls nowadays that most 6-win teams make a bowl. In 2019, the last regular season before COVID, the only bowl-eligible team to not get an invite was 6-6 Toledo. There were 79 bowl-eligible teams for 78 spots, and the Rockets drew the short straw.
Let’s tie this back to Kansas. At 6-5, Kansas is bowl eligible but might finish 6-6 if it loses in its final regular season game. At 6-6, Kansas could theoretically find itself in the same position as 2019 Toledo. But is this a realistic scenario?
Let’s break it down. There are 41 bowl games this season (excluding the National Championship), meaning there will be 82 teams which play in a bowl game from December 16 to January 2. Right now, there are 75 teams which are currently bowl eligible (i.e. have 6+ wins). With 1 week to go*, there are 18 teams which can still become bowl eligible. Two of these teams play each other (Miami OH and Ball State). This gets us to 76 bowl eligible teams. If each of the 16 remaining teams wins, this would mean 92 bowl eligible teams! In this scenario, 10 teams with at least 6 wins would not go to a bowl game.
But this won’t happen. Georgia Tech needs to beat Georgia in Athens, for instance (ESPN gives the Yellow Jackets a 1.3% chance of winning). Even if this upset occurred, other very unlikely events would need to happen (i.e. Vanderbilt over Tennessee, Auburn over Alabama, UTEP over UTSA, etc.).
Using ESPN’s odds of victory for the final week(s), bowl-possible teams are expected to win 6.22 games. Doing some quick math, this means that there are an expected 81.22 teams that will be bowl eligible following the regular season out of 82. Or it is more likely that a 5-win team will receive a bowl invite than a 6-win team will be left home.
But we can go further and sim the final week(s) to see how likely it is that more than 82 teams become bowl eligible. Running 100 sims of the final games, we find it roughly that there are more than 82 bowl-eligible teams only 30% of the time. But most of these instances are exactly 83 teams. Only 10% of the time are there 84 or more bowl-eligible teams. And only 3% of the time do 85 teams or more find themselves with 6+ wins.
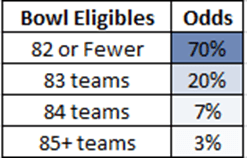
It is in Kansas’ interests for the 5-6 teams playing this weekend to lose. This includes teams like Auburn, Missouri (duh), and Georgia Tech. 70% of the time, Kansas will have nothing to worry about.
But what about the 30% of the time where more than 82 teams earn bowl eligibility? Are the Jayhawks in danger of becoming 2019 Toledo? First note that of the instances where there are more than 82 teams which become bowl eligible, most are with only 1 additional team (83 total teams). Only 10% of the time are there expected to be 2 or more bowl-eligible teams which stay home.
The worst scenario would be a great final week for the bowl-questionable teams. But even in the worst case, Kansas should be able to rest easy. In 2018, there were a total of four bowl-eligible teams which stayed home. This is so unlikely to happen in 2022 that it didn’t make the graph above, occurring only 1 out of 100 sims. But in case it did, let’s look at history. Who were the teams left out in 2018?
Louisiana-Monroe (6-6), Miami OH (6-6), Southern Miss (6-5), Wyoming (6-6). All non-Power-5 schools.
Which 6-6 teams made bowl games that season?
Tulane, BYU, Wake Forest, Minnesota, TCU, Baylor, Vanderbilt, Purdue, Virginia Tech, and Oklahoma State. Mostly Power-5 schools, with a solid Independent and AAC team also qualifying.
Clearly, 6-6 teams are ranked in terms of importance when the bowls decide who to invite and who not to. Even if there are 84, 85, or even 86 bowl-eligible teams; the Kansas Jayhawks will almost certainly get the nod ahead of a 6-6 Louisiana or Southern Miss or Miami OH.
The odds KU doesn’t make a bowl are probably something like 1 in 10,000. Nothing to fret over. KU is going bowling this season.
But not all bowls are equal. The Big 12 has 6 current bowl ties to non-NY6/CFP. The First Responder (University Park, TX), Guaranteed Rate (Phoenix), Liberty (Memphis), Texas (Houston), Cheez-It (Orlando), and Alamo (San Antonio). A Kansas team that went 7-5 (4-5 in conference) would get a better bowl than one than went 6-6 (3-6). As if we needed any other reason to cheer for a win on Saturday.
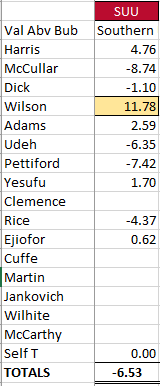
Kansas went to 4-0 in the Norm Roberts era, defeating Southern Utah by 6 in Allen Fieldhouse. Jalen Wilson had a career-high 33 points, producing 11.78 points of value above bubble. This is the best game of any Jayhawk of the season thus-far. Dejuan Harris added 4.76 points of value, with K.J. Adams, Joe Yesufu, and Zuby Ejiofor also adding positive value thanks to solid defense.
On the negative side, Gradey Dick’s defense cut against another solid offensive effort. He scored 18 but gave up 16, which after opponent adjustment became a negative-value game. Still, he hit a big 3 late when it mattered. M.J. Rice had a poor outing, missing all 3 shots he took. Ernest Udeh didn’t score but gave up 7 points, mirroring Bobby Pettiford’s line. Kevin McCullar had the worst game of any Jayhawk.
The TEAM score of -6.53 means a bubble-level team would have been expected to win this game by about 12.53. Hopefully this will be one of the worst games of the year, as KU was lucky to get the win.
Through four games, it’s abundantly clear that this is Jalen Wilson’s team. Both he and Dejuan Harris have improved considerably, carrying the Hawks to wins against Duke and Southern Utah. K.J. Adams and Gradey Dick are adding small amounts of value; Adams on the defensive end and Dick on the offensive side. The other starter, Kevin McCullar, has struggled to fit into the offensive flow.
The bench has been mostly weak, with strong starts by Udeh and Pettiford being wiped away in the past two games. Zuby Ejiofor and Joe Yesufu are adding some value due to their defensive efforts. It’s unlikely that Yesufu in particular will be able to keep up his very strong defense.
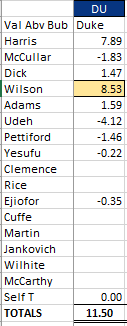
Against Duke, Jalen Wilson produced 8.53 points of value above bubble, which is the highest in a game for a Jayhawk this season. Wilson led the Hawks to victory with his 25 points and 11 rebounds.
Dejuan Harris was the second-most valuable KU player, doing so mostly with his defense. He was credited with 10 official assists, although only 6 were actually value-added according to CtH. The official scorer was generous with assists for some reason. Harris’s defensive presence helped KU win the game, as he gave up only 2 points in nearly 35 minutes of play.
Moving down the list, K.J. Adams and Gradey Dick each had positive games and made big plays late to help seal the win. Of Gradey’s 14 points, 12 were on an assist. Adams didn’t win many defensive possession (exactly 1 rebound, steal and forced turnover each); his value was in only giving up 6 points to Duke.
Joe Yesufu didn’t score but also didn’t get scored on. He had a steal and drew a charge. Zuby Ejiofor grabbed some rebounds and added a lob dunk to play nearly at bubble-level. Bobby Pettiford only scored 2 points with 1 assist. Kevin McCullar scored 12 points but gave up 14. It was his worse defensive outing, even adjusting for opponent quality. Last, Ernest Udeh struggled on both ends. He failed to score but gave up 7 points in his 13 minutes of play.
The TEAM score of 11.50 was KU’s best of the season.
So far through 3 games, KU’s value scores look like this:
As mentioned in the deep dive of Jalen Wilson earlier in the year, it was entertained that Jalen would have to take on so large a role on offense for this team that his defense would decline. This has been the case through 3 games. Harris’s defense has been superb to this point, but his offense is likewise positive despite the limited scoring (7.3 ppg in 30 mpg). His assist numbers are what’s driving his offensive value. Gradey Dick’s offense is outpacing his defense. Kevin McCullar’s defense has been overall solid, with his offense a step behind.
With one game in the books, KU’s list of players looks like this on KenPom:
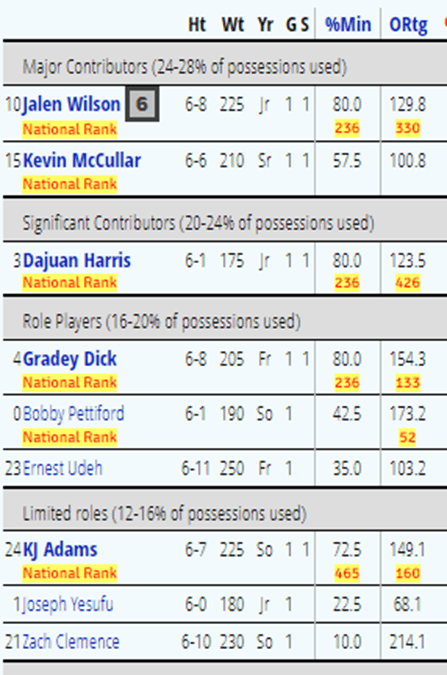
Pretty straightforward. KenPom breaks down players into categories based on their offensive “usage rate.” He also ranks players nationally based on a black-box algorithm. We see that Jalen Wilson is #6 In this national ranking (after one day of play). Again, this makes enough sense. Jalen had 19 points, 11 rebounds, and 7 assists on a very good 129.8 efficiency. So Jalen Wilson should have been the team’s MVP in the Omaha game, correct?
I guess not. This is the KenPom box score from the Omaha game. We clearly see that Gradey Dick is listed as the MVP for this game. And good for him. He had 23 points on 9-13 FGA. This efficiency is certainly very valuable. For what it’s worth, he graded out as CtH’s MVP for this game as well.
But it doesn’t take a skilled logician to see that there is a disconnect here. If Gradey Dick was the team’s MVP for the one and only game so far, this means that he’s been the team’s most valuable player for the entire season. So why is he not listed above Jalen Wilson (who is said to be #6 nationally)? Note that anyone without a number has a ranking outside the top 10. This just doesn’t follow:
Here’s what Ken has to say about his Player of the Year ranking:
The kPOY is not meant to predict who will win the Naismith or Wooden awards. This is a standalone honor designed to identify the most valuable player in the game, free of reputation, future potential, or amount of times the player appears on Big Monday. I’ll track the candidates every week until tourney time, and then we’ll have a season-ending awards ceremony two days after the title game. (Yes, the kPOY will be the one award that includes NCAA tournament play. About time.) [Emphasis added].
If Ken were projecting player of the year, then it might make sense for a returnee like Jalen Wilson to have some pre-built weighting his kPOY score. But according to his own words, Pomeroy is calculating the best players only of games actually played. So what gives? Why does he have Dick > Wilson in the game box score, but Wilson > Dick for the season to this point?
My guess is that the algorithm heavily weights usage rate. Expanding a bit on the initial image, let’s see the actual usage rates for KU players after one game:
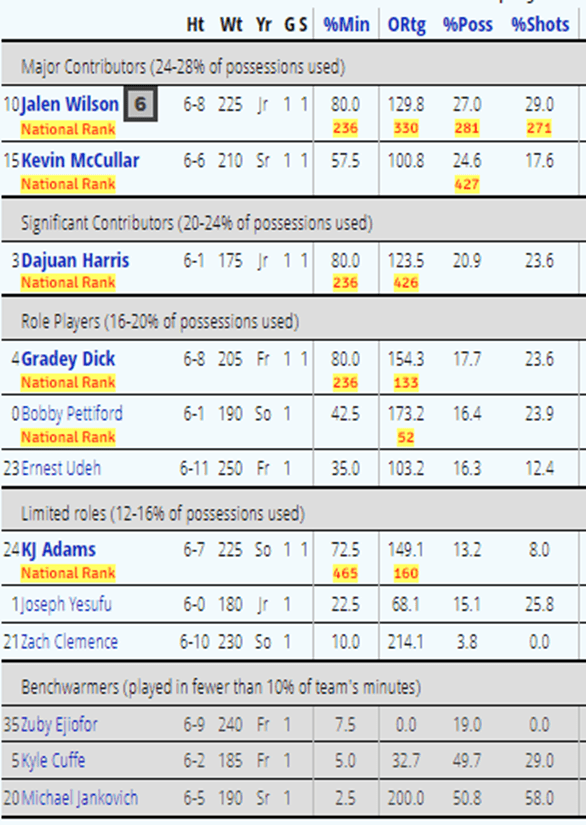
There are actually two usage rates Pomeroy calculates. The first, listed as %Poss, looks at the percentage of possessions a player uses while on the court (with 20% being mean, obviously). %Shots looks only at the number of shots that player takes. These numbers can differ somewhat, depending on assists, turnovers, and offensive rebounds. Gradey Dick’s %Poss usage is much lower than his %Shots usage, likely because he only had 1 offensive rebound, 1 turnover, and 1 assist. In contrast, Jalen Wilson had 1 offensive rebound, 2 turnovers, and 7 assists. He was involved in more plays, thus the higher %Poss number.
This still doesn’t justify the inconsistency. There are arguments to be made whether or not Gradey or Jalen had the best game Monday night. Matt Tait went with Jalen.
As mentioned prior, CtH had Gradey Dick as the best Jayhawk. The one caveat is that CtH has additional defensive stats that Pomeroy and Tait don’t capture. We don’t blame them for that. It should be added that defensive metrics take longer to normalize. So, if you just look at our offensive value stats, you’ll get a decent idea of who played the best per box score numbers. We have Gradey Dick with +4.95 points of value vs. Jalen Wilson with +4.07 points of offensive value. This isn’t a huge difference, but it adds further confirmation that Gradey was the game MVP.
So why isn’t he the team MVP one game into the season? The only reason must be that Pomeroy uses a different algorithm for the season, and it takes into account usage rate. Because Dick is a “role player” (only using 17.7% of possessions), his very high efficiency and strong production is discounted. This is unfortunate. Usage doesn’t really need to be taken into account, as efficiency and production can be balanced together to give us player value. With more usage, more production will come. It isn’t usage that is important; it is production. Higher efficiencies are possible with less usage, but this will come at a cost (lower production).
I suppose that’s the lesson in all of this. Despite the recent increase in adopting new stats such as usage rate, the most relevant stat in assessing player value is points per game. It encapsulates so much of what the “advanced stats” try to.
As with any value stat, WAR (Wins Above Replacement) is standardized around a certain threshold value. In this case, the replacement is an average D-1 player (or more precisely, a player who provides neutral value for the average D-1 team). WAR is good because it allows us to quantify experience, and specifically experience weighted toward winning games.
WAR is cumulative, so with more games and more playing time, a solid player will build up his WAR over the course of his career. It was surprising to calculate Career WAR for the 2023 team and see this list:
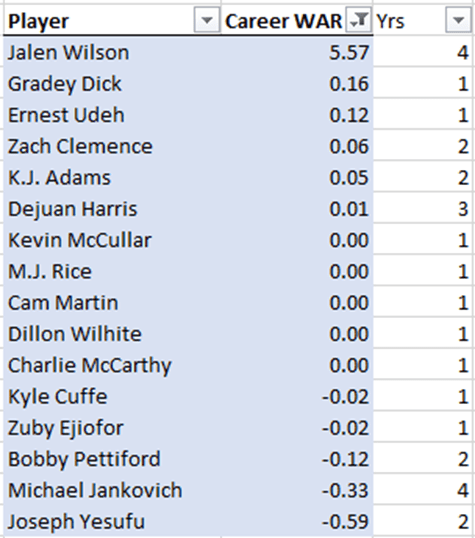
Yes, Gradey Dick has the second-most Wins Above Replacement of any current Jayhawk despite having played in only 1 official game. Note that the following have also only played one (or zero) game(s): Udeh, McCullar, Rice, Martin, Wilhite, McCarthy, Cuffe, Ejiofor. But this still leaves us with the following list of players: Clemence, Adams, Harris, Pettiford, Jankovich who have less career WAR than Dick despite being at Kansas for at least a full season.
The freshmen last season (this year’s sophomores) produced very little in value. The other name, Dejuan Harris, struggled as a freshman and only crossed into positive Career WAR at the end of last season. Expect Harris to trend further positive as the year progresses, but it is unlikely he catches Dick at any point in this season.
Which is to say the following. KU doesn’t have a ton of experience in winning games on the floor. It has past role players and guys that played sparingly, but not a lot of game MVP winners. Kansas came into the 2023 season with its roster having a combined 4.55 WAR over the course of their KU careers. To compare to past seasons, only twice since at least 1995 has there been less combined WAR coming into a season—2006 and 2014. Of course, this ignores Kevin McCullar’s Big 12 experience from his days at Texas Tech. Once that is factored in, he is likely around Jalen Wilson in terms of Career WAR.
A close comp to the 2023 roster is the 2009 roster, which coincidently was also the year following a national championship. KU returned Sherron Collins (who had produced 5.59 Career WAR to that point), along with a handful of other guys. Cole Aldrich only had 0.61 WAR his freshman season (but would generate quite a few wins his next two seasons). There were a number of solid incoming freshmen that year, namely Tyshawn Taylor and the Morris twins. For returnees who would play a bigger role following the roster turnover from the prior season, you had Brady Morningstar and Tyrel Reed.
There’s a small correlation between experience (in terms of Career WAR) and NCAA Tournament success for past KU teams. Seasons like 2008 point to experience = success, however 2005 and 2010 teams had comparatively similar experience but still lost in the first weekend. On the other side, the 2012 and 2018 teams had less incoming WAR than the average KU team does yet each managed to make the Final Four. The 2022 team was somewhere in the middle.
