More on the Bench

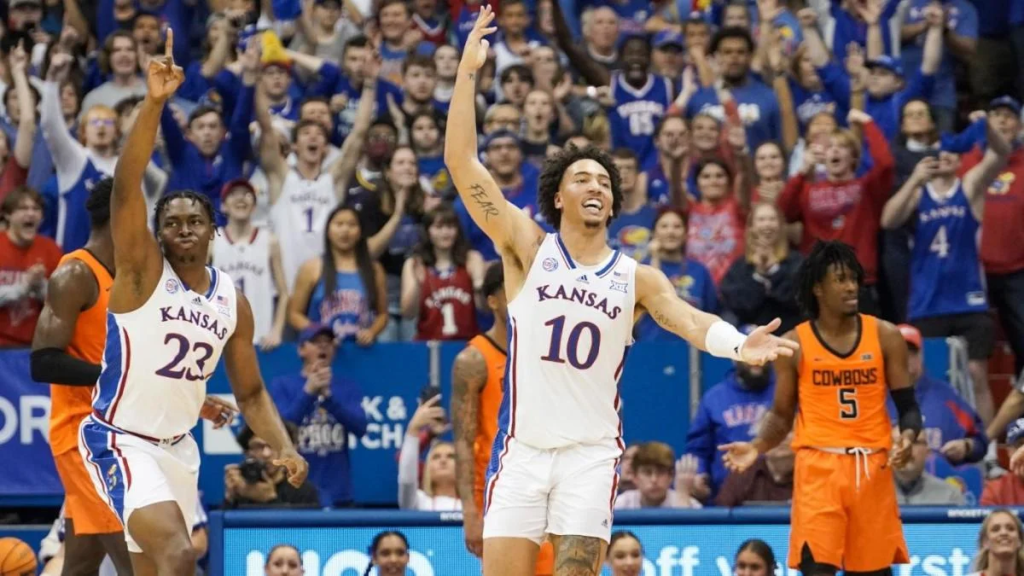
While KU continues to win close games, it is in spite of its bench players. This phenomenon was discussed earlier in the season, and the discrepancy between its starters and bench has remained. Self has continued to play Bobby Pettiford and Joseph Yesufu as reserve guards, with an oft-injured M.J. Rice having not playing in the last three games. Zuby Ejiofor has been KU’s most-frequently-used bench big man in conference play (27 minutes), followed by Zach Clemence (21 minutes) and Cam Martin (6 minutes). Ernest Udeh has played in only 1 second of conference play. Yes, just 1 second. This came at the end of the Oklahoma State game when he was guarding the inbounds pass.

Since the last time we examined their performance, the KU bench has hardly changed in overall value it provides. After 10 games, the bench was positioned to earn about -3.00 WAR over a normalized 36-game schedule. With 17 games in the book, this has hardly budged. The 2023 bench is still the worst bench in the 20-year Self-era, and with no signs of improvement would be only the 6th bench to produce negative-WAR value over that time span.

One thing to consider is that there is a sort of floor to this number. The worse the bench plays, the less Self will go to it. Through 5 conference games, the starters have averaged 32.5 minutes per game each. This is Self maxing out starter-minutes. He cannot play them much more, considering foul trouble will occur at times and fatigue will set in. With limited bench minutes, two things should keep the number somewhat afloat. First, the bench has less collective time on the floor to perform poorly. Second, in limited minutes the bench players should have the energy to play each defensive possession 100%. The bench should be giving maximum effort when they are out there, thus maximizing their potential value on a possession basis.

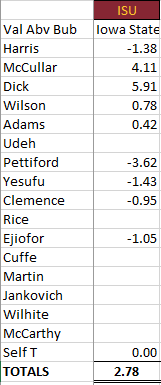
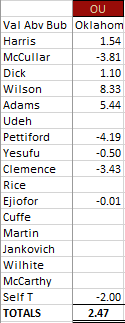
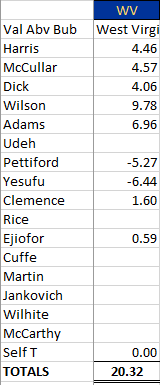
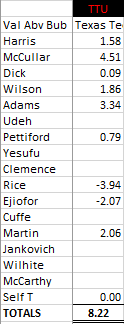
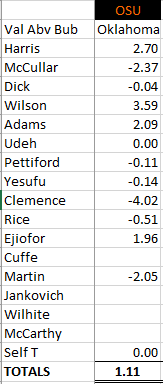
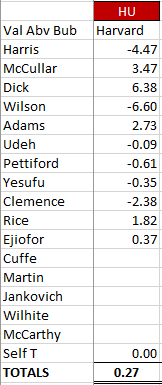
There are various ways to quantify the dreadfulness of the bench rotation. We have used the WAR value metric to compare the 2023 bench to others in the Self-era. Now we will compare the 2023 starters – Harris, McCullar, Dick, Wilson, and Adams – to the remainder of the team using Adj. Points AB +/-. This metric compares a player’s value, in points relative to a bubble-level opponent (about the 45th best team in D-1). Anything positive is quite good and should earn the player rotation minutes, with anything greater than +2.00 indicating a performance level that would start on almost any KU team.

The following numbers are thus presented per game, collectively divided between starters and bench.

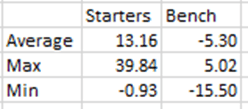
The starting 5 produces an average difference of 13.16 points above a bubble team per game. They have been tremendous. This year’s starters have collectively out-done last season’s starting 5, which were +10.83 points above bubble per game. For the Missouri game, the starters were an absurd +39.84. They have only been below bubble-level as a group twice this season, first against Omaha (which was technically their worst opponent-adjusted performance) and second against Tennessee. Even then, these games were barely below the 0 threshold.

In contrast, the bench has played to a bubble-standard in only four games (23.5% of games). Ironically, its best game was against Omaha with a +5.02 performance, which is also the only time it has outperformed the starting 5. Its worst outing was against Southern Utah, in a game that was only close because of the reserves. Worse, the bench is trending downward. It hasn’t produced a positive outing since the Indiana game. Last season, on a team that featured seniors like Mitch Lightfoot, Jalen Coleman-Lands, and of course Remy Martin off the bench; it was collectively -0.52 and produced 17 games above bubble-standard (42.5%). This number was much higher at the end of the season when it counted, as the bench collectively produced an average game of +5.53 in the 9 games that made up the 2 tournaments. This was due to the great play of Remy, as well as a shortened rotation that played the senior reserves far more than the underclass backups. Suffice to say, the 2023 team doesn’t currently have that kind of fire-power waiting in the wings. It has underclassmen and transfers, none of whom have proven any capacity to be consistently great at the upper echelons of the D1 level.

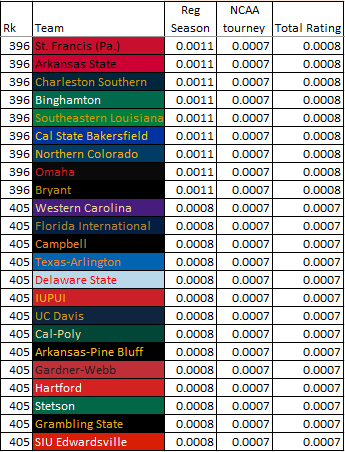
Having a poor bench is no reason to despair. History has shown that teams with great starters can win in the Tournament despite having little help from its reserves. The 2012 runners-up had a very similar divide between a strong starting 5 and weak bench. However, even the 2012 bench had experience; Kevin Young was a redshirt junior and Conner Teahan a fifth-year senior. The 2016 team is another good comparison. It earned the number-one overall seed and made an Elite 8 on the backs of its experienced starters, getting little from its bench.

There are a few potential bright spots to consider when pondering the bench situation. First, is that KU has talented young players on its roster. It really only takes the development of one or two of the following by March for this situation to drastically improve: Pettiford, Yesufu, Rice, Ejiofor, Udeh, Clemence. If KU can comfortably play any of these guys 10 minutes or so and expect a consistent performance, it can better maintain leads that its starting 5 works to build. The second consideration doesn’t have to do with the bench, but with the makeup of the starting 5. The starters are all capable of playing a heavy-load, thus reducing the negative-impact the bench has collectively brought. K.J. Adams is far more like a wing than a post in terms of fitness and durability, meaning that even the 5-spot needs fewer bench minutes this season than it historically does.

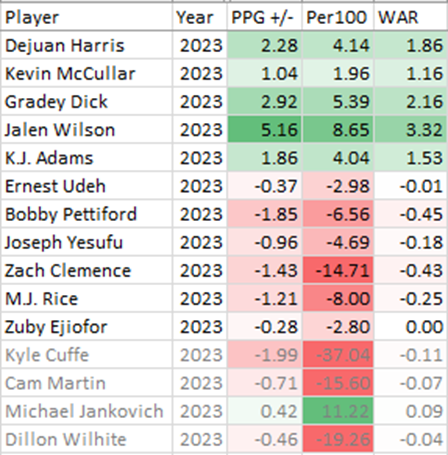
Lastly, where should the team go from here? In comparing Per 100 points above bubble, there is good reason to like the potential development of Udeh and Ejiofor. These two have clearly been superior to other bench-players, particularly the other 5 men. While Ejiofor has gotten in games consistently, Udeh has been relegated to DNPs of late. Perhaps this should be reexamined, particularly if Clemence continues to defend at a poor level.

There hasn’t been much value from the reserve guards/wings. Injuries have plagued all four (with Cuffe still out), and even when healthy none have provided consistent value. The team loses scoring ability, size, and defensive skill when it goes to the bench and gains little. Shifting K.J. down to the 4 when Jalen is out is honestly a worthy consideration.

Kansas 62, Iowa State 60

Gradey Dick and Kevin McCullar were KU’s best players against the Cyclones. K.J. Adams, who had the winning basket as part of 15 points and Jalen Wilson, who finished with 16 points, had poor defensive showings overall. Still, K.J. has now ran off 11 consecutive positive-value games, a team record for this season.

The bench was again abysmal, this time combining to produce -7.05 points against bubble. Only once, the Nebraska-Omaha game, has the bench collectively produced more value points than the starting 5. And through 17 games this season, only 4 times (Omaha, NDSU, Texas Southern, Indiana) has the bench been above-bubble (reminder, this is an opponent-adjusted number).

Kansas 79, Oklahoma 75

Jalen Wilson’s defense graded out so well it earned him his 8th team-MVP game of the season. Wilson’s defense has been especially solid the last two games despite poor shooting performances. Once again, KU’s starters carried the load, as its bench was collectively 8 points worse than a bubble-team against OU. Zach Clemence had a great offensive night that was cancelled out by a poor defensive showing. Bobby Pettiford gave up a few baskets as well, while producing only 1 FT and 2 assists.

K.J. Adams had his 10th consecutive positive-bubble game thanks to a career-high 22 points. His rebounding was still the thing holding him back. Thus far, we have him with 54 fewer defensive boards than Jalen Wilson. When broken down by playing time, Wilson is nearly doubling him up on defensive rebounds on a per-minute or per-possession basis. The point is that if K.J. could clean the glass a bit more, he’d be adding even more value. Despite this limitation, he’s been great for Kansas.

College Football Program Ratings (1869-2024)

Examining Historic Conference Strength

Determining the CFP Field

Above are the College Football Program ratings for the 233 programs which have either finished as a ranked team or made it to one FBS bowl game during one of the 155 seasons of college football. The logic behind this rating system is to quantify college football’s unique competition format, which has historically been to decide the best teams in the sport through polls and post-season bowl games. Points are awarded to teams in the final polls of the season on a declining method (#8 earns more points than #9 and so on). Bowl games are tiered based on prestige and quality of opponent, with the bowl winner receiving more bowl “points” than the loser (bowl appearances still net a program some points).

The Total Rank column is the central number which combines all relevant data for a certain program, with the highest possible score being 1.0000. Alabama is thus the #1 college football program with a score just below 1.0000. Its 42 bowl wins and 70 bowl appearances top the sport, and it has made 9 college football championship games in the BCS/CFP era, winning 6 times. Regarding postseason play, none comes close to Alabama.

The regular season component of this ranking, based on final poll results, sees Michigan in first, followed closely by Notre Dame and Alabama. The official polls began in the 1930’s, and served as the decider for national championships for much of the sport’s history. Retroactive national championships through various ranking services have also been used in determining the better programs in the earlier years of college football. Additionally, computer-derived rankings were used to rank teams from years 1934 and prior.

The history of college football is also the history of America. The first ever game was between Rutgers and Princeton in 1869. Beginning in the Northeastern United States, college football was dominated by Ivy-league teams (specifically Harvard, Princeton, and Yale) for much of the first four decades of the sport. The sport began to spread westward, with programs around the Great Lakes in the Upper-Midwest beginning to become more and more competitive. Michigan won its first National Championship portion in 1901. The University of Chicago was also a power in this era, winning National Championship portions in 1905 and 1913.

The sport would continue to spread west, and south, as the years progressed. Our top-rated-overall program, Alabama, didn’t receive voting points until 1924 (the computer ranking placed them at #18 in 1924), and were named the National Champions of 1925 by the Helms Foundation among other rating systems. Dartmouth, the best in the Northeast that season, was the nation’s best according to other raters. During the World Wars, military instillations (i.e., El Toro Marines) sprang up with solid football programs which were able to compete with the best schools of that era, earning ranking points in the process. Since then, traditional football powers have emerged, with most being large public institutions with large fan-bases and plenty of money. The story of America’s history intertwines with the sport of college football.

This is as good a time to discuss national championships as any other. College football national championships have been decided in at least 6 distinct ways. The first way was through a variety of retroactive rating services. The services didn’t often agree, leading to a number of seasons with joint national champions. As poll ranking teams during the season began to emerge, the national champion ended up being whoever was ranked first at the end of the season. What is noteworthy is that this champion used to be decided before the bowl season, so there are multiple programs claiming national championships for seasons in which they still lost their bowl. There were still many split national championships during this time as different polls had different opinions on who was best.

The third era of deciding a national champion began in 1968, when the AP poll began voting after the bowl games to determine the nation’s best. Still, with traditional bowl affiliations often preventing the regular season’s best teams from facing off, split-championships continued to happen. In 1991, Miami (Fla.) and Washington were both voted #1 (by the AP and Coaches, respectively). With the desire to crown one true champion becoming a central focus, the sport began the process of entering its fourth era that next season.

The Bowl Coalition would begin the next season. This was a coalition between the top bowl games (Cotton, Orange, Sugar, and Fiesta) that would agree to place the 2 top-ranked teams against one another in one of their bowls, creating a de facto national championship game. The flaw in the system was that the Rose Bowl didn’t agree to participate, and would still take the Big 10 and Pac 10 champs regardless. The Bowl Coalition lasted 3 seasons, and was replaced by the Bowl Alliance which did the same thing. The 1997 season saw a true split-national championship, as Nebraska and Michigan both winning the #1 poll spot in a major poll.

The fourth era therefore officially begins with the Bowl Championship Series (BCS) era. At this point, the Rose Bowl joined the system. Through the BCS, college football would now place #1 and #2 in the national championship game each season. This system wasn’t without controversy, primarily in 2003 when AP #1 USC was left out of the BCS National Championship game in favor of LSU and Oklahoma. When the AP voters left USC as the nation’s best in their poll, the sport saw the very thing it wanted to avoid most–a split-national championship.

This didn’t happen again in the BCS-era, yet still controversy remained. People disliked the convoluted formulas which determined a team’s ranking (which was why #1 AP USC was left out of the 2003 championship game, their computer scores were below that of LSU and OU). Furthermore, many in the sport felt there were too many teams left out of having a chance to win a national championship. With only the top 2 teams getting to play in the BCS Championship game, this left very good teams (such as #3 and #4 overall) playing in consolation games.

In 2014, the CFP-era was born. This is the fifth era of college football, as the College Football Playoff would decide a champion. While the BCS was technically a (2-team) playoff, the CFP introduced a 4-team, expanded playoff system that allowed for twice as many teams to have a chance in the postseason. The formula-driven, BCS system for ranking teams was done away with and replaced through a committee approach. #1 plays #4 in one semifinal game, #2 plays #3 in the other. Then then winners of each game face off for the National Championship.

This season the CFP will expand to 12 teams, introducing yet another era in the sport. 8-seed Ohio State would have been left out a season ago, but the Buckeyes proved their mettle in the postseason to claim the program’s 6.5th championship. This is an odd way to count national championships, so let’s discuss how national championships are handled in this rating system.

The rating system works thusly: a program earns rating “points” that go either toward its regular season (polling) rank or its postseason (bowl/playoff) rank. So, if a team won a National Championship before the BCS-era, the program rating points would go in its polling score. And in the more-recent eras of college football, winning a National Championship earns the school rating points in its bowl/playoff score.

Since there are 155 seasons of college football, there must be 155 national championships to award. It is following this logic that the concept of “National Championship Shares” is introduced. Think in terms of currency, where a National Championship share is money. Basically, each season = 1 National Championship. In years which there is a reasonably-disputed National Championship (sorry 2017 UCF), this 1 National Championship gets split among the teams with a reasonable claim to the Title. In many seasons, this would mean two teams each getting 0.5 NCS. However, in earlier eras, this might mean one team getting 0.5 NCS, whereas two others get 0.3 and 0.2.

The far right column, labeled NC’s, lists these shares by program. It will almost certainly be different from that program’s claimed National Championships. The best program, Alabama, has 11.9 NCS. This is actually third behind Yale (17.2) and Princeton (14.8). While Alabama is below those programs in NCS, it is above them in overall rank. The Ivies are no longer in the upper echelon of college football (FBS), and are therefore stuck-in-place as it were, not earning any additional rating points yet still in the rankings as a relic of a distant era of the sport.

The Kansas Jayhawks football program checks in at #68. It is one of the lower-ranked Power-5 programs, but is still ahead of a P5 teams (including Virginia, Iowa St., Wake Forest, and Vanderbilt). KU’s mere 14 bowl appearances have hurt it given how frequently other programs tend to go. Not going to a bowl game for 14 seasons has been rough on the program. Take a program like #50 Purdue, which has 21 bowl appearances. The Boilermakers, though not great, have been more consistent in their history.

To compare two programs, simply divide one program’s Total Rank score by the other’s. This allows us to quantify the difference between the two programs in a multiplicative way. The following are a few selected comparisons between KU and some other programs of note. For any score below, 1.0000, KU is worse and for any score above 1.0000, KU is the better program. The inverse of these numbers will compare how much better (or worse) that team is compared to KU.

KU is 0.6346 of Kansas State.

KU is 0.4285 of Missouri

KU is 0.1256 of Nebraska

KU is 1.4564 of Iowa State

KU is 2.4065 of Vanderbilt (worst-rated P5 school)

KU is 109.3537 of Louisiana-Monroe (worst-team to have made a bowl)

Historically Kansas has not been a great football program, but it should still see itself as better than where it is. Note that, despite having a winning record all-time against Kansas State, the Jayhawks are only 64% as successful when it comes to being ranked in the polls and going to/winning bowl games.

The fall of the Nebraska Cornhuskers is noteworthy. As recently as 2007, Nebraska was ranked #1 in this system. The Huskers had won proto-BCS national championships in 1994 and 1995 (and split in 1997), producing for itself a lead in bowl “points.” In other words, it had won the highest number of prestigious bowls in the history of the sport; bowls that actually were a huge factor in determining national champions. But, since that time, in the BCS and CFP era, they’ve been passed by teams that have won more high-tier BCS/NY6 bowls and those that have been BCS/CFP National Champs.

Oklahoma was briefly #1, in the three seasons from 2008-2010, before Alabama took control after 2011. The Sooners haven’t been bad in the past 12+ seasons; Alabama has been that good.

A strange interplay between programs with strong polling history (Michigan, Notre Dame) and the rest of the top-level teams has also taken place. In 2007, Michigan was #7 and Notre Dame #13. Today, they sit at #4 and #7 despite neither having won a National Championship in that time. This comes at the expense of programs like Texas and Miami (Fla.), programs which have dropped out of the Top-10 over the past 15 years.

Basically, Michigan and Notre Dame have improved by maintaining a strong polling score while the bowl/postseason score becomes worse for everyone not named Alabama (and Ohio State). The current rankings reflect 2 huge areas of value. First and foremost, how frequently can you win National Championships (then appear in them, then make the top 4, then make the NY6)? Secondly, how strong is your program’s poll history? Being consistently highly ranked 100 years ago is just as important as being consistently highly ranked today.

In closing, this rating system contains a logic behind it that captures the uniqueness of college football and rates programs so that they can be compared against one another. As the sport of college football continues to change, the rating will be altered to ensure it fits with the time, while still maintaining the illustrious history and eras of the sport.

Line Team Rating
1Alabama20.26
” 1Alabama20.26 1Alabama20.26

Kansas 76, West Virginia 62

Jalen Wilson’s stingy defense won him his 7th game-MVP of the season. It was also his best individual game since the Missouri game. The other starters all performed very well.

The bench guards Pettiford and Yesufu gave up too many points on defense. Backup 5-men, Ejiofor and Clemence, had positive games in their limited minutes. For Clemence, he scored his first points of the season on an assisted layup in the second half.

Kansas 75, Texas Tech 72

An odd game from a value-score standpoint, Kevin McCullar grades out as KU’s best player thanks to his stingy defense. Although he had a poor offensive showing, guys like Dejuan Harris and K.J. Adams stepped up for 18 and 14 respectively. McCullar was responsible for allowing only 3 points, earning him his third team-MVP game of the season (tied for second, with Gradey Dick).

College Basketball Program Ratings (1896-2025)

There have been 130 seasons of college basketball. This table attempts to rate the hundreds of programs that have competed in the sport over the years in an unbiased, objective manner. The rating system looks at the entire history of the sport, including its pre-NCAA Tourney days, in a consistent way that accounts for all the various eras of college basketball. When examining NCAA Tournament results, national championships are given their true weight with each successive round in the bracket being twice as valuable as the previous.

The Rating is thus cumulative. In each season, teams are awarded rating points based on a variety of categories. After 130 seasons, we accumulate the total rating points of each category and set the highest score as a baseline of 1. Each subsequent score is in proportion that baseline mark.

The Total Rating is the value on the far right, and it is this rating by which teams are sorted. Kentucky is college basketball’s best program with a score of 0.9995 (out of a possible 1.0000). The Total Rating is a weighted combination of both Regular Season and NCAA Tournament achievement, with the NCAA getting the stronger weight. We will now examine each rating portion in order.

Regular Season

The Regular Season score column rates each program’s success as it pertains only to the regular season, which for our purposes refers to any and all games that aren’t NCAA Tournament games. Although its called Regular Season, it implicitly includes conference tournament results. Implicit is the key term, because the Regular Season score is not directly any calculation of wins, win-loss percentage, or even other achievements such as conference championships. Rather, the Regular Season score is built based on NCAA Tournament seeding.

Seeding occurs at the conclusion of regular season play, and is thus the best judgment of how well a team performed to that point. Other results such as record or total wins or championships is schedule-dependent. A team which played a tough schedule will have a worse record than if it had played an easier schedule. The selection committee, although not perfect, takes this into account when selecting/seeding the 68 teams. Similarly, conference championships are dependent on the teams’ specific conferences. An easier conference is easier to win.

But teams with solid records and teams that win conference championships will be rewarded for these accomplishments through appropriate seeds in the bracket. It is the seed-line a team receives which determines how many rating points it gets for the Regular Season. Non-NCAA Tournament teams receive no rating points that season.

Allocating rating points is very important, as it must be done in proportionate value. How valuable is a 1-seed? Well, the question must be asked with regards to other seed-lines. A team earning 1-seed should receive more value points than a team earning a 2-seed, and the same with a 2-seed team when compared to a 3-seed team. But how much? What are these ratios?

The best way to determine this is to use history. The NCAA Tournament is currently in the 64+ team era, and has been since 1985. In the 39 tournaments from 1985-2024, we have a large series of data which tells us how many expected wins each seed-line has. The table shows the estimated wins per seed line from that period.

The table shows that 1-seeds are expected to win 3.34 games per tournament. This is because they are typically the most talented teams and the easiest path through the bracket. From here, we see that 2-seeds win 2.33 games per tournament, 3-seeds 1.84 games, and so on.

The final column isn’t labeled, but it is also important. This column shows the expected number of weighted wins a seed will achieve in any one Tourney. A weighted win accounts for the fact that later round games are harder to win (because there are fewer of them), and allocates points accordingly. Expected weighted wins looks at how far in the tournament a seed is expected to go, with each successive round achieving double the weight as the prior round. The 16-seed is expected to earn only 1.01 weighted wins because it is expected to make only the Round of 64 99% of the time, as it rarely has made the Round of 32.

Weighted wins are as follows: Make the Round of 64 (i.e., lose in the First Round), earn 1 weighted win. Make the Round of 32 and lose, earn 2 weighted wins. Make the Sweet 16 and lose, earn 4 weighted wins. Elite 8 earns 8. Final 4 earns 16. Finish Second to earn 32. Win the Championship to earn 64.

Weighted wins will show up in a later portion of this methodology. But for now, know that they are used as expected. A team which earns a 4-seed from the committee due to its regular season success will earn 1.56 expected wins in the middle column and 4.93 expected weighted wins in the last column.

The expected-win data presented above is for all Tournaments 1985 and beyond. For seasons before 1985, we use other other numbers based on the bracket at the time. Tournaments from 1979-1984 had 48 teams. From 1953 through 1978, the number of teams fluctuated from 22 to 32. 1951 and 1952 had 16 teams. From 1939 to 1950, there were 8 teams.

Each bracket iteration has win estimates based on the standard of the time, but the estimated number of wins and weighted wins accumulate in the same fashion. The 64-team bracket is set as standard, so a team which made the Tourney in the 16-team era is guaranteed to make the Sweet 16 by virtue of making a more-select field.

Before getting to the NCAA Tournament portion of the rating, we need to first examine years there wasn’t an NCAA Tournament. This includes the seasons from 1896 to 1938, as well as 2020. In the pre-tournament days, conference championships and wins/losses were more important. But without a national ranking system, it is tough to judge these metrics against one another. Thankfully, we have two systems that help.

First is the Helms Athletic Foundation, which retroactively began awarding National Titles beginning in 1943. By the late-90’s, computer rankings were possible so it was the work of Premo and Porretta that provided Top 15, 20 or 25 lists by season starting in 1896. Using these systems, we can award regular season value-points and weighted value-points which translate to expected NCAA Tournament wins. The question to ask is as follows. Had the NCAA Tournament been around, what regular season value would we expect the Helms Foundation champion to receive? What about, say, the #12 team on the Premo-Porretta Power Poll? This is doable as these rankings can track with our understanding of modern seeds. Once careful calculations were made in determining the correct value points, these systems were incorporated so that the first four-plus decades of college basketball could be included in the program ratings.

2020 is an anomalous case, but what happened was that we had an entire regular season and no NCAA Tournament. Although the selection committee didn’t select and seed a field as it should have, we can still reasonable place teams in a hypothetical bracket. Even Ken Pomeroy did this on his website. After doing this, we treat each program’s expected seed-line and award it expected wins and expected weighted wins. That way, the best teams in the 2020 regular season can receive their due value-points.

NCAA Tourney

The NCAA Tournament score column is actually calculated in a similar way to the Regular Season score. However, instead of expected wins and expected weighted wins, we simply use actual wins and actual weighted wins.

One important note is that each tournament is patterned to the 64-team field for uniformity purposes. A team which makes the Elite 8 when there were only 32 teams is not penalized for not having to play in the Round of 64, for instance. But this means that official tournament wins aren’t used, instead we make an adjustment to account for seasons where teams effectively got “byes” to the later rounds.

Concluding Thoughts

When examining this list, note that there are non D-1 programs and defunct programs. They are part of the history of college basketball, but aren’t likely to move up unless something changes and they return to the highest level of collegiate play. I’ll close with some trivia. The first list is something you don’t want to be on, but the theme is “the best program to never ___.” These refer to current D-1 teams, with historic teams in parentheses.

The best to never win a National Championship: #14 Purdue

The best to never make a Championship Game: #21 Notre Dame

The best to never make a Final Four: #45 Missouri

The best to never make an Elite Eight: #88 Texas A&M

The best to never make the Sweet 16: #114 Bucknell (historically: #100 Allegheny [non-D1])

The best to never make the Round of 32: #120 Nebraska (historically: #100 Allegheny [non-D1])

Nebraska is also the only Power-6 team to have never made it past the Round of 64. The Cornhuskers are 120th on the list thanks to a surprisingly decent pre-1939 basketball history. In the tournament-era they’ve been far less fortunate, having gone 0-8 in the Round of 64. In those 7 appearances, they’ve been as high as a 3-seed yet still have never won a game. Given their cumulative seeds in those Tourneys, we’d expect them to have 6.84 wins.

UCLA’s 11-1 record in the National Championship game is amazing, and Connecticut is a perfect 6-0 when playing for a Title. Conversely, Ohio State is 1-4 in the Title Game. The worst program with a National Title is Loyola Chicago, ranking 86th in this rating system. CCNY, the 1950 champion, is the only champion no longer D-1 (it is currently D-3) and sits at 78th thanks to a strong pre-NCAA Tournament program history. Louisville, which still checks in at #12, is the only school which had a title vacated. It has 2 official NC’s after losing its 2013 banner. The best program not in a Power-5 conference (Big 10, Big 12, ACC, SEC, Big East) is #34 San Francisco, edging out Gonzaga by 1 spot. The Dons have 2 titles in their history (1955, 1956) but have not won an NCAA Tournament game or got past the Round of 64 since 1979.

The rating system is set up to compare any two programs in terms of a multiple. Simply divide one program’s Total Rating score against another to see (in terms of a multiple) how much better (or worse) one is than the other. Let’s look at a few examples (as of end of season 2023):

Kansas is 2.81x better than Kansas State

Kansas is 3.07x better than Texas

Kansas is 4.88x better than Missouri

Kansas is 6.86x better than Iowa State

North Carolina is 1.17x better than Duke

Indiana is 1.43x better than Purdue

UCLA is 2.46x better than Arizona

Kentucky is 2.69x better than Louisville

Kentucky is 1,334x better than Grambling State (#1 and #404 ranked programs)