
Earlier drafts are here and here.
For a detailed look at KU’s excellent job of getting late-game defensive stops when the Jayhawks need them, click here.
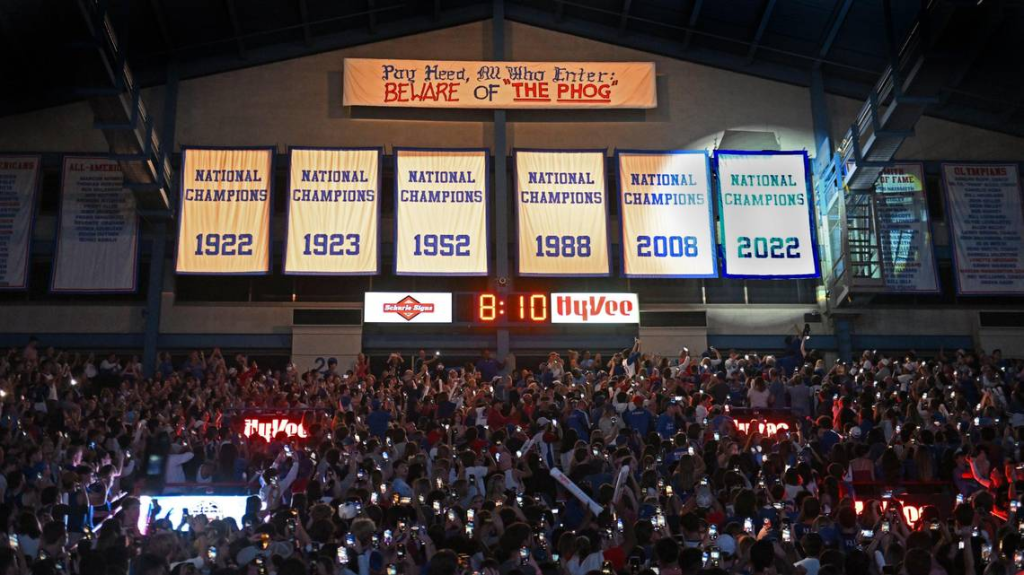
It’s not exactly a secret that KU has a great home-court advantage. Since 2010, the Kansas Jayhawks have gone 227-12 in Allen Fieldhouse (95.0%). In conference play during these 15 seasons, KU’s record is 124-9, a 93.2% winning rate. For reference, in all 2-seed/15-seed match-ups in the NCAA Tournament since 1985, the 2-seed has a winning percentage of 92.8%. If this feels absurd, it’s because it is.
These records are a feature of three different things. First, Kansas has been very good in this span. Here is a list of accomplishments for Kansas in that span:
- 2022 National Champions
- 3 Final Four apperances
- 14/14 seasons1 receiving a 4-seed or better
- 14/14 seasons making the Round of 32 or further (includes ’24)
- 11 Big 12 regular season titles
- 7 Big 12 tournament titles
So, a huge reason for KU’s success has been its strength. It has had consistently great teams.
The second reason KU has been so good at home is due to generic home-court advantage. In college basketball, the median home-court advantage is 2.9 points (according to KenPom)2. Teams play better at home in a quantifiable way, one that will lead them to have more wins than if they faced the same opponents in neutral or true road games. Even if KU played home games at just an average gym, by virtue of it being the home arena, KU would have some advantage.
But, once we take into account KU’s strength through the years and the generic home-court advantage, we still see that Kansas has won more games in Allen Fieldhouse than expected. For instance, since the beginning of 2010, Kentucky has had 25 losses at Rupp Arena and Duke has had 23 losses at Cameron Indoor. Given that these three programs have, for the most part, also been consistently excellent, that’s quite a gap.
The third reason KU wins so often at home is because of “THE PHOG,” an effect we classify in ALL CAPS in homage to the sign that hangs in the Fieldhouse. And we can show this effect is real.
Utilizing KenPom’s subscription services, we note that it provides pregame estimates for each game since 20103 (which is why we focus on 2010-present and not a different sampling of seasons). These pregame estimates will serve as our main data-points in order to prove that THE PHOG is indeed a magical place.
Pomeroy’s pregame estimates are devised by his algorithm and take into account each team’s relative strengths, the location of the game, and the broader data of all college basketball games to estimate the pregame win probability for each game. What makes this important is that it is neutral to any non-quantifiable factors, such as the mysterious PHOG of Allen Fieldhouse. Even though Allen Fieldhouse is special, Pomeroy’s algorithm treats it as any other gym, and because it does so, we can test to see if the Fieldhouse accounts for more wins than the Pomeroy algorithm predicted.
As we said earlier, KU has played 239 games in Allen Fieldhouse in the 15 seasons from 2010 to 2024. In each of these games, Pomeroy has made a pregame prediction. For instance, against Kansas State last night (March 5, 2024), Pomeroy’s algorithm gave KU a 84.4% chance of winning at the tip. After recording each pregame prediction in a spreadsheet, all we need to do is add up the cumulative estimated wins to see how many wins THE PHOG is worth. After all, we can confidently say that Pomeroy’s algorithm has accounted for KU’s high team strength as well as a generic home-court advantage.
Since 2010, Pomeroy’s pregame predictions have estimated that KU should have won 207.59 games, which is 19.41 games fewer than what KU actually won (227). This comes to 1.29 wins per season. THE PHOG effect is real.
To better show this, we tested to see how likely it was for KU to overachieve its home win total by 19.41 games over this period. Using the KenPom pregame predictions for each of the 239 games, we simulated these home games 10,000 times to see if we could reach 227 wins just by random chance. The results are below:
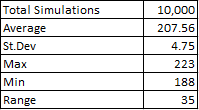
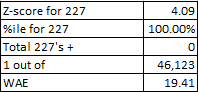
The average number of wins was 207.56, very close to the 207.59 total that was the sum of all KenPom pregame predictions. This shows that the 10,000 simulations was high enough to produce meaningful results. From here, note that the maximum number of wins produced through randomness was 223. Using the dataset of 10,000 simulations, we next show that the z-score for 227 wins is 4.09! or in the 100.00th percentile. A better way of understanding this is that we expect to have 227 wins or better only 1 time out of 46,123. This is further confirmation that THE PHOG is real and all must pay heed.
Betting Odds, A Free Lunch?
Betting on Kansas to win at home has consistently proven to be a winner. Using data going back to 2008, we estimate that if a bettor placed a $10 money-line bet on each home game4 since (276 total games), he’d have $224.81 today. This is a 20.7% annualized return. Additionally, one wouldn’t have gone negative at any time. Only twice in 15 years would this bettor have had a negative profit for that season (2011 & 2018). Betting on Kansas to win in Allen Fieldhouse has been more profitable and safer than the stock market.5
This shouldn’t be possible according to conventional theory. At some point, KU’s home-court advantage should be priced into the market. However, this strategy has only gotten more profitable in recent years. Since 2019, the average season has netted $21.24 (using $10 money line bets), more than the $13.22 average season net since 2008.
The market is likely doing the same thing as KenPom’s algorithm. It prices in the fact KU is usually the better team, and it sees a strong home-court advantage. Still, the market is trying to account for the fact that road teams do occasionally pull the upset but is still falling for seemingly-attractive prices for the road team that nevertheless aren’t equal bets due to how strong THE PHOG is.
Comparing Other Arenas
UPDATED FOR 2025
The fact Allen Fieldhouse continues to produce wins is a testament to its status as the world’s largest home court advantage.
In order to make this study more robust, we’ve begun to look at how much aura there is at other home court arenas. As this takes time to gather the data, so far only the following schools (and arenas) have been examined. These are ranked by z-score. In addition, we list Kansas and Allen Fieldhouse.
| Team | Home Arena | W | L | W% | WAE | z-scr | %ile | WAE/100 |
| Kansas | Allen Fieldhouse | 241 | 15 | 94.1% | 19.19 | 3.85 | 99.99% | 7.50 |
| Purdue | Mackey Arena | 225 | 35 | 86.5% | 12.49 | 2.30 | 98.92% | 4.80 |
| UCLA | Pauley Pavilion | 216 | 47 | 82.1% | 11.60 | 1.97 | 97.57% | 4.41 |
| Iowa State | Hilton Coliseum | 206 | 60 | 77.4% | 8.54 | 1.43 | 92.36% | 3.21 |
| Kentucky | Rupp Arena | 249 | 28 | 89.9% | 7.67 | 1.55 | 93.97% | 2.77 |
| North Carolina | Dean Smith Center6 | 211 | 40 | 84.1% | 4.11 | 0.77 | 77.96% | 1.64 |
| Gonzaga | McCarthy Athletic Center7 | 234 | 18 | 92.9% | 2.08 | 0.33 | 62.79% | 0.50 |
| Duke | Cameron Indoor Stadium | 241 | 24 | 90.9% | 0.75 | 0.19 | 57.36% | 0.28 |
The teams selected are traditionally successful and have home courts which have reputations for being tough venues for opposing teams to win at. As these teams play different schedules and have unique strength-levels, comparing z-scores is the best way to isolate out the effects of the home courts themselves. While venues like Hilton Coliseum and Mackey Arena are quite strong (matching their reputations), none compares to Allen Fieldhouse.
The far-right column normalizes home games played in terms of 100 games. In other words, Allen Fieldhouse is responsible for 7.50 wins per 100 games KU plays there. Contrast this with Cameron Indoor, which has only earned Duke 0.28 wins per 100 games over the last 16 seasons (2010 – 2025).
Update Following 2025 Season
The Kansas Jayhawks did not have the best 2025 regular season, and ended up losing 3 home games for the first time since 2018. This tied the team’s highest number of home losses in the Bill Self era.
Overall, KU went 14-3 in Allen Fieldhouse in the 2025 season, or -0.219 games worse than KenPom expected (looking at his tip-off win percentages). So even though KU underperformed at home this season, it wasn’t by a whole lot.
Including the 2025 data and rerunning the simulations, we see the PHOG effect slip a bit but it is still very pronounced.
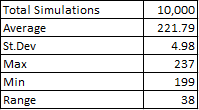
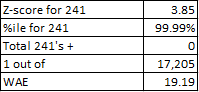
This shows that if you ran 10,000 random scenarios of KU basketball at Allen Fieldhouse since the 2010 season, you’d expect the team to win 237 games at most, and that only 1 time out of 17,205 would you expect KU to win the 241 total games it actually has at the Phog over this period. KU’s total Wins Above Expectation (WAE) is now 19.19, or 1.19 wins per season. So on average the PHOG is worth over 1 win per season when compared to an otherwise good college home court advantage.
Betting in 2025
Going 14-3 at home would have lost the hypothetical bettor taking KU with the money line each game. Had he bet $10 at the start of each game on the money line, he’d have lost $11.73 in the 2025 season. Now he’d still be up $213.08 since 2010 using this strategy.
Had he bet 10% of the pot each time (a strategy that would have turned $100 into $829.63 from 2010 – 2024), he’d have lost 12.3% of his incoming stake during the 2025 season (but would still be at $723.58 at season’s end if he started with $100 in the 2010 season). This would be a 13.17% annualized rate of return.
- The 2020 season was cancelled a few days before Selection Sunday, and no official bracket was released. However, KU was a consensus #1 seed regardless at that point. ↩︎
- KU’s generic home-court advantage on KenPom is 3.8 points, or 31st in D-1. ↩︎
- KenPom users may wonder where the 2010 season’s pregame predictions are as Fan Match only goes back to 2011. However, KenPom’s win probability charts for each game go back to 2010, and we can see what the win probabilities were at tip off. ↩︎
- Some of the buy-games didn’t offer a money-line option, and more recent ones are something like -100000 (meaning you’d have to lay down $10 to win $0.01) ↩︎
- One difference is that you have to keep betting $10 even if you are negative, which makes this strategy inherently riskier than typical diversified stock market investments. An alternate suggestion would be to bet 10% of the portfolio (i.e. start with $100, bet $10, if you win [say $3 back], you have $103 in the portfolio and bet $10.30 for the next game). This strategy, since 2008, gets you to a $829.63 portfolio. This is an annual return of 13.6%. ↩︎
- Since 2010, UNC has also played 2 home games at Carmichael Arena ↩︎
- Since 2010, Gonzaga has played at least 1 home game at Spokane Arena ↩︎

2 thoughts on “Beware of the Phog”