2025 Kansas Jayhawks

The 2025 Kansas Jayhawks finished the season at 21-13 (11-9). Kansas earned a 7-seed before losing in the First Round of the NCAA Tournament. The team’s Sports Reference page is here.

Offense

Defense

Total

Points Above Bubble

Value 4 Ways

Season Write-Ups

2025 Season Preview (10/15/2024)

What Will 2025 Bring (1/2/2025)

Dajuan Harris’s Value in Context (1/31/2025)

Value Splits (2/12/2025)

The Un-Clutch 2025 Jayhawks (3/3/2025)

Grading the NCAA Tournament Committee (3/17/2025)

Season Recap (4/8/2025)

2025 Season Preview

The 2025 Kansas Jayhawk basketball season is underway. Starting this week on Friday, with Late Night in the (recent renovated) Phog, KU basketball will have some sort of contest at least once each week now until either late-March or early-April. KU will have a couple of exhibition contests before officially beginning the regular season on Monday November 4, 2024.

The Kansas roster is set, with KU having 12 healthy scholarship-players available for the 2025 season. Bill Self has said it is likely one player redshirts, and going through the roster we see the likeliest candidate as Jamari McDowell. But for the other 11 players, we have projected the impact we think they will have on the 2025 Kansas Jayhawks.

Group A: The Returnees

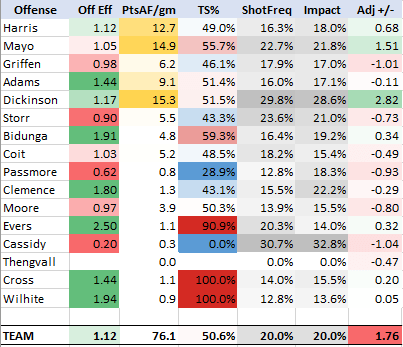
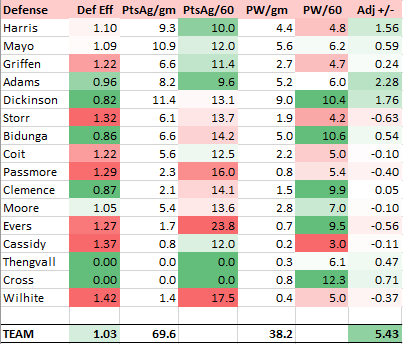
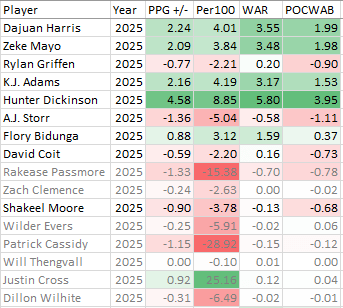
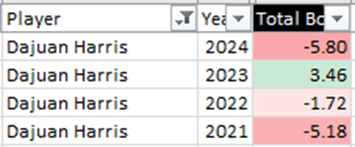
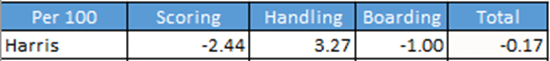
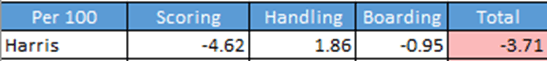
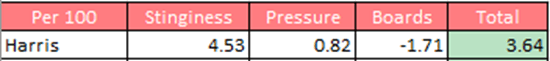
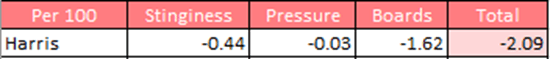
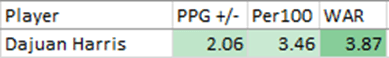
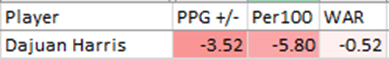
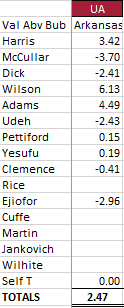
Dajuan Harris PG (C Sr.) Projections: 75% Mins, -0.20o, +1.18d, +0.98 PPGAB, +1.86 Per100, 2.48 WAR

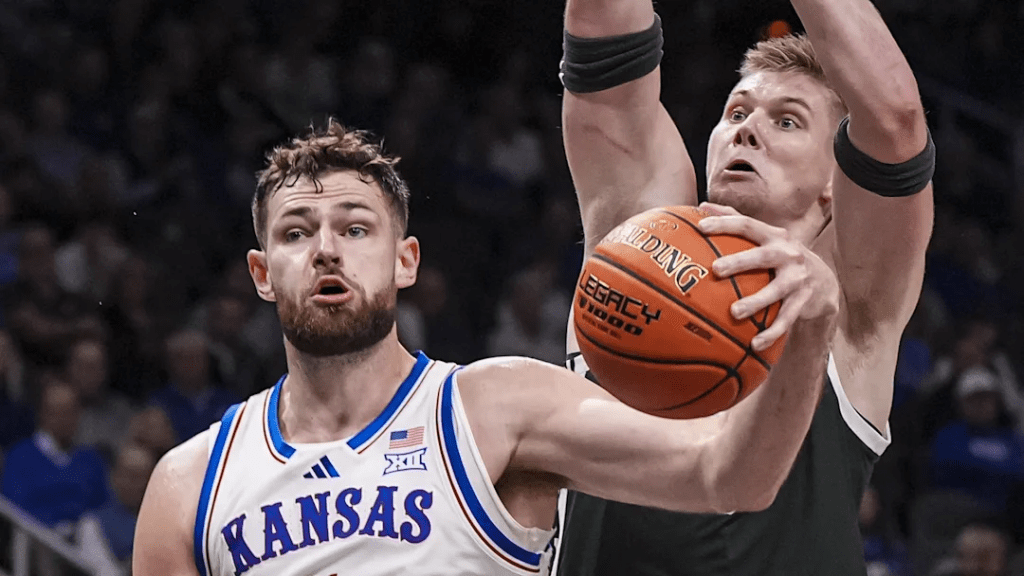
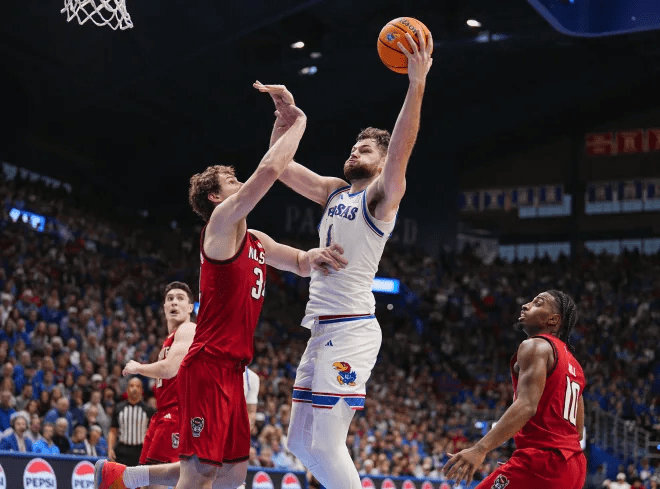
Hunter Dickinson C (C Sr.) Projections: 75% Mins, +3.00o, +1.09d, +4.09 PPGAB, +7.80 Per100, 5.67 WAR

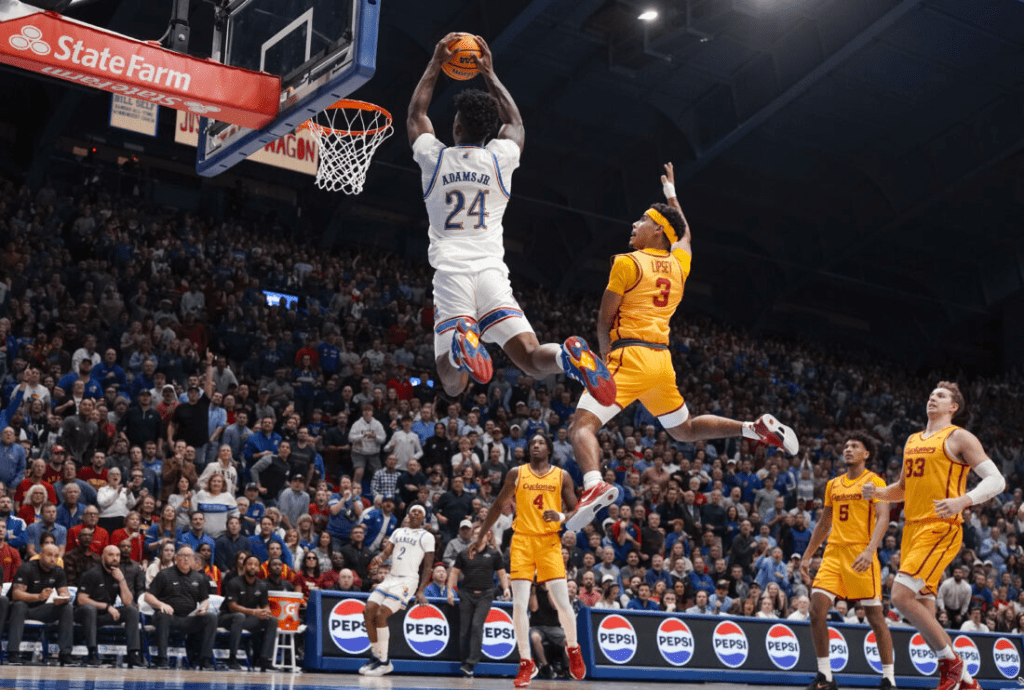
K.J. Adams PF (Sr.) Projections: 75% Mins, +0.50o, +2.01d, +2.51 PPGAB, +4.78 Per100, 4.05 WAR

As a collective, bringing back these three is the best thing that happened in the off-season for Kansas. Continuity is proven to be beneficial in college basketball, and each of these players has proven he can be solid, above-bubble value-adders on both ends of the court. The demise of their talents, presumed upon due to last season’s failures, is greatly exaggerated. The struggles from 2024 were largely due to extremely poor play from the bench and the injury to Kevin McCullar. While Harris, Dickinson, and Adams aren’t without flaws, each is a KU-level starter at his position at worst. Expect these guys to produce.

On to a discussion of their projections. Bill Self stated he planned on playing each fewer than 30 minutes per game. We’ll see if he sticks to those plans. Self is notorious for playing his bench limited minutes, and Dickinson’s minutes last year weren’t any more than he was playing at Michigan. By setting each at 75% of available minutes, we’re putting their loads right at 30 mpg. While there is more depth this season behind this initial trio, it’s just tough to go any lower than this level of playing time. You’re gonna see a lot of Juan, Hunt, and K.J.

As you should. Dickinson in particular is an elite offensive weapon. Should his free throw shooting pop back up into the upper-70’s or so where it belongs (it was 62% last year), he will take care of the only real weakness in his offensive game since coming to Lawrence. Hunt only had two games where he failed to reach double-figures, and aside from those two games he was producing bubble-level or (more-often) better offense each night for Kansas. Such offensive consistency is tough to find. That’s why we think Hunt’s better than a bubble-level center by 3 points per game. Defensively, Dickinson’s rebounding stands out. His kryptonite is on the high-ball screen, and if adjustments aren’t made on how he covers that his defensive number will be lower than our projection.

Dajuan Harris has never been a scorer, but his assists and shooting touch can get him closer to bubble-level on that end. Aside from a shocking start to the season a year ago, Harris as an upper-classman has been a good-enough offensive point guard. Where he justifies starters-minutes is from his defense.

K.J. Adams compliments Dickinson nicely on the floor. It’s commonly spewed out that Adams’ presence somehow clogs things up for Dickinson, but is this the case? Adams is constantly moving on the offensive end. He moves the ball with the pass and attacks with the dribble to either score or serve. The best offense isn’t to put one big guy in the middle and have four “shooters” stand stationary around him, as some lower-IQ fans would think.

Adams will produce around 0.50 points more per game than a bubble-player would, making up for a limited outside shot for extremely athleticism in finishing dunks and rim-runs as well as a nice touch with floaters and solid ability to draw fouls. But like Harris, Adams’ better end of the court is the defensive side, where he is versatile enough to guard anyone 1-5. He matches up best against wings and disrupts opposing offenses by getting in passing lanes, contesting shots, and walling up against potential penetration.

Group B: The Best from the Portal

A.J. Storr SF (Jr.) Projections: 65% Mins, +1.10o, +0.52d, +1.62 PPGAB, +3.57 Per100, 2.94 WAR

Zeke Mayo SG (Sr.) Projections: 65% Mins, +1.30o, +0.43d, +1.73 PPGAB, +3.81 Per100, 3.06 WAR

Rylan Griffen SF (Jr.) Projections: 60% Mins, +0.25o, +0.15d, +0.40 PPGAB, +0.95 Per100, 1.59 WAR

Storr is the class of the portal pick-up in the off-season, and he is certainly KU’s best chance at having an NBA draft pick in 2025. Everyone knows his solid year at Wisconsin a season ago, but we’re tempering expectation given his poor freshman year at St. John’s. A.J. will need to learn to score within a high-powered and multi-functioning Kansas offensive system. He will need to be aggressive at times but be willing to be the second or third option at others…and know when to do which. This may be a bit of an adjustment.

Storr is the Kansas player with the best chance to blow away expectations, ala Ochai Agbaji, Jalen Wilson, or Kevin McCullar their final seasons at KU. We don’t project it, but wouldn’t be surprised if he did play at an All-American level.

But Zeke Mayo is more likely to be the best-performing newcomer Jayhawk for 2025. Mayo is a smooth shooting guard who hit 38% of his 3’s and 87% of his FT’s at South Dakota State. Mayo also has decent rebounding and assist numbers without turning it over too much. He should fit easily into Kansas’ system.

Griffen comes in as another proven shooter, having torched the nets at 39% from downtown last season while playing for Alabama. What is his defense like? Will he be able to expand his game from primarily spot-up shooting? As a junior, Griffen shouldn’t be overwhelmed at Kansas.

Group C: The Rest of the Portal

Shakeel Moore PG (C Sr.) Projections: 30% Mins, -0.25o, +0.21d, -0.04 PPGAB, -0.17 Per100, 0.55 WAR

David Coit PG (Sr.) Projections: 11% Mins, +0.25o, -0.11d, +0.14 PPGAB, +1.76 Per100, 0.36 WAR

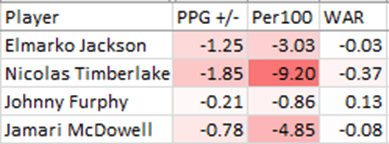
After the loss of Elmarko Jackson to a 12-month + injury, Bill Self was sure to have enough guard depth. He went out in the portal and got two PG’s who play different styles, with Self hoping to hit success with at least one. Shak Moore from Mississippi State is a solid defender with some scoring ability. He is himself injured and recovering to get ready for the season, but once healthy he has the chance to be a bubble-level type player. His counterpart for this back-up PG role is 5’11 David Coit, an offensive-minded player from Northern Illinois. He put up 37 in his final game as a Husky. The projections are for Moore to get more of a nod from Self, particularly against bigger opponents, and for Coit to shoot it well and add value in that way in small bits.

Group D: The Freshmen

Flory Bidunga C (Fr.) Projections: 15% Mins, -0.25o, +0.34d, +0.09 PPGAB, +0.87 Per100, 0.39 WAR

Rakease Passmore SG (Fr.) Projections: 14% Mins, -0.25o, -0.03d, -0.28 PPGAB, -2.87 Per100, -0.01 WAR

The projections were slotted to the player’s recruiting rank given historical precedence at KU. Last season this exercise worked out well when it accurately determined Jamari McDowell’s level of value. Bidunga’s minutes will be limited because he’s backing up Hunter Dickinson. Flory can find his role by hustling and getting easy baskets, contesting shots, and finishing alley-oops.

Passmore’s role will be dependent on how well he adjusts to the college game. He has a bit more of an opportunity because multiple wings can play at once, so he could find more minutes by cutting each of the other wings’ minutes by just a few. We know Self is high on both freshmen, but they are both freshmen and we expect them to be role players in 2025.

Group E: The Return of Clemence

Zach Clemence PF (RS Jr.) Projections: 10% Mins, -0.15o, -0.10d, -0.25 PPGAB, -3.64 Per100, -0.06 WAR

Clemence red-shirted last year and is primed to be a full-roster player for 2025. Zach has improved according to rumors, and these rumors are probably true given that he decided to return to Kansas instead of redshirt. The staff believes he has a role at Kansas, and he brings good size and a good shooting touch. His 2023 season was poor to say the least, and very disappointing given the promise he showed as a freshman in 2022. Clemence’s minutes, along with Bidunga’s and a few others, depend on how well they can do while they’re in the game and Self thinks it’s possible to play two bigs still (it is, but they have to defend the perimeter). Zach’s advantage over Flory is that he can stretch the floor a bit more, and maybe we’ll see both Zach at the 4 and Flory at the 5 when Hunter is resting.
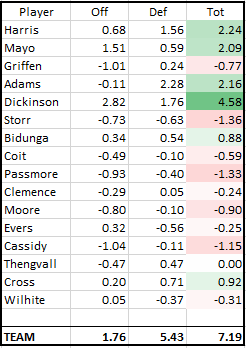
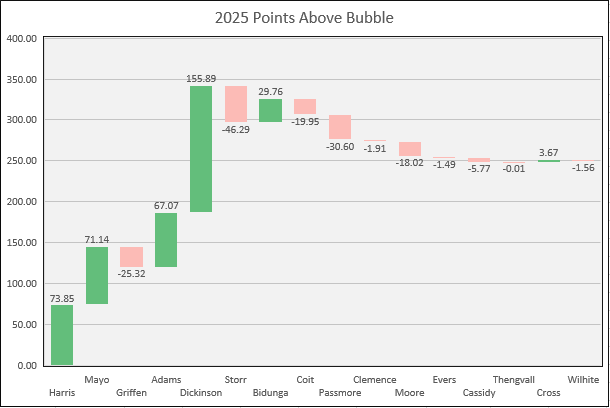
TEAM Projections

+5.15o, +5.32d, +10.47 PPGAB (works out to a 28.96 KenPom rating)

A team with that type of point-differential is a strong candidate for a 1-seed, with a 2-seed or better very likely and a 3-seed about the lowest it’d go. That’s what we predict KU to be. An elite team who will be one of the odds-on favorites when everyone is filling out brackets and putting down closing bets in March. The tournament is tough to predict, so who knows after that. KenPom opens KU at a 24.42 rating, which is noticeably lower than what we see for the Hawks. Torvik isn’t much different at 24.4. Evan Miya has KU at 23.6. About everywhere has KU in the top 10, with the AP voters putting KU as the #1 team.

Let’s hope the season turns out better than the Allen Fieldhouse renovations did.

The Similarities of Dajuan Harris and Russell Robinson

Dajuan Harris, the only Kansas player to publicly confirm he’s be back for the 2025 season (as of 3/28/2024), is a very polarizing player. Some in and around the program have called him “the best pure PG in the country,” while others see his lack of offensive production as a huge hamstring on the Kansas basketball program. Many fans want Harris gone, or at the very least benched, despite Dajuan being a 3-year starter and having a National Championship ring. What gives?

Like most things, the truth lies somewhere in between. Not unlike another one of Self’s favorites that caught some grief, Russell Robinson. Remarkably, both Harris and Robinson have had similar careers.

Here are the two PG’s career stats side-by-side:

  • Games: 134, PPG: 7.1, APG: 3.7, RPG: 2.7, eFG%: 47.5%
  • Games: 140, PPG: 6.4, APG: 4.8, RPG: 1.8, eFG%: 50.0%

Which is which? Russell is listed first, and you do see a difference with the assist (Harris’s stronger attribute) and rebound (Robinson’s stronger attribute) numbers. Russ Rob was a little better scorer but a worse overall shooter.

Other similarities lie in their career-arcs. Neither were starters or heavy contributors as freshmen, but then earned the starting role as sophomores playing alongside better talent. Both retained the starting PG job despite ups-and-downs, and in fact each had disappointing senior seasons when looking at individual stats. Here are the two players’ Per100AB value-stats by season.

  • Frosh: -3.21 Soph: +2.31 Jr.: +0.62 Sr.: -0.29
  • Frosh: -5.18 Soph: -1.72 Jr.: +3.46 Sr.: -0.23

Robinson is listed first again. His sophomore season was his best from a value-metric perspective. Harris’ peak season was his junior year. But by the time they were seniors, their value was just slightly south of bubble-level.

The other important value-stat, Wins Above Replacement, which accumulates an estimated win total above that of a Division 1 player, has each player at exactly +5.47 WAR (as of 3/28/2024). To be so close in WAR over the same career-length is to essentially be the same player from a value-perspective. Since 1993, this places them at the 48th/49th spots in terms of career WAR (out of 185 players).

Looking deeper at their value profiles, we see that defense plays a larger role than offense in each PG’s games. Aside from 2006 when he had a solid season scoring the ball, Russ Rob was always a below-bubble offensive player. His defense, on the other hand, was positive during the years he started. Harris has never had an above-bubble offensive season, although in 2023 he was close, but his defense has been solid for the most part over his last 3 years.

In 2008, Robinson’s senior season, Kansas cut down the nets thanks to great play from a number of talented players. Robinson helped KU win the title that season, but he didn’t carry the team. Kansas did so thanks to the contributions of future NBA-players, especially Mario Chalmers, Brandon Rush, Darrell Arthur, Darnell Jackson, Sherron Collins, and Sasha Kaun.

Similarly, in 2022, Harris’s sophomore season, Kansas cut down the nets thanks to a bevy of talent. Harris did his part, but he didn’t carry the team. Kansas had 3 future NBA-wings in Ochai Agbaji, Christian Braun, and Jalen Wilson. It also had an all-Pac 12 conference transfer in Remy Martin and a solid scoring center in David McCormack who was a senior.

For Robinson, his last game in college ended in glory. For Harris, his last two teams have been bounced in the Round of 32. But Robinson was able to play on the best KU team during his last season, while Harris’s best team (so far) was during his sophomore year. This may be clouding what we think of Harris at the moment.

Finally, the one key difference between these two players’ career arcs is the fifth season that Harris will get to play. Dajuan has an extra chance to add to his legacy. By the end of next year, Harris will have a different WAR and different post-season legacy, for good or bad. Thinking back to the freshman-heavy 2009 team, one would have to think that having Russell Robinson as a fifth-year player would have made that team better. Similarly, keeping Harris means KU has a PG it knows can contribute at a certain baseline. They should and will certainly try to add to the backcourt for the 2025 season, but don’t write-off Dajuan just because he isn’t a star. He has a role, and he can help KU if the team has enough offensive and defensive talent around him.

Career WAR and PAB by Player (1993-2025)

PlayerCareer WARSeasons
Raef LaFrentz20.204
Frank Mason19.344
Nick Collison19.224
Wayne Simien18.954
Perry Ellis18.354
Sherron Collins16.724
Paul Pierce14.823
Marcus Morris14.813
Mario Chalmers14.233
Marcus Garrett13.614
Devonte’ Graham13.574
Kirk Hinrich12.994
Keith Langford12.934
Jalen Wilson12.914
Cole Aldrich12.773
Drew Gooden12.743
Jacque Vaughn12.344
Devon Dotson11.212
Ochai Agbaji10.904
Scot Pollard10.764
Thomas Robinson10.763
Hunter Dickinson10.452
Brandon Rush10.313
Udoka Azubuike10.214
Jeff Withey10.164
Jerod Haase9.923
Kenny Gregory9.894
Markieff Morris9.603
K.J. Adams9.394
Dajuan Harris8.885
Darnell Jackson8.754
Wayne Selden8.663
Christian Braun8.573
Tyshawn Taylor8.404
Aaron Miles8.364
Ryan Robertson8.334
Eric Chenowith8.264
Steve Woodberry8.182
Darrell Arthur8.132
Travis Releford7.994
Sasha Kaun7.724
Greg Ostertag7.683
David McCormack7.134
Kevin McCullar6.762
Julian Wright6.332
Dedric Lawson6.181
Landen Lucas5.644
Ben McLemore5.491
Russell Robinson5.324
Andrew Wiggins5.111
Billy Thomas5.074
Nick Bradford4.974
Svi Mykhailiuk4.774
Richard Scott4.642
Elijah Johnson4.434
Rex Walters4.431
Jeff Boschee4.124
Josh Jackson4.041
Adonis Jordan3.821
Malik Newman3.761
Xavier Henry3.741
Joel Embiid3.701
Tyrel Reed3.664
Zeke Mayo3.481
Gradey Dick3.231
Kelly Oubre3.061
Jeff Graves2.962
Patrick Richey2.522
Kevin Young2.502
Sean Pearson2.384
Brannen Greene2.143
Eric Pauley2.111
Lagerald Vick2.034
Mario Little1.992
Darrin Hancock1.921
J.R. Giddens1.902
Remy Martin1.761
Lester Earl1.713
Isaiah Moss1.631
Flory Bidunga1.591
C.J. Giles1.562
Greg Gurley1.463
Cliff Alexander1.371
Tarik Black1.261
Naadir Tharpe1.023
Josh Selby0.901
Jalen Coleman-Lands0.891
Johnny Furphy0.881
Silvio De Sousa0.692
David Padgett0.551
Andrew White0.552
Brady Morningstar0.554
K.J. Lawson0.491
Chris Zerbe0.492
Carlton Bragg0.462
Ashante Johnson0.452
Nick Proud0.431
Alex Galindo0.411
Tyon Grant-Foster0.391
Michael Lee0.384
Rodrick Stewart0.343
Dwight Coleby0.291
T.J. Pugh0.244
Luke Axtell0.212
Rylan Griffen0.201
Conner Teahan0.174
Ernest Udeh0.161
David Coit0.161
Micah Downs0.151
Tyrone Appleton0.121
Justin Cross0.121
Joel Branstrom0.112
Jeremy Case0.084
Conner Frankamp0.051
Omar Wilkes0.051
Jeff Carey0.024
Todd Kappelmann0.022
James Sosinski0.011
Will Thengvall0.011
Chris Huey0.001
Hunter Mickelson0.002
C.J. Henry-0.011
Merv Lindsay-0.021
Latrell Jossell-0.021
Chris Carter-0.041
Josh Pollard-0.041
Zuby Ejiofor-0.041
Robert Reed-0.051
Cam Martin-0.061
Wilder Evers-0.072
Scott Novosel-0.081
Quintrell Thomas-0.101
Kyle Cuffe-0.101
Blake Weichbrodt-0.102
Gethro Muscadin-0.111
T.J. Whatley-0.124
Royce Woolridge-0.131
Shakeel Moore-0.131
Sam Cunliffe-0.131
Steve Ransom-0.132
Jordan Juenemann-0.144
Cheick Diallo-0.151
B.J. Williams-0.164
Marlon London-0.162
Patrick Cassidy-0.162
Tucker Vang-0.171
Nicolas Timberlake-0.171
Christian Moody-0.224
Terry Nooner-0.234
Jamari Traylor-0.244
Elijah Elliott-0.251
Bryce Thompson-0.271
Garrett Luinstra-0.281
Clay Young-0.283
Zach Clemence-0.303
Michael Jankovich-0.305
Lewis Harrison-0.312
Brett Olson-0.312
Parker Braun-0.321
Nick Bahe-0.332
Matt Kleinmann-0.344
Dillon Wilhite-0.343
Jamari McDowell-0.351
Brennan Bechard-0.373
John Crider-0.402
Brad Witherspoon-0.412
Chris Teahan-0.455
Chris Martin-0.472
C.B. McGrath-0.484
M.J. Rice-0.481
Rio Adams-0.491
Charlie Moore-0.491
Chase Buford-0.523
Evan Manning-0.534
Niko Roberts-0.574
Mario Kinsey-0.571
Mitch Lightfoot-0.585
A.J. Storr-0.581
Christian Garrett-0.634
Rakease Passmore-0.701
Tristan Enaruna-0.752
Joseph Yesufu-0.762
Jelani Janisse-0.762
Moulaye Niang-0.773
Calvin Rayford-0.913
Stephen Vinson-0.974
Tyler Self-0.974
Quentin Grimes-1.081
Brett Ballard-1.192
Elmarko Jackson-1.221
Bryant Nash-1.244
Bobby Pettiford-1.252
Justin Wesley-1.463
Jeff Hawkins-1.514
PlayerCareer PABPer100 Est
Raef LaFrentz602.099.56
Wayne Simien562.1411.40
Nick Collison560.978.24
Frank Mason479.826.31
Perry Ellis469.447.44
Paul Pierce421.887.95
Marcus Morris403.978.84
Sherron Collins400.725.63
Drew Gooden385.308.58
Mario Chalmers357.306.51
Cole Aldrich345.198.52
Marcus Garrett308.444.98
Jalen Wilson306.665.50
Kirk Hinrich304.844.16
Jacque Vaughn291.664.38
Devon Dotson284.807.35
Keith Langford283.424.12
Scot Pollard279.645.80
Thomas Robinson279.478.16
Hunter Dickinson269.997.39
Devonte’ Graham268.483.41
Udoka Azubuike261.537.35
Jerod Haase246.405.12
Markieff Morris241.416.55
Jeff Withey240.365.92
Kenny Gregory223.384.00
Steve Woodberry216.526.15
Greg Ostertag216.087.13
Darnell Jackson212.285.85
Darrell Arthur206.436.90
Brandon Rush204.463.43
Ochai Agbaji193.472.78
K.J. Adams177.083.13
Dedric Lawson172.468.37
Sasha Kaun168.744.34
Christian Braun163.933.25
Eric Chenowith158.102.91
Ryan Robertson150.492.57
Wayne Selden148.712.64
Kevin McCullar147.544.36
Julian Wright145.374.86
David McCormack142.053.48
Travis Releford133.962.57
Ben McLemore133.876.42
Andrew Wiggins124.876.22
Rex Walters117.236.51
Richard Scott101.613.66
Joel Embiid99.258.77
Tyshawn Taylor97.721.38
Landen Lucas96.692.57
Josh Jackson94.795.02
Aaron Miles93.341.24
Adonis Jordan89.374.53
Xavier Henry86.154.97
Billy Thomas81.851.98
Malik Newman74.523.45
Zeke Mayo71.143.77
Nick Bradford67.861.58
Kelly Oubre67.715.12
Dajuan Harris65.960.73
Gradey Dick58.532.84
Jeff Graves46.602.02
Darrin Hancock39.993.25
Eric Pauley36.862.41
Mario Little35.662.80
Remy Martin31.782.86
Russell Robinson30.950.53
Flory Bidunga29.763.07
Patrick Richey26.921.05
Kevin Young26.411.20
Lester Earl24.221.47
Tarik Black22.962.93
Cliff Alexander22.902.66
Svi Mykhailiuk22.670.42
Brannen Greene21.841.16
C.J. Giles21.181.65
Isaiah Moss21.011.63
Jalen Coleman-Lands16.032.84
Chris Zerbe15.8911.80
Nick Proud13.968.31
Greg Gurley11.530.70
Tyrel Reed8.490.19
Silvio De Sousa8.151.42
Andrew White7.601.83
Josh Selby6.290.68
Elijah Johnson5.440.10
Tyon Grant-Foster5.081.63
Dwight Coleby3.881.65
Alex Galindo3.870.97
Justin Cross3.6724.72
Ashante Johnson3.580.62
K.J. Lawson2.970.49
Tyrone Appleton1.842.24
Joel Branstrom1.241.05
Sean Pearson0.610.02
James Sosinski0.060.40
Will Thengvall-0.01-0.10
Chris Huey-0.02-1.29
Omar Wilkes-1.23-0.96
Chris Carter-1.47-81.38
Micah Downs-1.68-0.63
Robert Reed-1.83-20.92
Latrell Jossell-1.88-4.14
Merv Lindsay-1.94-3.96
Todd Kappelmann-1.96-1.58
Josh Pollard-2.03-8.91
Cam Martin-2.84-15.49
Scott Novosel-3.84-10.44
Kyle Cuffe-3.98-36.61
C.J. Henry-3.99-3.12
Wilder Evers-4.34-7.25
Gethro Muscadin-5.36-9.57
Blake Weichbrodt-5.43-5.85
David Padgett-6.22-0.60
Ernest Udeh-6.41-1.46
Royce Woolridge-6.71-8.72
Patrick Cassidy-6.93-17.73
Tucker Vang-6.95-24.81
Johnny Furphy-7.52-0.54
Zuby Ejiofor-7.74-3.46
Steve Ransom-8.07-6.99
Sam Cunliffe-8.39-6.48
T.J. Whatley-8.46-3.81
Conner Frankamp-9.16-2.33
Elijah Elliott-9.85-26.80
Jordan Juenemann-10.16-5.64
Garrett Luinstra-10.42-54.12
Quintrell Thomas-10.42-4.25
J.R. Giddens-13.29-0.45
Dillon Wilhite-14.16-18.38
Brett Olson-14.17-11.40
Cheick Diallo-15.21-4.30
Clay Young-15.25-7.92
Nick Bahe-15.29-8.48
Luke Axtell-15.41-1.44
Lewis Harrison-15.68-10.67
Michael Jankovich-15.72-8.46
Brennan Bechard-16.31-14.79
Hunter Mickelson-16.39-2.81
Brad Witherspoon-16.44-22.92
John Crider-16.57-16.62
Terry Nooner-17.34-4.46
Shakeel Moore-18.02-3.71
Rodrick Stewart-18.30-1.71
David Coit-19.95-2.17
Chris Martin-20.02-22.88
Jeremy Case-20.26-2.51
Carlton Bragg-20.96-1.56
Rio Adams-21.25-14.29
Chase Buford-21.45-20.43
Chris Teahan-21.93-10.15
Matt Kleinmann-22.07-6.44
Jamari McDowell-23.30-5.95
Evan Manning-23.76-12.57
Zach Clemence-23.88-5.05
Parker Braun-23.89-5.38
Niko Roberts-23.94-16.09
Christian Garrett-25.09-21.08
Rylan Griffen-25.32-2.17
M.J. Rice-25.78-8.48
Mario Kinsey-26.22-10.70
Bryce Thompson-26.32-4.42
Rakease Passmore-30.60-15.11
Nicolas Timberlake-31.71-3.47
Jelani Janisse-33.52-19.95
Jeff Carey-37.13-2.62
Tyler Self-38.61-23.72
Jeff Boschee-39.46-0.55
Charlie Moore-40.09-4.99
Conner Teahan-44.97-2.48
A.J. Storr-46.29-4.95
Moulaye Niang-46.84-6.83
C.B. McGrath-49.94-4.38
Stephen Vinson-50.33-10.27
Tristan Enaruna-53.77-5.46
Naadir Tharpe-55.75-1.67
Marlon London-58.95-3.21
Brett Ballard-59.02-11.75
Michael Lee-62.49-2.17
Joseph Yesufu-63.93-4.81
Christian Moody-65.36-3.05
Bobby Pettiford-68.99-7.94
Justin Wesley-70.99-9.75
Lagerald Vick-73.99-1.40
Elmarko Jackson-74.52-6.72
Quentin Grimes-86.43-5.01
Calvin Rayford-87.98-4.65
Bryant Nash-88.18-6.00
T.J. Pugh-94.72-2.50
B.J. Williams-108.62-2.95
Jamari Traylor-111.52-3.01
Jeff Hawkins-113.17-5.20
Mitch Lightfoot-114.75-3.57
Brady Morningstar-116.05-2.39

WAR vs. PAB

Wins Above Replacement (WAR) and PAB (Points Against Bubble) have similar concepts and therefore the lists will be similar. Both are attempting to rank the careers of all KU players since 1993 to see which Jayhawks have been the most valuable for the program. The differences stem from the benchmark player upon which value is judged. In WAR, the “replacement player” is basically an average D1 player whereas in PAB, the “bubble player” is a player whose value makes a bubble team no more or less likely to make the tournament. In other words, a bubble player is a much higher standard than a replacement player.

So why the two lists? Which list is more valid?

At the top of the list there isn’t a ton of difference as guys like Raef LaFrentz easily clear the bubble level just as they clear the replacement level. It is further down the list where this distinction matters. Take Jeff Boschee for instance. Boschee was a four-year starter who is currently 57th in career WAR but 168th in PAB. Boschee was better than a replacement player but not better than a bubble-level player for the majority of his career1.

These are widely different rankings, leading to the follow-up question, which list is better? Well, it depends. Being a better-than-bubble player is crucial for KU to approach the success demanded of it. So we would normally lean with PAB. However, sometimes players who are not quite at bubble-level (but still solid enough to be above replacement level) are required to play heavy minutes due to roster issues or coaching decisions, and it wouldn’t be fully accurate to list these players below low-minutes-played players because of this. Boschee serves as a great example. He was certainly a below-KU-average guard given the minutes he played, particularly as an underclassman. But he was still valuable because he was better than the alternatives at his position.2 This is where WAR can be a better metric.

There is a third way to measure that is present, namely Per100 (possession) against bubble value. This is the third column on the second table. This shows the value the player provided while on the court, effectively ignoring playing time. Be aware of the limitations of this measurement. One, if we sorted by this list we’d include walk-ons at the top who graded out very well in very small, unimportant minutes. Two, durability is an important feature inherent to both WAR and PAB but ignored in Per100 value. A player who generates high value per possession but does not stay healthy throughout the year may not help the team as much as someone who can play a full schedule and heavy minutes at a lower value. A four-year player with solid value (like Marcus Garrett) will provide more value to KU than an elite one-and-done (like Joel Embiid).

Both WAR and PAB are useful lists but cannot be considered in isolation. If we are looking toward the top of the list, PAB is the better measurement. It estimates how many points a player gave to Kansas above that of a bubble-player over his career. Toward the middle and bottom of the list, WAR becomes the better mark. Clearly role players with sub-bubble (but above-replacement) value are preferable to the walk-ons. Lastly, Per100 can add some more context but we must be careful to not over-emphasize this measure as it is total value, not per possession value, that is most important when determining this ranking.

  1. Boschee’s only above-bubble season was his senior year in 2002. ↩︎
  2. Marlon London and Jelani Janisse are examples of other backcourt players on the roster in the Boschee-era. KU’s backcourt talent depth was quite thin during Boschee’s first three seasons at Kansas. ↩︎

Three’s Company

Eleven games into the 2024 season, KU’s been carried by its “Big 3” of Hunter Dickinson, Kevin McCullar, and K.J. Adams. The trio has combined for 64.7% of KU’s points scored this season while playing 48.4% of available minutes. This production works out to points per game averages of 19.2, 19.2 and 13.0. No one else on the team averages even 7.0.

Additionally, these three have been the best defenders on the team according to the charting. Per total per game value; Dickinson (+6.64), McCullar (+5.14), and Adams (+2.31) are playing well beyond that of a bubble-player, while all 6 of the other scholarship guys are below 0.00. KU is heavily reliant on this trio to win games.

For a Kansas team to be so reliant on just a few players seemed odd, so I explored a way to quantify this and compare it to other KU seasons. The best way was to use WAR, which is additive, and sort each season by that year’s team’s most valuable player to its worst.

Here are the numerous ways the 2024 team stands out:

  • Of the 2024 team’s total WAR, each of KU’s Big 3 has collected at least 25% of the team’s total WAR (note that a player can be negative if he has negative WAR). Since 1994 (31 seasons), only once has this happened over the course of an entire year (2017 with Frank Mason, Josh Jackson, Devonte’ Graham).
  • Through 11 games, the trio of HD/KM/KJA has produced 5.94 WAR, which if multiplied out to a 36-game season, would be 19.43. This would be the best out of any KU team’s best three players, with the 2012 team earning 19.07 during a 38-game schedule. (If we compared apples to apples, this year’s Big 3 is on pace to earn 20.51 WAR over 38 games).
  • It’s not only that this year’s top trio is playing well; it’s also that no one else is doing much. Of the team’s total WAR, the HD/KM/KJA three have earned 124% of the WAR, indicating that the sum of everyone else is below replacement-level. At no point since 1994 have players 4 on down collectively generated negative Wins Above Replacement score for the Kansas Jayhawks. The closest was in 2005, when all players save Wayne Simien, Keith Langford, and Aaron Miles produced a meager 0.53 WAR. The current 2024 non-Big 3 is at -1.15 WAR through 11 games.

Note how the orange dot (Top 3 combined WAR) is always contained within the blue bar (Total Team WAR) except for the 2024 season. For the 2024 team, KU’s needed everything it has gotten from its Big 3 due to the rest of the roster struggling to play at a high level. Projecting forward, one assumes that Dajuan Harris will pick things up. There might also be some reversion down, particularly with Kevin McCullar. McCullar has vastly over-performed his projected marks coming into the season.

Dajuan, Dajuan, What is Wrong?

(Long article. Scroll down to bottom for the summary)

During the midst of the 2023 season, KU had a 3-game losing streak and a date at Rupp Arena against a talented Kentucky team. Dajuan Harris was coming off poor showings in his last 2 games, and questions surrounded a team that had no true center in the starting rotation and a pass-first point guard who wasn’t a natural scorer.

Kansas went on to beat Kentucky that game, bolstered by great play from Jalen Wilson, but also a good outing from the rest of its starters, including its point guard Dajuan Harris. From that game forward, KU would play 16 games to close out the season. Harris produced a +3.22 per game value score, indicating that he was worth over 3 points per game to Kansas than a “bubble” level player would be. During this stretch, Harris was playing his best ball, comparable to a junior-year Frank Mason (2016 season) or senior-year Tyshawn Taylor (2012 season). Harris was doing it in different ways than these scoring guards; certainly through defense first, but he was also adding value on offense thanks to both shot-making and assisting.

In fact, during the closing stretch of 2023—KU’s final 10 games, Harris produced offensive value of +1.06 per game. This was third on the team behind Wilson and Gradey Dick over that period. While KU getting bounced in the Round of 32 wasn’t fun, no one can blame the play of Dajuan Harris. He was solid against the Razorbacks on both ends, adding about a point-and-a-half both ways and +3.30 points overall. For the season, Harris contributed +2.06 points per game above bubble. Roughly, based on his play, Harris was worth 2 points a night when compared to an average player on a bubble-team.

The elements for Dajuan Harris having a successful 2024 were all in place. He was coming in as a 5th-year-in-the-program player (having redshirted), 2-year starter who saw his game improve each season. Always a defense-first, pass-first player, Harris had improved during the back-half of his junior season and started to be a net contributor to the offensive scheme. This development is common, but not guaranteed, among Bill Self program guys. Harris was making the same strides in his game that others had before him. Some of these strides were unique to him, but he was playing better and making a positive mark on a program that has had numerous talented players come through.

Coming in to the 2024 season, Harris was projected to be a +2.50 player on the season, a conservative improvement on his 2023 value scores. Harris was expected to see a slight bump on both offense and defense. It wasn’t that his expectations were too high. If anything, they were somewhat low. By all appearances, Harris had figured things out. His defense had been consistent throughout his career, and now his offense had finally come around. With Hunter Dickinson coming in, his assist numbers would reach career highs. His shooting and scoring would still be there, but he wouldn’t need to do too much.

But through 10 games, this hasn’t been the case. Not only is Harris not performing to his projections, he isn’t performing anywhere near what he is capable of. He is playing worse than in 2023, by a long shot. He is also playing worse than he did in 2022, when he was a role player on the national championship team. But not only that, Harris is worse than he was in 2021 as a red-shirt freshman who rarely shot and got taken advantage of by stronger players.

Looking at Per 100 numbers, that is the value a player adds (in points) to his team over the course of 100 possessions, Harris’s development looks like this:

2021: -5.18

2022: -1.72

2023: +3.46

Players tend to improve as they age through their college careers, although again not everyone develops in this straight-forward of a manner. Some players have drops in value or flat-line after they reach certain points. So, if Harris was merely on pace to produce a similar or slightly worse season than last year, this wouldn’t be out of the ordinary. Even if Harris was noticeably worse, say close to 0.00, it would be disappointing but not unprecedented. Unfortunately, this isn’t the case, either. In fact, Harris is playing the worst basketball of his career at Kansas.

2024: -5.80

Again, this is a per possession number, so it takes into account the fact Harris is playing more than he has in past seasons. On a per possession basis, Harris is worse than a bubble-player by 5.80 points, which is even worse than his value during his freshman season of 2021.

If we look at it from a per-game mark, it looks even worse. At -3.52, Harris is producing the worse per-game mark of any Jayhawk rotation player by over a full point per game (2019 Quentin Grimes -2.40). Harris is also worse than his prior season at over 5.50 points per game. Never has there been such a drop-off, year-over-year. KU has had players unexpectedly decline, Eric Chenowith’s junior year (2000) being one example (he went from a +2.63 player to a +0.59 player), but it has never been this dramatic.

Breaking down Harris’s play so far, we’ll first look at offense, comparing his 2023 and 2024 seasons.

Going through each line, we see that Harris’s efficiency has slipped from 1.11 to 1.03. What makes this worse is that KU hasn’t faced its meaty conference schedule yet. Not only is Harris less efficient, he is less efficient against an easier schedule. Harris is accounting for nearly 2 fewer points per game on offense than he did last year, despite playing more minutes. Harris is shooting worse overall than he did last season (49.5% vs. 45.2%). He is also shooting less, despite the team needing him for more production. In turn, his impact is less this season. Once we adjust for opponent, we see that Harris is 2 points worse (in terms of overall value) on this end that he was last season.

Breaking down into offensive categories on a Per 100 possession basis, we see (2023 vs. 2024):

Not only is Harris’s scoring down, his handling (turnovers/assists) is also down. Only his boarding, or offensive rebounding value, has changed for the better. But in terms of overall value, this increase is negligible.

Defensively, Harris has declined even more.

Harris went from a stingy defender, giving up 9.2 points per 60 possessions to allowing 11.8 per 60. The other important category, possession winners (PW), went from 5.3 to 4.2 per 60. A player needs to win possessions to add value. Harris is getting fewer steals, forcing fewer turnovers, and not rebounding any better while giving up more points to his man. All despite playing an easier schedule when compared to 2023 numbers. This leads to a player who is worse on the defensive end by more than 3 points a game.

His Per 100 numbers on defense, broken down into categories:

Harris went from KU’s best defender in 2023 to its worse in 2024. How? Well, mostly by giving up too many points to his opponent. A stinginess score in the red means he has to add value from generating turnovers (which he hasn’t done well at in 2024) or rebounding (which is marginally better, but as a point guard, not ever going to be the area where he adds defensive value). This is the biggest disappointment in Dajuan’s decline. He was the Big 12 defensive Player of the Year last season. Now, he’s a liability most games.

2023 vs. 2024. Harris is over 5.50 points per game worse in 2024. He is over 9.20 points worse Per 100. He has also gone from a season where he added 3.87 Wins Above Replacement to one where he has lost 0.52 WAR.

Should Harris be benched?

Dajuan is putting up historically-bad numbers in a season which has him playing historically-high minutes. Clearly, something isn’t working with him. But if KU went to the bench, who would replace his minutes? We can’t consider Adams, McCullar, or Dickinson/Braun, players whose minutes are already maximized or aren’t suitable replacements for a guard. Let’s look at KU’s other four guards/wings in terms of player value. Remember, based on the roster, KU needs to have at least 1 of these guys on the court at all times right now. If Juan gets benched, you’ll need 2 of these 4 to play at once.

There’s a bunch of red here. For one, Nicolas Timberlake is playing worse than Harris on a per possession basis. Next, we can look at the play of Jamari McDowell and Elmarko Jackson. Neither has been much better than Harris. McDowell in particular has struggled recently after a hot start. Of these four, only Furphy has produced near bubble-level value and positive WAR.

So, let’s grant that Furphy has been better than Harris. Who else do you go with? Elmarko has had his poor moments. McDowell is very limited on offense, and his defense won’t likely become elite anytime this season. Timberlake is an even worse option. Another consideration is that, when you take Juan out, you need Kevin McCullar to run more point/generate more offense. Sure, you still have Elmarko and maybe part of the solution is giving him the keys from time-to-time. But if he’s been struggling as an off-guard with less pressure, what chance does he have being the guy to get everyone organized and the offense started?

KU’s best chances are still with Harris. He cannot, surely cannot, continue to play as poorly as he has. As a 3-year starter, Harris put up back-to-back seasons that were better than anyone else on the list above. If he could just match the 25% percentile of his play over the past two years, he’ll be much more valuable on the court than more minutes for the other four guards/wings.

Silver Lining

The good news is that Harris will not continue to play as poorly as he has. Yes, it’s been a disappointment. Here are many reasons to consider that his play will tick up.

  • He will get exploitable matchups as teams game plan around stopping Hunter/Kevin/K.J. He will get open layups, open 3’s, and other opportunities.
  • He will have a few defensive shut-down games to boost his defensive score.
  • As schedule gets harder, Harris will play up to his opponent. While he hasn’t done well against KU’s better opponents, he’s still better against KU’s 5 power-conference foes (-2.87 per game) than the 5 lower-tier opponents (-4.17 per game).
  • Harris’s score can naturally climb faster given how poor he’s been. Just a few positive games can be enough to change the narrative.
  • The team is currently 9-1 despite him playing poorly. Juan hasn’t been responsible for a loss, as the 14-point Marquette loss was the fault of many poor showings.
  • Precedence of Tyshawn Taylor in 2011. Taylor was -3.89 per game during 17 conference regular season/tournament play yet still finished the season with a solid NCAA Tournament of +3.35 per game (even his play during the VCU game wasn’t terrible). So other good players have gone through disastrous stretches but still picked things up later on.
  • Precedence of Remy Martin in 2022. Harris’s former teammate Martin had a disappointing regular season (-0.05 per game). But in his 9 tournament games (Big 12 + NCAA’s), Martin put up +3.66 per game in value, hitting huge shots in key moments during KU’s National Title run. Again, like Taylor, we see improvement when it matters most.

If Harris can get back to the level of play he had in 2023, his tough start to 2024 won’t matter at all.

Conclusion

Here are the key points. Dajuan’s performance through 10 games this season has been his career worst. Compared to other KU starters, Harris has been worse than any other Jayhawk in 30 years. He has seen decline in his game across all categories, but the primary problems have been with his scoring and defensive coverage. He isn’t scoring enough but is letting his man score too easily.

However, despite his poor play, Harris is a necessary component to this team. His would-be replacements are either worse or wholly unequipped to carry the load as a Big 12 point guard. Not only does he need to play, he needs to play substantial minutes for this team.

The expectation should be that Harris improves and is back to being a positive contributor by season’s end. There is precedent for good Kansas guards figuring it out by NCAA Tourney time. As KU is winning despite his poor play, a solid Dajuan Harris can make this team a true national title contender.

Random Jayhawk Player Breakdown 1

This is a new segment for the off-season in which a Kansas player will be randomly selected to have an in-depth statistical breakdown of his career as a Jayhawk. Since 1994, that is the last 30 seasons, there have been 172 players to appear in a regular season game wearing the crimson and blue. In our initial installment, the random player selected is…

Darrell Arthur

Not a bad first random selection! Darrell Arthur played for the Kansas Jayhawks in the 2006-07 and 2007-08 seasons. For simplicity, we will refer to the former season as ’07 and latter as ’08. Arthur came in as a highly-touted true freshman and left after his sophomore year to enter the NBA draft. He was selected 27th overall in the 2008 NBA draft and played in 9 seasons for the Memphis Grizzlies and Denver Nuggets. He played in 503 NBA games and averaged 6.5 PPG over his NBA career. But this write-up is about his college career, and this is where we will now focus.

2007 season

According to College Basketball Reference’s RSCI Top 100 rankings, Darrell Arthur came in as the #11 prospect in his class. He was in the same incoming class as Sherron Collins and Brady Morningstar. Arthur played in all 38 games and produced the following traditional stats:

Arthur came in and performed right away. In his first collegiate game he scored 12 points with 6 rebounds and 3 blocks. The next game, the upset loss to Oral Roberts, Arthur scored 22 on 10/16 FG’s. He would put up his season high in points the next game, a bounce-back win against Towson, with 26 and 8. He had 19 and 9 in the team’s big win in Vegas against that great defending (and eventual) champion Florida Gators team. And while he struggled some during conference play, he was still a very positive player. His best conference game was against Iowa State where he had 15 and 11.

For a freshman to come in and produce, particularly during a time when KU had Julian Wright, Darnell Jackson, and Sasha Kaun; shows the level of play Arthur brought to the floor. He forced Self to play him by how good he was.

Arthur’s advanced stats, calculated by Basketball Reference, are as follows:

Arthur’s shooting was excellent, scoring efficiently by getting close baskets while having a solid mid-range game. His usage shows that he was a scorer, not someone who shot well only due to shot selection. Frosh Darrell Arthur could score. His rebounding percentage was fine for a freshman. His win share of 4.8 was fourth on the team that season, however his WS/40 was the team’s best. There’s an argument to be made here that he deserved more minutes. All of KU’s four bigs were good enough to start elsewhere, which made it tough to find more playing time.

Arthur’s value stats, which incorporate the most information and are thus the most accurate, show this:

This indicates that Arthur added 2.19 points of value per game above that of a bubble-player, with value added nearly equally between offense and defense. Arthur didn’t get routinely torched on defense (as some underclassmen do), and had active hands to not only grab rebounds but also get steals and force turnovers.

On a per-possession basis, Arthur’s value was the team’s best in ’07 at +6.61 points above bubble per 100 possessions. This is more evidence arguing in favor of Arthur’s playing time. Arthur’s best game of the season, and in fact the best outing of anyone that season, is estimated to be his performance against Towson. He had a +13.52 score, opponent-adjusted.

2008 season

Julian Wright, the team’s starting power forward the year prior, left for the NBA draft, which provided an opportunity for Arthur to start at that position his sophomore year. He would do just that, playing in all 40 games and starting in all but one (senior night). Along with his freshman year, his sophomore campaign’s stats are represented below:

Arthur’s stats increased across the board, aside from small drops on blocks/steals. He was the second-leading scorer behind Brandon Rush and second-leading rebounder behind Darnell Jackson. His shooting and scoring abilities increased as his minutes grew, leading to a more-efficient season that was also much more productive.

Arthur’s season high was 23 against Baylor, the team he almost went to. While he never touched the 26 he scored the season prior, he was a more reliable double-figure scorer, putting up 10+ points in 28 of 40 games. His most important game as a leading-scorer was his 20-point performance against Memphis in the 2008 National Championship game.

“Shady”’s advanced stats show a bump across the board, with a slight decline in usage. His win share increased by a full win, with a slight downtick on the per-40 metric. More minutes mean more concern with foul trouble, fatigue, etc. so this downtick isn’t anything alarming. The manipulation of the numbers indicate that he was heavily relied upon to be a leading player and that he performed.

Next graphic will show Arthur’s value stats.

In playing more minutes yet staying offensively productive and defensively agile, Arthur increased his per game value score to over +3.00. On a per-possession basis, he was second on the team at +7.26 per 100 possessions (Mario Chalmers). He was the team’s MVP for 8 games, including the National Championship game. On an opponent-adjusted score, Arthur’s best game in the 2008 season was against Texas in the Big 12 Tournament championship game, when he was +13.42 against the Longhorns.

As many KU fans know, Arthur was going to commit to Baylor before changing his mind and going with Kansas, due to a dream he had of Kansas winning the national championship. Arthur’s career is highlighted by this game. While Chalmers had the highlight shot to tie it in regulation, Darrell’s play throughout kept Kansas in it and helped lead the comeback charge. He hit an 18’ jump-shot to cut the 9-point lead to 7 with 1:57 left. He had a clutch basket with 1:00 left to cut the deficit to 2. And he added a dunk off a Chalmers feed early in OT to put KU up 4.

Summary

Let’s get to the ultimate question, which is how do we judge Arthur’s career at Kansas when compared to other Jayhawks? This can get tricky as there’s different ways to think about it. College basketball is different than other levels, in that those who are very good will move on sooner and play fewer than 4 seasons. If we take Arthur’s sophomore season: 12.8 PPG, 6.8 RPG, and a +3.08 Adj. PPG +/-; we see a good season that is nevertheless bested by numerous bigs in the Self-era: Perry Ellis, Wayne Simien, Thomas Robinson, Marcus Morris, Markieff Morris, Cole Aldrich, etc. Each of these players, in terms of Wins Above Replacement, had better Kansas careers than Darrell Arthur. For reference, Arthur’s career WAR is calculated to be 8.35. The worst of the above list is Markieff Morris at 9.75. Simien is up at 19.27 WAR.

But most of these names had their breakout seasons as upperclassmen and added their most value later in their careers. Since Arthur wasn’t around for potential junior or senior seasons, we don’t really have an apples-to-apples comparison regarding careers.  

If we look only at a player’s freshman and sophomore years, we get a comparison of how good Arthur was while at Kansas compared to other underclass PF’s and C’s.

Here we see Arthur better than the others over their first two seasons. He was better than Williams-era stalwarts as well; namely LaFrentz, Collison, and Gooden.

If we look at all positions, only Devon Dotson (11.51 WAR) tops Arthur when looking at all KU players’ freshman/sophomore years over the past 30 seasons. Arthur’s production as an underclassman is 2nd best of any Jayhawk over the past 30 seasons. This seems noteworthy for someone who can get overlooked when fans are devising their dream lineups. Incidentally, Devon Dotson is in the same boat when it comes to great KU guards.

Regarding all time seasons and Adj. PPG +/-, Arthur’s 2008 sophomore campaign is 49th and his 2007 freshman campaign is 80th (out of 426 player-seasons). These two years were very good but not great seasons when looking at all-time performances. When we look only at sophomore years, Arthur’s season is either 6th or 7th best (depending if Simien’s 2003 injury-plagued season is counted) out of 98. His frosh season was 9th best out of 119.

If one thinks of Darrell Arthur as one of KU’s great power forwards, he isn’t in the wrong. However, if we are just counting what a player did at KU, and recognize that players who stay for 4 years can have more of an impact than those that only play 1 or 2, we’d place Arthur as 33rd in career WAR out of 172 (81st percentile). Sandwiched in between Tyshawn Taylor and Travis Releford.

KU Tournament Paths in the Self-era

The NCAA Tournament also goes by the moniker “March Madness,” reflecting the unpredictability of outcomes. Kansas has been no stranger to this madness, as it has been bounced early on multiple occasions as a highly-favored team but also won the 1988 NCAA Tourney as a 6-seed.

Each path to a possible title is unique. Some years, the bracket can open up for a team as upsets clear the way for a better chance at success. Other years, the bracket goes chalk and difficult opponents are faced. We will explore how varied KU’s possible paths have been down below.

Also at play is the idea of the possible opponent. Had KU defeated Arkansas this year in the R32, its next game would have been against Connecticut in the S16. For fans of any team, viewing potential matchups down the line is commonplace after the brackets are released on Selection Sunday. But after the team loses, the would-be matchups become less intriguing. For this exercise, we will be examining KU’s would-be matchups had they advanced.

We will restrict our study to the Bill Self era. This gives us 19 seasons worth of Tournament data (Self has been the coach at KU for 20 seasons, but 2020 is excluded obviously). For data, we will use KenPom’s final results of that season to serve as a team’s relative strength. We will then match up Kansas against its actual or hypothetical opponents for any given round. For years where KU makes the championship game, these opponents will all be actual opponents. For other years, some opponents will be those KU would have faced had it kept winning. Then, using KenPom’s numbers, KU will be compared to said opponent to get an estimated points spread. Next, these point spreads will be converted to winning percentage estimates using historic data from Team Rankings and a smoothing process. For instance, if a team is 7.7-point favorites (per KenPom), then that team wins the games an estimated 78.0% of the time (using the smoothed historic numbers). It is this 78.0% number that gets used to estimate Final 4 and National Championship odds.

We’ll start with Final 4 odds. Below is a table which calculates KU’s odds of making the Final 4 given the path that occurred.

The seasons with actual F4 appearances are highlighted in green. The average F4 chance for KU in the Self-era is 23.1%, with conditional formatting being set as Red for 1/10 chance, Yellow for 1/4 chance, and Green for a 1/2 chance. There are two factors at play. First is the draw, how the bracket turns out. More upsets in your region means an easier path. The second factor is the strength of the team, and this also turns out to be important. For 2008, KU’s biggest break was in the S16, when it faced 12-seed Villanova. For a S16 game, it was a much weaker opponent than normal. The E8 game, against 10-seed Davidson, was not really a break. Despite the double-digit seed, Davidson was about as strong as the average E8 opponent or potential opponent KU faces/could face.

KU took advantage of 2 of its better chances to make the Final Four in 2008 and 2022. The biggest chances wasted were in 2010 and 2011. KU’s toughest opponent to make it to the F4 (and in fact the NC game) in 2011 was actually its R32 opponent Illinois. For 2010, KU would have been favored by 8.2 and 9.3 points for its would-be S16 and E8 games.

The 2012 path was Self’s fifth-best chance, which he converted by getting to New Orleans. 2018, which was a year in which KU didn’t get any seeding breaks or upsets, was the most-unlikely F4 for Self. Next we look at National Championship chances.

This table will look similar to the Final Four table. Note that the conditional formatting is set at Red for a 1/50 chance, Yellow for a 1/20 chance, and Green for a 1/5 chance. KU’s 2008 and 2022 titles are highlighted.

Self has had four really good chances, given the strength of his team and the draw he received (2008, 2010, 2011, 2022). But “really good” regarding odds of a title in the NCAA Tournament is still far less than even a 30% chance. He cashed in on two of those chances when just one title would have been above expectation. Aside from those four seasons, KU’s best title chance was below 10%. It’s really hard to win 6 games in the Big Dance, especially if you don’t get some breaks.

Removing KU’s team strength from the equation

Above there were 2 variables, the path that played out in that specific bracket and the relative strength of each KU team. As the 2008 squad was KU’s strongest, it isn’t unsurprising that it had better odds than other KU teams. What we will now do is remove the KU-specific component and look at each tournament path assuming a team with a 30.00 KenPom AdjEM is facing it. 30.00 is a very good AdjEM, and most teams that achieve that mark will earn a 1-seed. As good as KU has been in the past 20 seasons, its average AdjEM is 25.82, well below this 30.00 mark. It has only reached an AdjEM of 30.00 in 3 seasons under Self; 2008, 2010 and 2020.

This exercise will serve a dual-purpose. It is this 2020 team that didn’t get a chance to make a run for a title. With an AdjEM of 30.23, it is very close to the 30.00 number. We can plug the 2020 team for other KU teams in other brackets to analyze how successful it would have expected to be. For the first table, we see which paths were the easiest and which were the hardest to get to a Final 4. Later we will look at the National Championship table.

The 2022 path was the easiest, as that KU team faced weak S16 and E8 opponents. Unsurprisingly, 2011 was also a good break. However, none of these paths can remotely be described as a “cake-walk.” Even the 2011 path is expected to miss a F4 nearly half the time. On average, a KenPom team at 30.00 AdjEM (abbreviated from now on as KP30) is only expected to make 33.3% of Final Fours. Looking at the 10 years KU got a 1-seed, this KP30 team makes the F4 37.9% of the time. In the other 9 seasons (either as a 2,3, or 4 seed), this KP30 team makes the F4 only 28.1% of the time. Even the Final Four is flat-out hard to get to.

With National Championship chances, what first stands out is how much 2008 drops once you account for KU’s strength that season. The Final Four was loaded, with all four one-seeds. Having to beat North Carolina and Memphis was not easy. All told, a KP30 team getting KU’s path in 2008 was expected to win only 11.2% of the time. Incidentally, 11.2% was also the average chance of winning a national championship for a KP30 team.

KU’s easiest paths occurred in 2022 and 2011, with KU cashing in 2022. 2014, with teams like 11-seed Dayton, 7-seed UConn, and 8-seed Kentucky in the path; was an underrated good chance at a trophy. KU’s toughest paths have come relatively recently in the Self-tenure. The 2015 path would have been the only time KU had to face a chalk-bracket, as it would have had to have beaten three #1 seeds (including number-1 overall Kentucky) to earn a trophy.

The run of 2016-2018 also feels better in retrospect. While KU got three 1-seeds in this span, they only reached one Final Four and never played for a title in a championship game. But the cumulative expected titles a KP30 team would achieve in total for these three years is only 0.252. They turned out to be tough draws.

To tie this to the 2020 team, that group would have been expected to reach a Final Four, at best, 40% of the time. A National Championship would be 15% at best. Even as a 1-seed with a typical path, KP30 teams are likely to still get beat somewhere along the way. Winning 6 is tough.

Last, to highlight how difficult the tournament is, we’ll look at what AdjEM would be needed to reach certain thresholds. For instance, it would take an AdjEM of 34.72 for a team to reach the Final 4 50% of the time given the draws KU got over the past 19 tournaments. Even if we limit the draws to 1-seed paths only, the AdjEM would have to be 33.36. This is a level of play that only one KU team has reached in the 20-year Self-era. For National Championships, this level is more remarkable. To win a title 20% of the time, you’d need a 32.37 AdjEM. To win it 25% of the time, 34.00. To win it 33.3% of the time, the level of play would have to reach 36.30. To have even odds of winning, the estimated AdjEM would have to be 40.53. This type of performance has only achieved by the 1999 Duke team which was National Runners-up.

Kansas 71, Arkansas 72

Jalen Wilson had his 18th team-MVP game of the season in his final college basketball game. He recorded half of KU’s game-MVP’s this season, the highest rate of any Jayhawk since Frank Mason’s 2017 season. His game-score for the Arkansas game was slightly-above his season average. K.J. Adams had a fine game himself despite foul trouble. It was his best outing since the home Baylor game in mid-February. Dejuan Harris was the other Jayhawk starter to produce positive value, although he wasn’t mistake-free (5 turnovers counting the 5 second inbounds and 10 second backcourt violations). Gradey Dick was guarded well by Arkansas, and he missed some chances to have a bigger impact. His defense wasn’t terrible, but he needed to score more than 7 points. Kevin McCullar had some big baskets in the second-half, but his negative-value game was due to his defense. He was assigned to stop Arkansas’s scorers and had a rough second-half on the defensive side of things.

The bench finished the season with the distinction of being Self’s worst in his 20-year tenure. Joe Yesufu hit a ridiculous first-half 3 to finish slightly above zero, and Bobby Pettiford’s steal and layup also catapulted him above bubble-level. The trio of Udeh/Clemence/Ejiofor was not at all productive and may have contributed to the loss as they tried to fill in for K.J. Adams’ foul trouble. There were a lot of factors that went into deciding the outcome.

A questionable foul call on McCullar with 23 ticks left sent Arkansas to the line, where they would take the lead for good. Had the blocking call been a charge, KU would have likely gone to OT at worst.

Kansas 96, Howard 68

Kevin McCullar was KU’s most-valuable player in their Round of 64 win against Howard. The bulk of his value came from stingy defense and solid rebounding, but he also produced a positive offensive outing as well. Jalen Wilson had a quiet 20 points and also played strong defense, whereas Gradey Dick had the Jayhawks’ best offensive performance to overshadow his poor defense. This was also the bench’s first positive-value performance in its last 7 games.

The TEAM score of +15.94 was its third +15 game in the last four.