The 2014 Kansas Jayhawks finished with a record of 25-10 (14-4), winning the Big 12 Regular Season. The team earned a 2-seed in the NCAA Tournament, reaching the Round of 32 before losing. The team’s Sports Reference link is here.
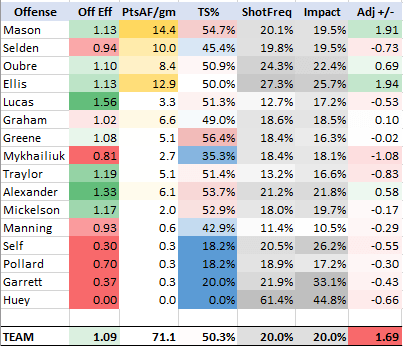
Offense:
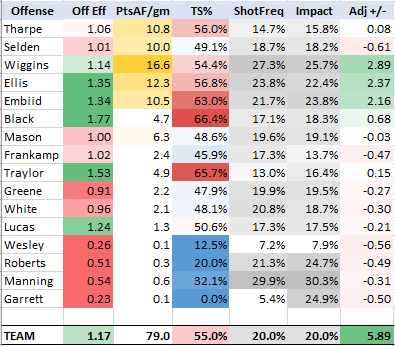
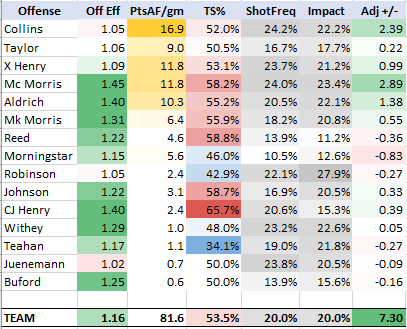
Andrew Wiggins led the Jayhawks’ offense in 2014, accounting for 16.6 points per game on 54.5% true shooting. He was joined by strong interior scoring from Perry Ellis and Joel Embiid. KU was a strong interior team this year, as both Tarik Black and Jamari Traylor also had positive value seasons in the interior. KU’s five starters all produced over 10 points a game. Naadir Tharpe shot the ball well on a limited frequency. The two biggest offensive letdowns were off-ball freshmen guards in Wayne Selden and Conner Frankamp.
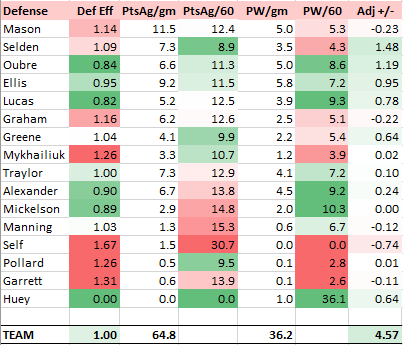
Defense:
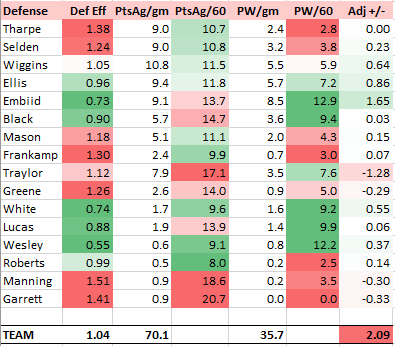
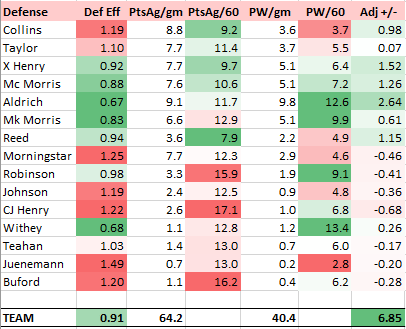
The team’s defense was Coach Self’s weakest to this point while at Kansas. The best defender was Joel Embiid, an excellent shot blocker and rebounder. Both Perry Ellis and Andrew Wiggins played good enough defense, but what was most disappointing was the effort from role players on the roster. KU didn’t need guys like Naadir Tharpe or Jamari Traylor to focus on scoring. They both should have done better on this end.
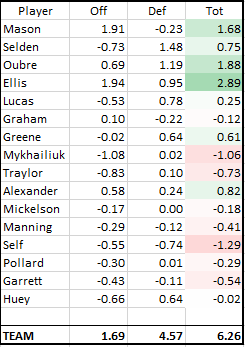
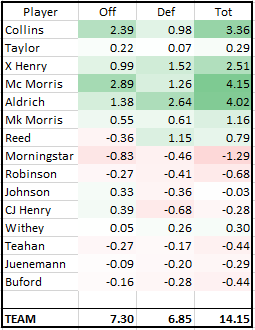
Adj. PPG +/-
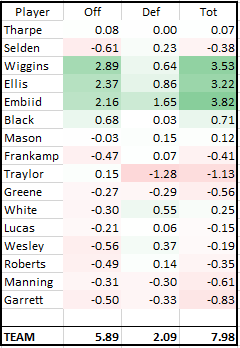
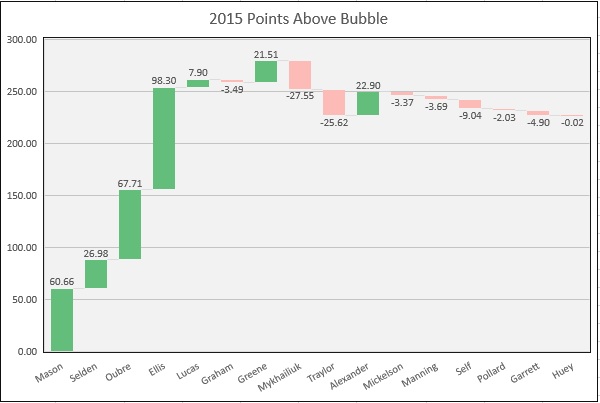
Kansas was led by three star players; Embiid, Wiggins, and Ellis. Two of these three would be top-three picks in the 2014 NBA draft, and Ellis would go on to have an excellent college career. The guard play was noticeably mediocre. Starting PG Naadir Tharpe had some excellent shooting games in 2014, but also had down games as well. His average score was right at bubble-level. Tharpe would be benched during the tournament due to poor play, and his two replacements in Frank Mason and Conner Frankamp would go on to post slightly-above and slightly-below replacement seasons. Wayne Selden would also produce a below-value season as a freshman.
The TEAM’s offense-defense value-difference of +3.80 (meaning its offense was 3.80 points better relative to its offense) was the widest offense-dominant team that Self had to this point (2017, 2018, and 2022 would all be wider). This was likely due to a prominent number of skilled scorers and large number of underclassmen who hadn’t learned to defend yet.
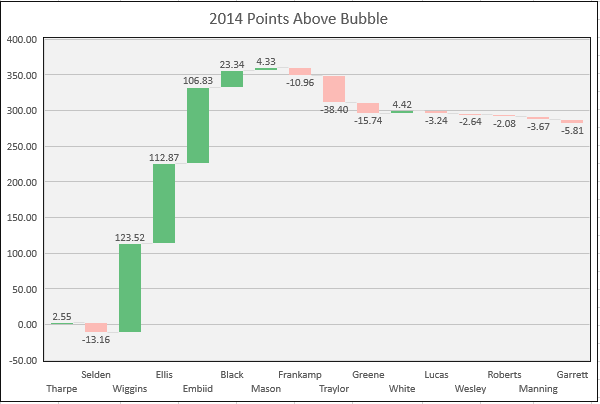
Two Lottery Freshmen, Two Value Leaders
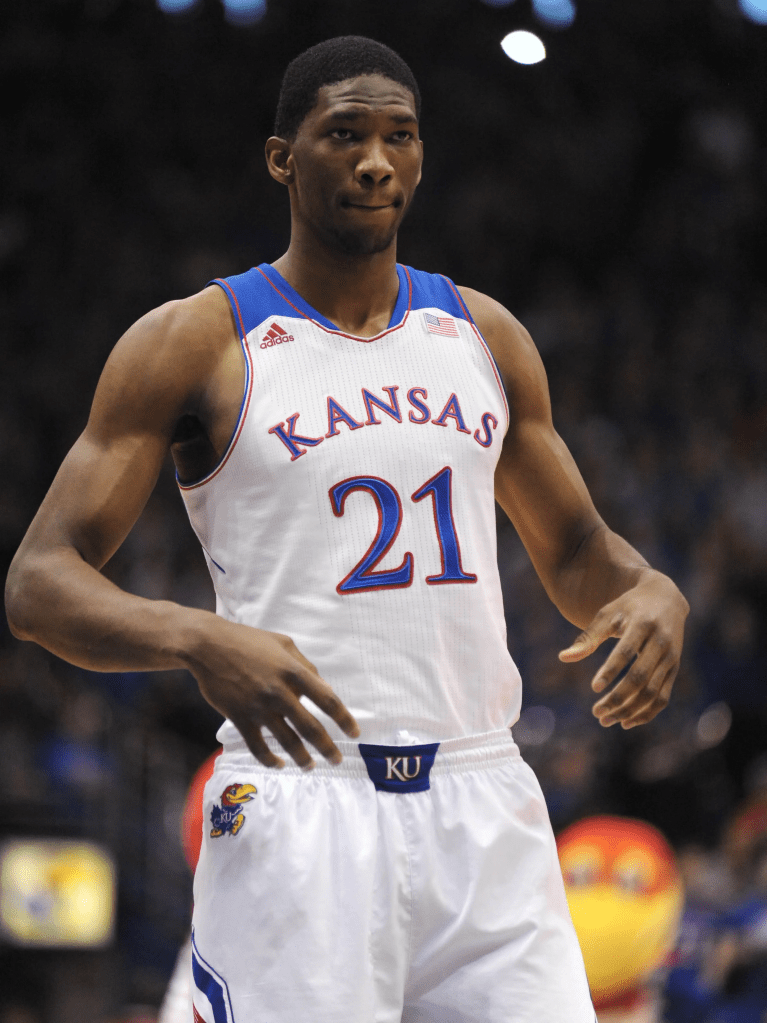
Joel Embiid was KU’s most valuable player on a per-game basis, thanks to his efficient scoring and strong interior defense. He added positive, above-bubble value in 22 of the 28 games he played in (78.6%). His best game in a Jayhawk uniform was against New Mexico in the Sprint Center.
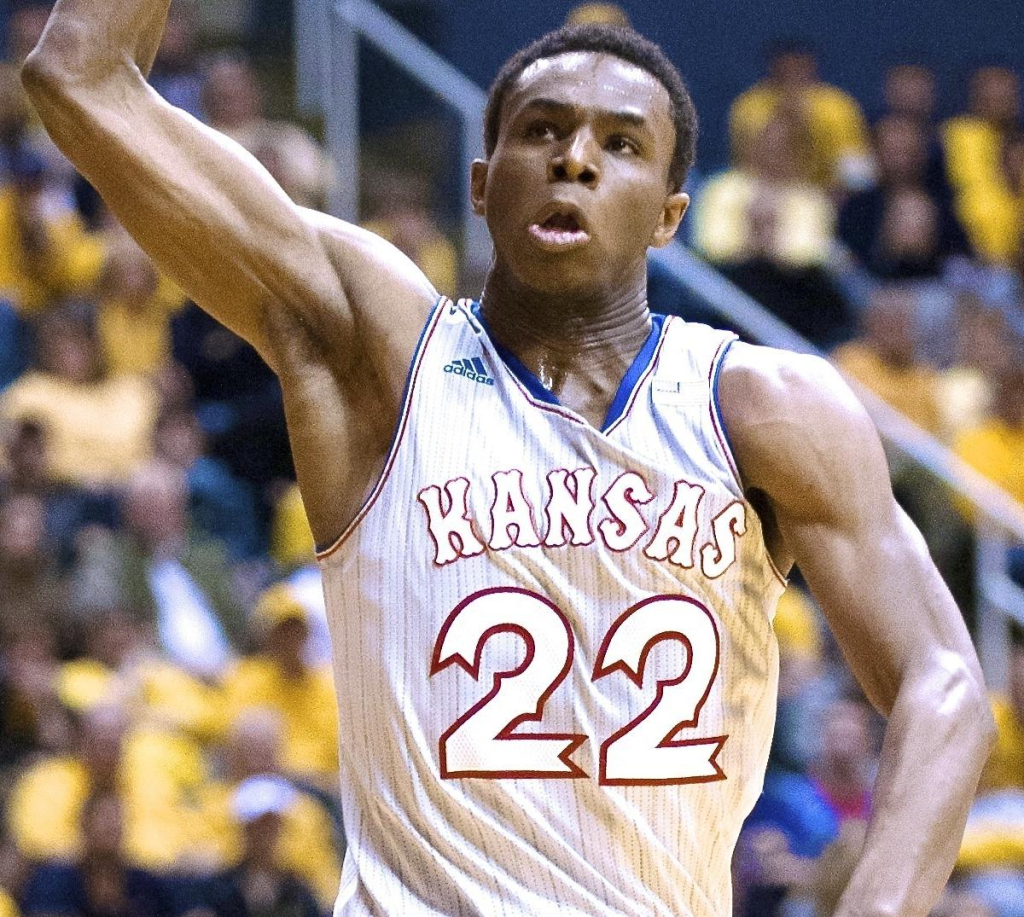
However, Andrew Wiggins was more durable. He played in all 35 of Kansas’ games, providing the most value from a total perspective. He also had the best game of any Jayhawk in the 2014 season, posting a +18.83 value score in his 41-point performance against West Virginia in Morgantown in the final regular season game of the season. Wiggins would also lead the team with 11 game MVPs.
The 2014 team in retrospective:
The 2014 team came in with a lot of hype, and although it wasn’t to live up to it, it’s two best prospects were. The negatives are obvious. Not getting past the first weekend. Poor guard play. Double-digit losses. But on the flip side, this team extended the conference-title streak to 10. When healthy, the team was very tough to beat. It had incredible depth and a number of guys who might have been overlooked during this season would go on to have great careers at Kansas.
WAR rankings. Here are the Wins Above Replacement for the 2014 season:
- Andrew Wiggins +5.08
- Perry Ellis +4.54
- Joel Embiid +3.92
- Naadir Tharpe +1.45
- Tarik Black +1.27
- Wayne Selden +1.04
- Frank Mason +0.91
- Andrew White +0.28
- Landen Lucas +0.06
- Conner Frankamp 0.00
- Justin Wesley -0.03
- Niko Roberts -0.04
- Evan Manning -0.09
- Christian Garrett -0.15
- Brannen Greene -0.20
- Jamari Traylor -0.33
NCAA Tournament:
The 2014 team earned a 2-seed and drew 15-seed Eastern Kentucky in a closer-than-expected game. In the end, KU turned to the effort and energy of Jamari Traylor to win the game down the stretch. Traylor would go for 17 and 14, adding 6.29 points of value above bubble for the game in his only team-MVP game of the year. This game is sometimes overlooked, but it was good to win because of how bad of a loss it would have been. Unfortunately, Kansas didn’t play well in its next game as it would fall to 10-seed Stanford.