Examining Historic Conference Strength
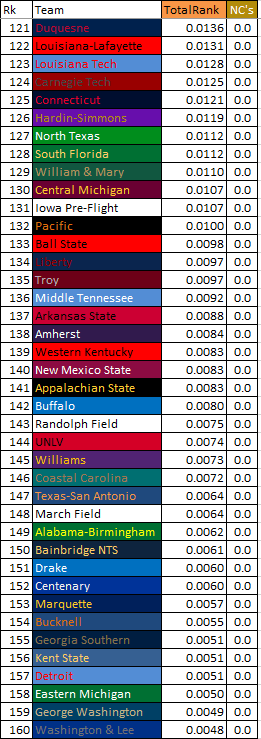
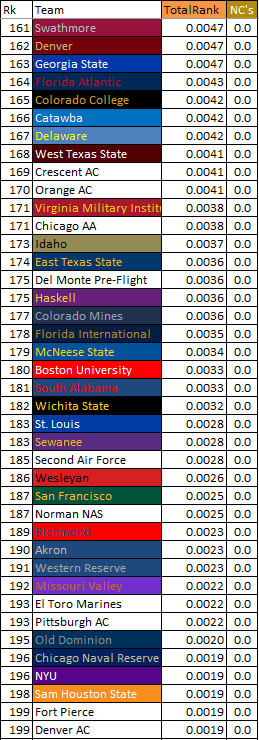
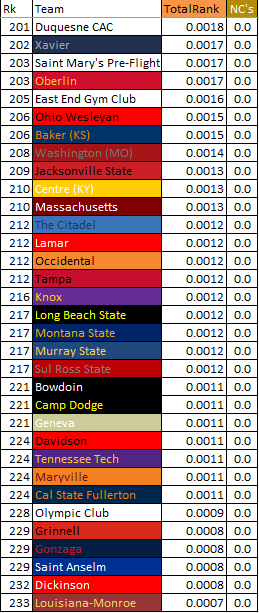
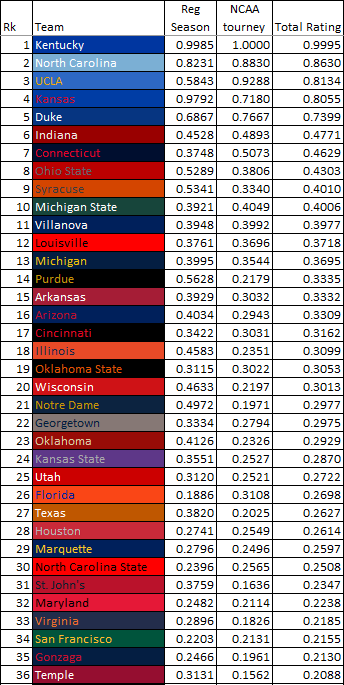
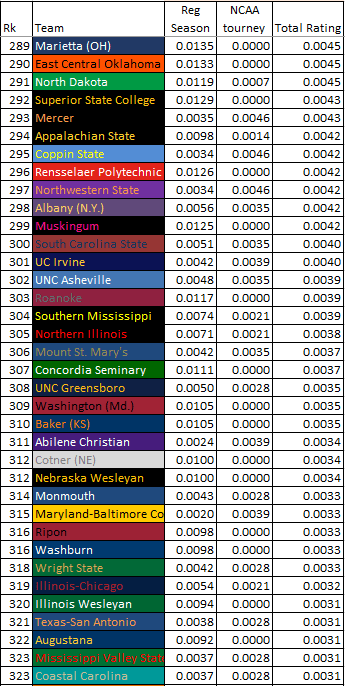
Above are the College Football Program ratings for the 233 programs which have either finished as a ranked team or made it to one FBS bowl game during one of the 155 seasons of college football. The logic behind this rating system is to quantify college football’s unique competition format, which has historically been to decide the best teams in the sport through polls and post-season bowl games. Points are awarded to teams in the final polls of the season on a declining method (#8 earns more points than #9 and so on). Bowl games are tiered based on prestige and quality of opponent, with the bowl winner receiving more bowl “points” than the loser (bowl appearances still net a program some points).
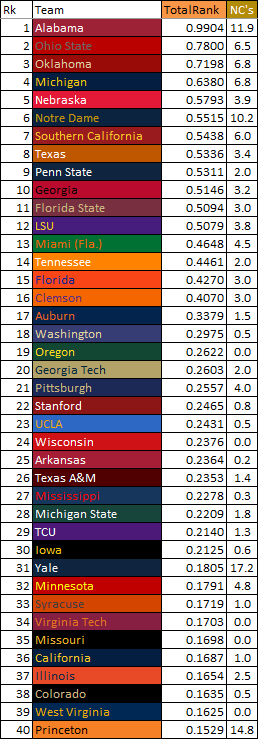
The Total Rank column is the central number which combines all relevant data for a certain program, with the highest possible score being 1.0000. Alabama is thus the #1 college football program with a score just below 1.0000. Its 42 bowl wins and 70 bowl appearances top the sport, and it has made 9 college football championship games in the BCS/CFP era, winning 6 times. Regarding postseason play, none comes close to Alabama.
The regular season component of this ranking, based on final poll results, sees Michigan in first, followed closely by Notre Dame and Alabama. The official polls began in the 1930’s, and served as the decider for national championships for much of the sport’s history. Retroactive national championships through various ranking services have also been used in determining the better programs in the earlier years of college football. Additionally, computer-derived rankings were used to rank teams from years 1934 and prior.
The history of college football is also the history of America. The first ever game was between Rutgers and Princeton in 1869. Beginning in the Northeastern United States, college football was dominated by Ivy-league teams (specifically Harvard, Princeton, and Yale) for much of the first four decades of the sport. The sport began to spread westward, with programs around the Great Lakes in the Upper-Midwest beginning to become more and more competitive. Michigan won its first National Championship portion in 1901. The University of Chicago was also a power in this era, winning National Championship portions in 1905 and 1913.
The sport would continue to spread west, and south, as the years progressed. Our top-rated-overall program, Alabama, didn’t receive voting points until 1924 (the computer ranking placed them at #18 in 1924), and were named the National Champions of 1925 by the Helms Foundation among other rating systems. Dartmouth, the best in the Northeast that season, was the nation’s best according to other raters. During the World Wars, military instillations (i.e., El Toro Marines) sprang up with solid football programs which were able to compete with the best schools of that era, earning ranking points in the process. Since then, traditional football powers have emerged, with most being large public institutions with large fan-bases and plenty of money. The story of America’s history intertwines with the sport of college football.
This is as good a time to discuss national championships as any other. College football national championships have been decided in at least 6 distinct ways. The first way was through a variety of retroactive rating services. The services didn’t often agree, leading to a number of seasons with joint national champions. As poll ranking teams during the season began to emerge, the national champion ended up being whoever was ranked first at the end of the season. What is noteworthy is that this champion used to be decided before the bowl season, so there are multiple programs claiming national championships for seasons in which they still lost their bowl. There were still many split national championships during this time as different polls had different opinions on who was best.
The third era of deciding a national champion began in 1968, when the AP poll began voting after the bowl games to determine the nation’s best. Still, with traditional bowl affiliations often preventing the regular season’s best teams from facing off, split-championships continued to happen. In 1991, Miami (Fla.) and Washington were both voted #1 (by the AP and Coaches, respectively). With the desire to crown one true champion becoming a central focus, the sport began the process of entering its fourth era that next season.
The Bowl Coalition would begin the next season. This was a coalition between the top bowl games (Cotton, Orange, Sugar, and Fiesta) that would agree to place the 2 top-ranked teams against one another in one of their bowls, creating a de facto national championship game. The flaw in the system was that the Rose Bowl didn’t agree to participate, and would still take the Big 10 and Pac 10 champs regardless. The Bowl Coalition lasted 3 seasons, and was replaced by the Bowl Alliance which did the same thing. The 1997 season saw a true split-national championship, as Nebraska and Michigan both winning the #1 poll spot in a major poll.
The fourth era therefore officially begins with the Bowl Championship Series (BCS) era. At this point, the Rose Bowl joined the system. Through the BCS, college football would now place #1 and #2 in the national championship game each season. This system wasn’t without controversy, primarily in 2003 when AP #1 USC was left out of the BCS National Championship game in favor of LSU and Oklahoma. When the AP voters left USC as the nation’s best in their poll, the sport saw the very thing it wanted to avoid most–a split-national championship.
This didn’t happen again in the BCS-era, yet still controversy remained. People disliked the convoluted formulas which determined a team’s ranking (which was why #1 AP USC was left out of the 2003 championship game, their computer scores were below that of LSU and OU). Furthermore, many in the sport felt there were too many teams left out of having a chance to win a national championship. With only the top 2 teams getting to play in the BCS Championship game, this left very good teams (such as #3 and #4 overall) playing in consolation games.
In 2014, the CFP-era was born. This is the fifth era of college football, as the College Football Playoff would decide a champion. While the BCS was technically a (2-team) playoff, the CFP introduced a 4-team, expanded playoff system that allowed for twice as many teams to have a chance in the postseason. The formula-driven, BCS system for ranking teams was done away with and replaced through a committee approach. #1 plays #4 in one semifinal game, #2 plays #3 in the other. Then then winners of each game face off for the National Championship.
This season the CFP will expand to 12 teams, introducing yet another era in the sport. 8-seed Ohio State would have been left out a season ago, but the Buckeyes proved their mettle in the postseason to claim the program’s 6.5th championship. This is an odd way to count national championships, so let’s discuss how national championships are handled in this rating system.
The rating system works thusly: a program earns rating “points” that go either toward its regular season (polling) rank or its postseason (bowl/playoff) rank. So, if a team won a National Championship before the BCS-era, the program rating points would go in its polling score. And in the more-recent eras of college football, winning a National Championship earns the school rating points in its bowl/playoff score.
Since there are 155 seasons of college football, there must be 155 national championships to award. It is following this logic that the concept of “National Championship Shares” is introduced. Think in terms of currency, where a National Championship share is money. Basically, each season = 1 National Championship. In years which there is a reasonably-disputed National Championship (sorry 2017 UCF), this 1 National Championship gets split among the teams with a reasonable claim to the Title. In many seasons, this would mean two teams each getting 0.5 NCS. However, in earlier eras, this might mean one team getting 0.5 NCS, whereas two others get 0.3 and 0.2.
The far right column, labeled NC’s, lists these shares by program. It will almost certainly be different from that program’s claimed National Championships. The best program, Alabama, has 11.9 NCS. This is actually third behind Yale (17.2) and Princeton (14.8). While Alabama is below those programs in NCS, it is above them in overall rank. The Ivies are no longer in the upper echelon of college football (FBS), and are therefore stuck-in-place as it were, not earning any additional rating points yet still in the rankings as a relic of a distant era of the sport.
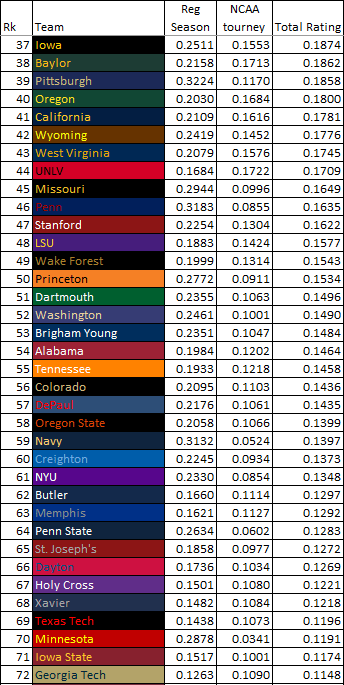
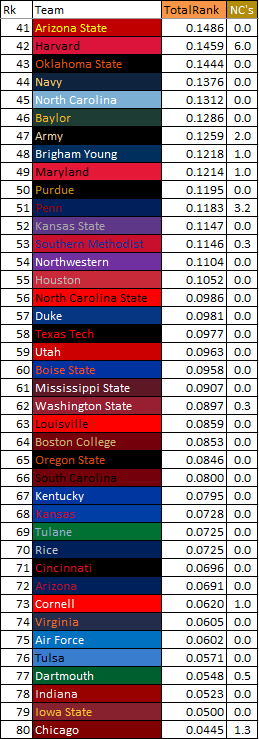
The Kansas Jayhawks football program checks in at #68. It is one of the lower-ranked Power-5 programs, but is still ahead of a P5 teams (including Virginia, Iowa St., Wake Forest, and Vanderbilt). KU’s mere 14 bowl appearances have hurt it given how frequently other programs tend to go. Not going to a bowl game for 14 seasons has been rough on the program. Take a program like #50 Purdue, which has 21 bowl appearances. The Boilermakers, though not great, have been more consistent in their history.
To compare two programs, simply divide one program’s Total Rank score by the other’s. This allows us to quantify the difference between the two programs in a multiplicative way. The following are a few selected comparisons between KU and some other programs of note. For any score below, 1.0000, KU is worse and for any score above 1.0000, KU is the better program. The inverse of these numbers will compare how much better (or worse) that team is compared to KU.
KU is 0.6346 of Kansas State.
KU is 0.4285 of Missouri
KU is 0.1256 of Nebraska
KU is 1.4564 of Iowa State
KU is 2.4065 of Vanderbilt (worst-rated P5 school)
KU is 109.3537 of Louisiana-Monroe (worst-team to have made a bowl)
Historically Kansas has not been a great football program, but it should still see itself as better than where it is. Note that, despite having a winning record all-time against Kansas State, the Jayhawks are only 64% as successful when it comes to being ranked in the polls and going to/winning bowl games.
The fall of the Nebraska Cornhuskers is noteworthy. As recently as 2007, Nebraska was ranked #1 in this system. The Huskers had won proto-BCS national championships in 1994 and 1995 (and split in 1997), producing for itself a lead in bowl “points.” In other words, it had won the highest number of prestigious bowls in the history of the sport; bowls that actually were a huge factor in determining national champions. But, since that time, in the BCS and CFP era, they’ve been passed by teams that have won more high-tier BCS/NY6 bowls and those that have been BCS/CFP National Champs.
Oklahoma was briefly #1, in the three seasons from 2008-2010, before Alabama took control after 2011. The Sooners haven’t been bad in the past 12+ seasons; Alabama has been that good.
A strange interplay between programs with strong polling history (Michigan, Notre Dame) and the rest of the top-level teams has also taken place. In 2007, Michigan was #7 and Notre Dame #13. Today, they sit at #4 and #7 despite neither having won a National Championship in that time. This comes at the expense of programs like Texas and Miami (Fla.), programs which have dropped out of the Top-10 over the past 15 years.
Basically, Michigan and Notre Dame have improved by maintaining a strong polling score while the bowl/postseason score becomes worse for everyone not named Alabama (and Ohio State). The current rankings reflect 2 huge areas of value. First and foremost, how frequently can you win National Championships (then appear in them, then make the top 4, then make the NY6)? Secondly, how strong is your program’s poll history? Being consistently highly ranked 100 years ago is just as important as being consistently highly ranked today.
In closing, this rating system contains a logic behind it that captures the uniqueness of college football and rates programs so that they can be compared against one another. As the sport of college football continues to change, the rating will be altered to ensure it fits with the time, while still maintaining the illustrious history and eras of the sport.
“| Line | Team | Rating |
|---|---|---|
| 1 | Alabama | 20.26 |