
First the raw numbers…
Outside sources:
McCormack 2021: 13.0 PPG, 2.5 O RPG, 1.1 APG, 1.6 TPG, 22.7 MPG with 50.2% FG, 79.8% FT. 54.9% TS. OBPM 4.7. 28.6 Usage. PRPG! 3.2.
Azubuike 2020: 13.7 PPG, 3.5 O RPG, 0.9 APG, 2.5 TPG, 27.7 MPG on 74.8% FG, 44.1% FT. 68.5% TS. OBPM 7.2. 23.5 Usage. PRPG! 4.2.
Charting the Hawks:
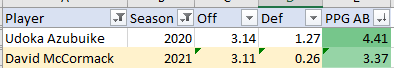
McCormack 2021: 1.26 Adj PPP w/ 12.1 PpPG. 0.70 Off_Imp score. +2.01 Off Prod +1.10 Off Eff = +3.11 Off PPG +/-
Azubuike 2020: 1.52 Adj PPP w/ 12.0 PpPG. 0.54 Off_Imp score. +1.26 Off Prod +1.88 Off Eff = +3.14 Off PPG +/-
Analysis…
Doke clearly bests McCormack in a few areas. FG% is the obvious one. Offensive rebounding is also a relatively large difference in favor of Doke. But D-Mac holds his own. He not only dishes more assists per game despite playing fewer minutes, he is also considerably better at not turning the ball over. D-Mac’s 0.7 A/TO ratio is nearly double that of Doke’s 0.4. D-Mac’s 80% FT shooting also closes the gap. It stands out when contrasted to Doke’s abysmal FT ability.
Another area McCormack adds value in is usage. The fundamental question in analyzing offensive player value is how to incorporate production and efficiency. Obviously both are important. But they work against each other. The more productive a player his, the more his efficiency will decline as he is asked to carry more of an offensive load. And the more efficient a player seeks to be, the more he sacrifices his production. Doke never shot outside of 5 feet. This made him hyper-efficient, but limited his scoring chances. D-Mac has a much more versatile offensive game, which leads to more missed shots and lower efficiency. On balance, both players offered similar value on that side of the ball.
Some Explanation on Terms…
OBPM gauges efficiency more than production, whereas PRPG! (Torvik) and PPG +/- incorporate both. PRPG! is not purely offensive, it also takes into account defensive stats such as defensive rebounds, steals, and blocks. It is limited when compared to PPG +/-, but good for the statistical info it receives. PpPG stands for Points produced per game; it incorporates assists generated and assists received. Doke relied on risky entry passes more than D-Mac has, but as both players receive more assists than they generate their PpPG will be lower than their raw PPG numbers. The Offensive Impact score is a pure usage number that takes into account all possession deciders—made shots, missed shots, assists, rebounds, turnovers—to gauge how active a role a player has on offense.
Further analysis…
For those who remember Doke as more dominant than these figures seem to indicate, no need to worry. Your memory is likely correct. What is provided above is season-long stats, but Doke’s 2020 season was special due to the stretch run during the back-half of conference play. Doke’s total PPG +/- was +4.41 in the 2020 season, which is of course a very good score. But his final 10 games, all against Big 12 competition, was at +6.24. He was playing his best when it mattered most, and in most years he would have 5 to 9 games more to prove his dominance.
But McCormack in 2021 is also playing great during this late-season stretch; his PPG +/- is +5.57 over his last 10. The offense is run mostly through him in the post, he doesn’t have a Devon Dotson at PG to make plays, and his passing and ball-handling have improved alongside his ability to finish inside. It will never be at Azubuike’s level, but on the flip side he can do things Doke couldn’t.
Getting back to Doke before we close, part of the reason his numbers were down during the beginning of the season was due to, of all things, David McCormack. The 2-big system the 2020 team trotted out to start games didn’t work too well against quality competition (it worked great against sub-150 teams). Doke’s offensive numbers were hurt by playing in inefficient lineups some of the time. The last time Doke and D-Mac both started together was the home K-State game on January 21. After this game, they would rarely (if ever?) share the court together, which coincided with Doke’s dominant run. However, it should be said that even during the part of the season when both started, Self would play 4 guards more often than the 2 big lineups. 2021 McCormack has played his minutes exclusively in line-ups complementary to his style, whereas 2020 Doke did so about 80% of the time. So lineup style is a factor in explaining the surprising stat showing both being equal offensive players, but only to a mild degree. The take-away should be that McCormack is actually a very good offensive talent his junior season.

