Through the 2025 NCAA Tournament, this post examines all 40 seasons of the 64-team bracket (which began in 1985)1, specifically focusing on how seed-lines have performed in comparison to each other. Yes, the bracket has technically expanded to 68 teams, but effectively it is still a 64-team format. It’s just that there are four extra, play-in games (two between the four worst automatics, two between the four worst at-large teams) to determine the final 64 teams.
Round of 64 Results
40 tournaments, with 4 regionals in each tournament, mean there are 160 total seeds in this time. 160 1-seeds (Kansas has 16 of these2), 160 2-seeds, etc. It also means that there have been 160 First Round games featuring seeds which add up to 17 (1 v. 16, 2 v. 15, etc.). Here’s how these match-ups have turned out over the past 40 tournaments.
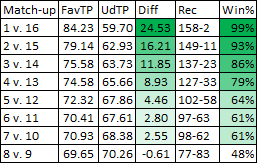
The 1-seeds average 84.23 points and allow 59.70, for an average difference of 24.53 points. They have gone 158-2 overall, winning 99% of games against the 16-seeds. From here, we see a drop-off for the favorite as the seeds converge until we get to the 8/9 match-up which is virtually even.
There appears to be a steady drop-off in success by favored seed until you get to the 5-seed, which doesn’t even win 2/3 of its games against the 12. The next chart compares each Round of 64 favored seed to the next seed down and produces a multiple. For instance, how much more likely is it that a 1-seed wins than a 2-seed? Or rather, how much more likely is it that a 2-seed gets upset than a 1-seed?
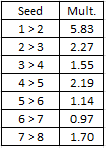
This shows that the biggest drop-off in terms of avoiding a First Round upset is from the 1-line to the 2-line. 1-seeds are 5.83x more likely to make it to the Second Round than 2-seeds. After that, there are smaller differences when you step down a seed-line. Because these are multiples, one can multiply down the line to compare seeds that aren’t next to each other. For instance, in order to find out how much more likely a 12/5 upset is than a 15/2, simply times 2.27 by 1.55 by 2.19. This gets 7.70. In other words, a 2-seed is over 7 times more successful at winning in the Round of 64 than a 5-seed is.
KU Focus R64
KU has earned 16 1-seeds, 7 2-seeds, 5 3-seeds, 6 4-seeds, 1 5-seed, 2 6-seeds, 1 7-seed, and 1 8-seed in the modern tournament era. This accounts for 39 out of 40 years, as the Jayhawks didn’t make the 1989 NCAA Tournament. In that time, KU has won 36 games (36-3). It’s projected record, given its seeds, is actually 34.3-4.7. So, KU has overachieved in this round. People may remember Bucknell and Bradley, but in terms of big upsets, that’s all there’s been. Don’t take for granted how good KU has been in avoiding opening round disappointments.
Round of 32 Results
The Second Round features games that can only be between these pods of seed-lines:
- 1/16 v. 8/9
- 4/13 v. 5/12
- 3/14 v. 6/11
- 2/15 v. 7/10
Of these possible matchups, only the 16 v. 8 game has never occurred. In the only two times the 16-seed defeated the 1, the 9-seed won its matchup against the 8. The winning percentage by seed-line in this round is as follows:
- 1-seed: 86%
- 2-seed: 68%
- 3-seed: 61%
- 4-seed: 61%
- 5-seed: 54%
- 6-seed: 48%
- 7-seed: 30%
- 8-seed: 21%
- 9-seed: 10%
- 10-seed: 40%
- 11-seed: 43%
- 12-seed: 38%
- 13-seed: 18%
- 14-seed: 9%
- 15-seed: 36%
- 16-seed: 0%
This trend begins reasonably enough, with the 1-seed being more successful than the 2-seed and so on. But once we get to the 10-seed, the winning percentage spikes back up. Even the 15-seed has won 36% of its Round of 32 games. Sure, it doesn’t get there that often, but it is 4-7 in this round (while the 9-seed is 8-75).
This is where the structure of the bracket has an effect on how seeds perform. 8’s and 9’s are generally better teams than the double-digit seeds below them, but have a tougher opponent as they face the 1-seed 99% of the time in this round. This causes the 8/9 winner to lose its Second Round game at such a high rate.
One way to look at the Round of 32 is to see which teams get through this round by grouping. We will look at each pod of teams and hope to gain some clarity.
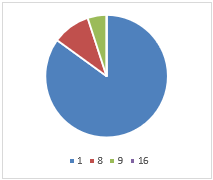
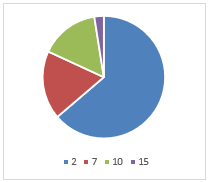
1/16/8/9
- 1-seed: 136 (85%)
- 16-seed: 0 (0%)
- 8-seed: 16 (10%)
- 9-seed: 8 (5%)
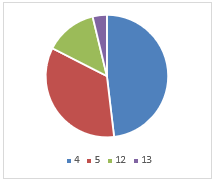
4/13/5/12
- 4-seed: 77 (48%)
- 13-seed: 6 (4%)
- 5-seed: 55 (34%)
- 12-seed: 22 (14%)
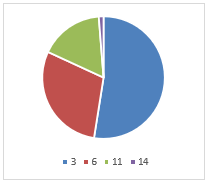
3/14/6/11
- 3-seed: 84 (53%)
- 14-seed: 2 (1%)
- 6-seed: 47 (29%)
- 11-seed: 27 (17%)
2/15/7/10
- 2-seed: 102 (64%)
- 15-seed: 4 (3%)
- 7-seed: 29 (18%)
- 10-seed: 25 (16%)
Looking at all these pie-charts next to each other, we can see how much more likely it is for the 1-seed to win than for any other of the better seeds in these First Weekend pods. In terms of getting to the Second Weekend, it better for a team to be a 10 or 11-seed rather than an 8 or 9-seed.
KU Focus R32
This round has infamously been a difficult round for Kansas. In the Self-era, KU is 11-7 in the Round of 32 and 1-4 since 2019. Since 1985, KU is 23-13 in this round, and has failed to make this round 3 other times (2 R64 losses, 1 NCAAT miss). Given KU’s seeds, we’d expect KU to have been to 24.8 Sweet 16’s, indicating that KU is underperforming its seed-line through the First Weekend. Since we know that KU outperformed its First Round record by 1.7 games, we come to the calculation that KU has underperformed in the Round of 32 by 3.5 games. In other words, KU’s 23-13 record should be something like 26-10. Specifically, its multiple losses as a 1-seed (’92, ’98, ’10, ’23) and a 2-seed (’90, ’14, ’15) in this round have been major disappointments and contributed to the gross underperformance.
Sweet 16 Results
The Sweet 16 games begin the Second Weekend, with the bracket starting to winnow down as we approach the Final Four. It is when games tend to get tougher for 1-seeds (who will likely face a 4/5), and where a variety of potential match-ups can occur. The 2 vs. 3 matchup is the second-most-common (behind 1 vs. 4), but it has only happened 31.9% of the time in 160 regionals since 19853.
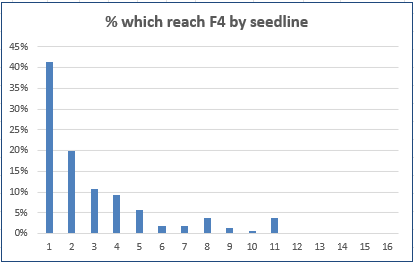
In order to best understand this round, we’ll consider which seeds make the Elite 8 what percent of time.
- 1-seed: 67%
- 2-seed: 45%
- 3-seed: 26%
- 4-seed: 16%
- 5-seed: 8%
- 6-seed: 11%
- 7-seed: 6%
- 8-seed: 6%
- 9-seed: 3%
- 10-seed: 6%
- 11-seed: 6%
- 12-seed: 1%
- 13-seed: 0%
- 14-seed: 0%
- 15-seed: 1%
- 16-seed: 0%
Somewhat illuminating is the fact that only the 1-seed is more likely than not to make it past the Sweet 16. And while the 2-seed is close to a 50% chance, this number drops to 1-in-4 for the 3-seed. Of the 640 seeds between 13-16 since 1985, only 1 has made the Elite 8 (2022 Saint Peter’s).
Let’s look at this Sweet 16 match-up from the perspective of the 1’s and 2-seeds. In other words, if a 1-seed makes this round, which seeds are they likely to face?
- 4-seed: 46%
- 5-seed: 37%
- 12-seed: 15%
- 13-seed: 3%
A full 82% of the time the 1-seed gets to the Sweet 16 it will face a 4 or 5-seed. For the 2-seed, here are its opponents by likelihood.
- 3-seed: 50%
- 6-seed: 31%
- 11-seed: 19%
- 14-seed: 0%
Similarly, 81% of the time it makes it through to the Sweet 16, a 2-seed faces off against a 3 or 6-seed. Only rarely will it get a double-digit seed in the Sweet 16.
KU Focus S16
KU is 16-7 in this round, which is better than its record in the Round of 32. For Bill Self at Kansas, his teams have a 9-2 record, further cementing the idea that he excels in the tournament games he has more time to prepare for. KU has won its last four in a row playing in this round. Only 2 of these wins were when KU was a 4-seed or worse (1988, 2004), and only once has KU won in this round as a seed-line underdog (1991). One of KU’s most devastating losses happened in this round as well (1997). Overall since ‘85, KU has outperformed seed-expectation by 1.3 games in Sweet 16 contests.
Elite 8 Results
There have been 160 Elite 8 games since 1985. The Elite 8 is the last round to ensure that no two teams of the same seed-line face each other. 107 of these games include a 1-seed, which is the most-likely seed (by far) to make this round. The 2-seed is also frequently at this game, having been there 72 times since 1985.
However, the 1 v. 2 match-up has only happened 51 times, or 31.9% of the time. There have been years when it didn’t occur at all (such as 2022 and 2023). Other oddities of this round include the fact the only 15-seed to make the Elite 8 faced not a 1, 4, or 5-seed but an 8-seed. Since the 14-seed has never made this round, the 1-seed has never faced it either. Here are a list of seeds that each seed-line hasn’t faced in this round that are possible (italics indicate seed has never made E8):
- 1-seed (14-seed, 15-seed)
- 2-seed (13-seed, 16-seed)
- 3-seed (12-seed, 13-seed, 16-seed)
- 4-seed (14-seed, 15-seed)
- 5-seed (7-seed, 11-seed, 14-seed, 15-seed)
- 6-seed (9-seed, 12-seed, 13-seed, 16-seed)
- 7-seed (5-seed, 9-seed, 12-seed, 13-seed, 16-seed)
- 8-seed (10-seed, 11-seed, 14-seed, 15-seed)
The 11-seed, which has made a surprising number of Elite 8’s (10), has faced the 1-seed (8 times) a 4-seed and a 9-seed once, but never the 5. The most likely match-up to occur that hasn’t yet is the 5 v. 7. 7 v. 8 is also somewhat likely to occur for the first time in the Elite 8, although it has occurred in later rounds.
Looking at Elite 8 win results is the same thing as showing Final 4 appearances, so we will include the following table:
We’re again struck by the 1-seeds’ relative dominance. While it is more likely than not the 1-seed gets upset before it makes the Final Four, over 2 in 5 1-seeds have made the National Semifinals. More 1-seeds have made the Final Four as have seeds 3 or worse.
KU Focus E8
This is another stressful round for KU fans due to recent history. Since 1985, KU is 10-6 in the Elite 8, having won its most recent two games. Self is 4-5 overall in this round, with Brown and Williams going a combined 6-1 before Self took over. Given KU’s seed-lines, KU has out-performed the Elite 8 round by 1.2 games. Even with Self’s struggles, KU has been a solid Elite 8 team overall in the modern NCAA Tourney era.
Final 4 Results
The Final Four is the first round in which seed-lines can face off against each other, something that happens with some frequency with 1-seeds and almost never with other seeds. Let’s look at who the 1-seeds face when they make the National Semis:
- 1-seed vs. 1-seed (15 times, or 30 total 1-seeds)
- 1-seed vs. 2-seed (12 times)
- 1-seed vs. 3-seed (7 times)
- 1-seed vs. 4-seed (7 times)
- 1-seed vs. 5-seed (2 times)
- 1-seed vs. 7-seed (3 times)
- 1-seed vs. 8-seed (1 time)
- 1-seed vs. 9-seed (1 time)
- 1-seed vs. 10-seed (1 time)
- 1-seed vs. 11-seed (2 times)
Counting each contest, being sure to count the 1-seed vs. 1-seed games twice, this reconciles us with the 66 total 1-seeds to make the Final Four. 1-seeds have obviously gone 15-15 against each other in these matchups. In the other 36 matchups, where a 1-seed faced a worse seed, the top seeds went 26-10 (72.2%). The last time a non-1-seed defeated a 1-seed in the Final Four (National Semifinal round) was in 2014 (Connecticut over Florida). Since that time there have been 10 straight wins in this round by the top seed when facing a worse seed.
In addition to 1-seeds playing each other 15 times; 2-seeds have faced each other 3 times, 4-seeds once, and 5-seeds once. 3-seeds have never faced each other in the National Semis.
In terms of winning percentage during the Final Four, the seeds with the best success are the 6-seeds (2-1, 67%) and the 8-seeds (4-2, 67%). The 1-seeds win 62.1% of their National Semifinal contests, in large part due to the fact they often play each other (as we showed above, 1-seeds are 72.2% winners against non-1-seeds) whereas 6 and 8-seeds don’t.
A different way to look at the Final Four round is to look at how many of each seed makes the Championship Game. Of the 78 teams to have won in the Final Four (and thus made it to Monday night), 50% of them have been 1-seeds. Here is the rest of the break-down by seed-line:
- 1-seeds: 41 (51%)
- 2-seeds: 13 (16%)
- 3-seeds: 11 (14%)
- 4-seeds: 4 (5%)
- 5-seeds: 4 (5%)
- 6-seeds: 2 (3%)
- 7-seeds: 1 (1%)
- 8-seeds: 4 (5%)
After the top 3 seeds, there isn’t much difference between the remaining seeds. The 8-seeds appear to be overrepresented, especially when you consider that no 9-seeds have made the Title Game.
An all 1-seed Final Four has occurred twice (2008, 2025), while a no-1-seed Final Four has occurred three times since 1985.
KU Focus F4
KU has made 10 Final Fours in the modern tournament era. This puts it third, behind Duke (14) and North Carolina (12). KU has gone 6-4 in this span, and it has won 4 of its last 5 National Semifinal contests. Interestingly, KU has faced only 6 different teams in this round since 1985. It has played North Carolina three times, Duke twice, Villanova twice, and Maryland, Ohio State, and Marquette once. And this is just in relation to the Final Four round. The Championship Game has seen KU face off against Duke and North Carolina as well during this time period. Given its seeds over the years, KU’s 6-4 record has put it 0.0 games against normal in this round.
National Championship Results
The National Championship game is distinct from the Final Four or National Semifinal round despite being played at the same place. Many get this confused for some reason, or ignore the magnitude of winning a Final Four game just to get to the National Championship game. There have been 40 National Championship games in the modern tournament era. Here are the teams who have won (total titles in parentheses):
- Connecticut (6)
- Duke (5)
- North Carolina (4)
- Kansas (3)
- Kentucky (3)
- Villanova (3)
- Florida (3)
- Louisville (2)
- UCLA (1)
- Indiana (1)
- Syracuse (1)
- Michigan State (1)
- Michigan (1)
- Arkansas (1)
- Arizona (1)
- Virginia (1)
- Maryland (1)
- Baylor (1)
- UNLV (1)
What we should first note is that the 1-seeds have dominated National Championships. 1-seeds have collectively won 65% of the Titles, or 26 of 40. The other 14 titles were won by 2-seeds (13%, 5 titles), 3-seeds (10%, 4 titles), 4-seeds (5%, 2 titles), 6-seeds (3%, 1 title), 7-seeds (3%, 1 title), and 8-seeds (3%, 1 title). The 5-seed has never won.
1-seeds have faced off against each other 10 times, obviously going 10-10 in these contests. In the other contests, those of a 1-seed against a non-1-seed, the 1-seed’s record has been 16-5 (76.2%). This dominance is quite significant and helps to explain why 1-seeds appear to be overachieving their National Title numbers. However, this holds if we look at Title Games without 1-seeds.
In the 29 National Championship games which saw two different seeds face off against each other, the better seed’s record is 22-7 (75.9%). This seems to be remarkable. In the first four rounds of the entire tournament since 1985, seed-favorites have only won 71.5% of their games. In other words, seed-upsets are more common the first two weekends than in the final weekend, even though there are multiple seed-lopsided games in the earlier rounds of the tournament (1 v. 16, 2 v. 15, etc.). One would expect more 2-seeds and 3-seeds to defeat 1-seeds, or more 3-seeds and 4-seeds to defeat 2-seeds in the National Title game. But it happens relatively rarely. It was mentioned that 1-seeds have faced each other 10 times in the National Championship game since 1985, but we should add that once have 3-seeds faced each other for the Title (Michigan/Seton Hall in 1989). In 40 64-team Tournaments, never have two 2-seeds faced each other in the National Championship game. This seems almost impossible.4
The average game margin has been 8.7 points. The closest games were 1-point differences (1987, 1989), and the 2008 game was an overtime game decided by 7 points after 45 minutes. The biggest blow out was 30 points (1990). Of all rounds, the National Championship round has seen the closest end-of-game margins, so there’s an argument to be made that the best games have been in this round.
KU Focus NC
KU has played in 6 National Championship games since 1985. These games, in order, are as follows:
- 1988. (6) Kansas 83, (1) Oklahoma 79
- 1991. (3) Kansas 65, (2) Duke 72
- 2003. (2) Kansas 78, (3) Syracuse 81
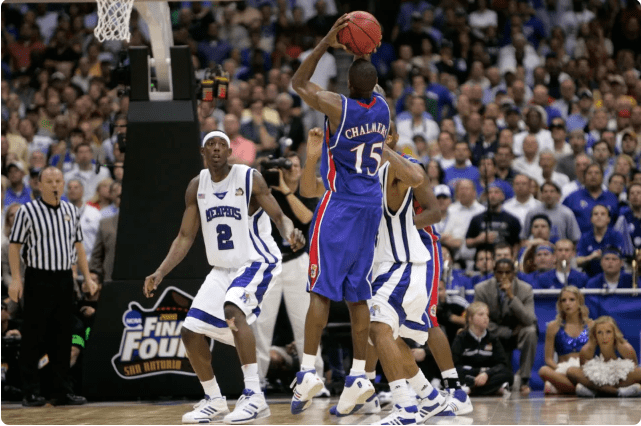
- 2008. (1) Kansas 75, (1) Memphis 68
- 2012. (2) Kansas 59, (1) Kentucky 67
- 2022. (1) Kansas 72, (8) North Carolina 69
KU has gone 3-3 in the National Championship game in the 64-team era. All 6 of its games have been decided by single-digits. These games have been exciting.
If we consider KU’s seeds over the years, we’d expect them to have won 3.0 National Championship games in this span, which is right where they are. In spite of disappointing losses, “coulda, woulda, shoulda” games, and upset defeats; KU’s 3 national championships are no underachievement. In total, KU overachieves in getting past each round except the Round of 32 and Elite 8. Combined with the fact KU already gets great seeds to begin with, KU’s achievements in March Madness since 1985 have been elite.

3 NCAA Tourney MOP’s in the 64-team era.
- Seeding began in 1979 for a 48-team tournament, so there is more data that could be used. However, we will stick with 1985 as the beginning of our exercise for a few reasons. One, the bye-game that the top 4-seed received into the Round of 32 did affect the bracket. If seeds 1-4 had to play First Round games in these seasons, there would have been upsets that would have reverberated throughout the tournament. Two, 1985 is a great starting point because it closely aligns with two other modern innovations. The shot-clock was first used for the 1986 Tournament, and the 3-point line was first introduced for the 1987 Tournament. Therefore, the past 39 years mostly have what we would consider the modern game. A shot-clock, 3-point line, and 64-team bracket. ↩︎
- The 2018 season, in which KU officially vacated both their 1-seed and Final Four appearance, is included throughout the numbers in this post. While we don’t include these achievements when comparing KU’s status to other college basketball programs, we are keeping the 2018 results in this exercise for a few reasons. One, KU competed that season with the belief that their results were legitimate. Two, it makes things easier for our dataset. Three, the violation (money from Adidas rep to Silvio De Sousa’s guardian) is hardly a huge violation. Four, there’s a chance these vacated games get revalidated given the NCAA’s recent troubles in the court system. ↩︎
- The 1 vs. 4 Sweet 16 matchup happens 37.8% of the time. ↩︎
- If we accept that 2-seeds independently have a 16% chance of making the National Championship game, which is their actual total, then we’d expect 2-seeds to face off 3% of the time. In 40 seasons, we’d expect this to occur with a 65.7% chance. So, apparently it isn’t impossible for this not to occur yet. Still, we might expect 2-seeds to make the Title game more frequently than 16%, which if they did would improve their odds of having two 2-seeds face off in the NC game. Bump the 2-seed odds to 25% for a NC appearance, and there’s a 93.4% chance two 2-seeds would face each other in 40 National Title games. ↩︎