For 2024, KU’s roster will likely lose the following four players: Jalen Wilson, Kevin McCullar, Cam Martin, Gradey Dick. Of these four, three were starters in 2023 and logged serious minutes. Gradey is the most likely name to return despite having the highest draft potential, but as it sits today, we will project him going to the NBA after one season and leave him off the 2024 roster.
In the past 29 seasons, KU has returned 59% of its minutes played from the prior year. This is calculated by looking at a particular roster (say 2023), and calculating what percentage of possible minutes were logged by this roster in the season prior (which would be 2022 in the example). For 2023, KU returned 2022 starters in Jalen Wilson and Dejuan Harris. It also returned 2022 bench players such as K.J. Adams and Joseph Yesufu among a few others. Adding up these players’ 2022 minutes over total 2022 minutes, we calculate the 2023 roster had 37% of its minutes returning.
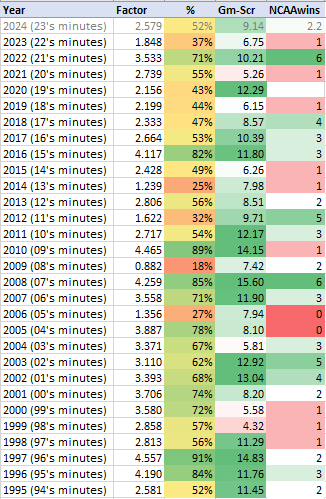
There is a small correlation between minutes returning and level of success. The R^2 is 0.2324. Judging success as the average game-score a certain roster produces, the best 5 Jayhawk teams in the past 29 seasons have been above the average returning minutes: 2008 (85% returning), 1997 (91%), 2010 (89%), 2002 (68%), and 2003 (62%). Of all the really-good Kansas teams, only the 2020 team (43% returning minutes) was noticeably below average. But even this is misleading. That 2020 team featured Udoka Azubuike, a senior by class who was injured for most of 2019. If you took Doke’s 2018 minutes played (the season in which he was mostly healthy), the returning minutes goes above 50%.
If we look at the correlation between returning minutes and NCAA success, there is a lower correlation (but still some with an R^2 of 0.0512). Looking at only the six Final 4 teams from this period, the teams had returning minutes of: 2022 (71%), 2018 (47%), 2012 (32%), 2008 (85%), 2003 (68%), 2002 (62%). In average, the Final 4 teams have 61% of returning minutes, slightly higher than non-F4 teams (58%). Again, low correlation here.
The 2024 outlook, as it sits today (3/22/23), would be that KU returns 52% of its minutes. If we project out this number to team success using historic rates over the past three decades, this would produce an average game-score of +9.14 (about a low-1/high-2 seed most years) and an estimated number of NCAA Tournament wins at 2.2. The following table has the data discussed in visual form. For the Factor column, this is the number of possible minutes played by returnees, with the highest possible number being 5.000. This column is divided by 5 to get the % column which gets color-formatted.
It should be mentioned that returning minutes aren’t the only thing used to project team success when CtH publishes preseason expectation numbers in October. Not all returning players are great, and sometimes newcomers add higher value than expected. With the transfer portal changes, a large share of a roster’s newcomers have proven themselves to be valuable college players, something that doesn’t get captured by this exercise. KU having Kevin McCullar in ’23 and Remy Martin in ’22 was valuable.
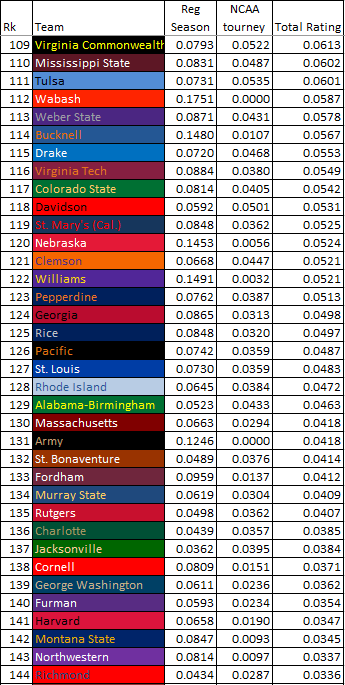
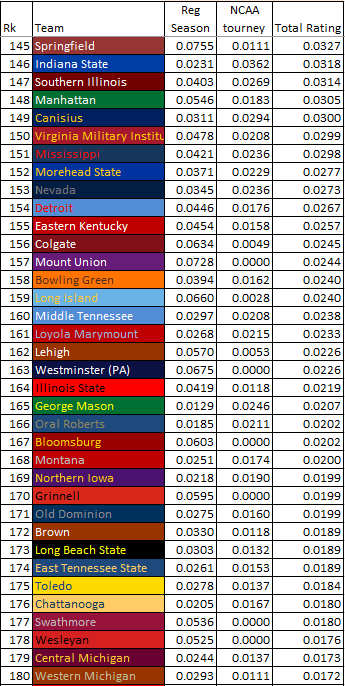
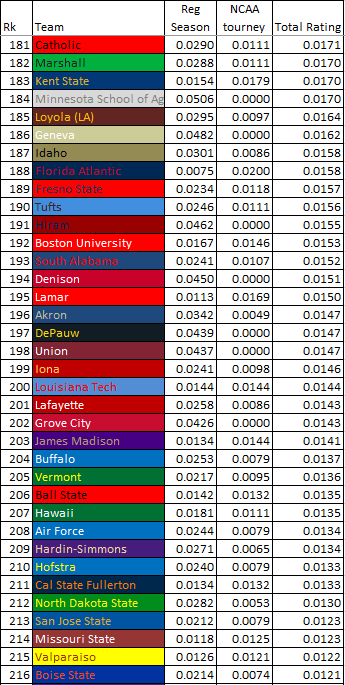
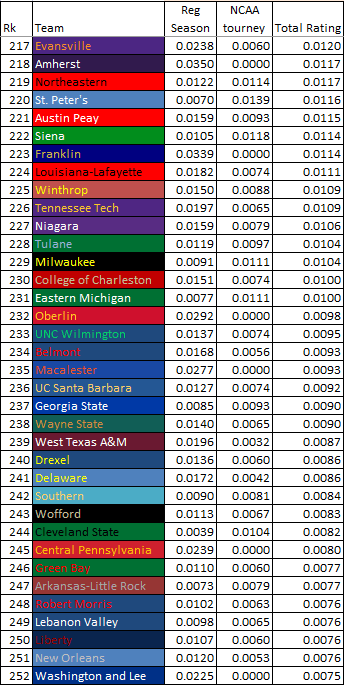
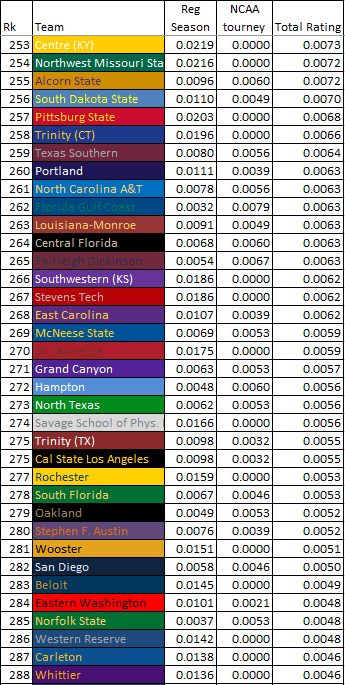
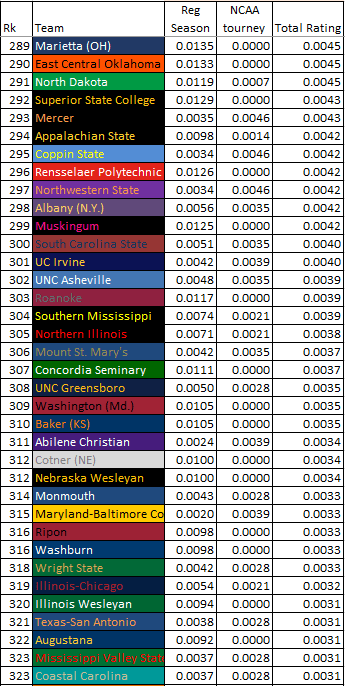
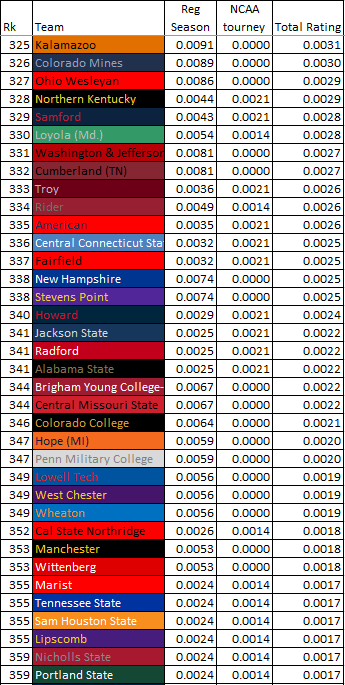
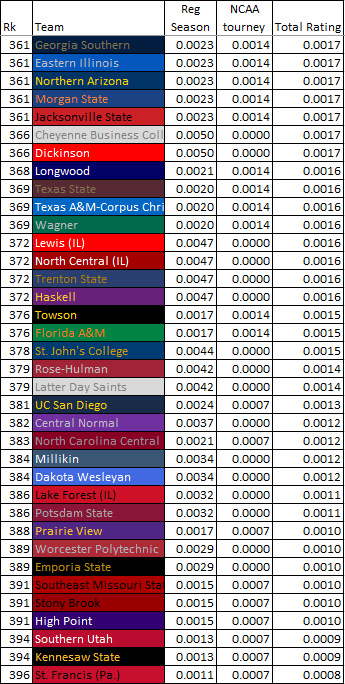
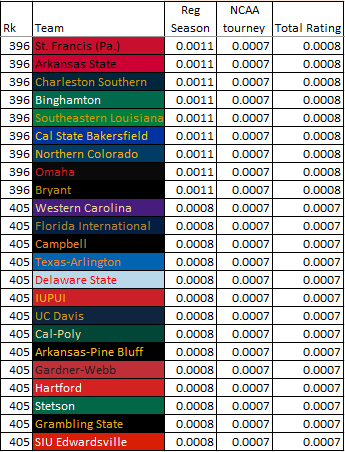
There have been 130 seasons of college basketball. This table attempts to rate the hundreds of programs that have competed in the sport over the years in an unbiased, objective manner. The rating system looks at the entire history of the sport, including its pre-NCAA Tourney days, in a consistent way that accounts for all the various eras of college basketball. When examining NCAA Tournament results, national championships are given their true weight with each successive round in the bracket being twice as valuable as the previous.
The Rating is thus cumulative. In each season, teams are awarded rating points based on a variety of categories. After 130 seasons, we accumulate the total rating points of each category and set the highest score as a baseline of 1. Each subsequent score is in proportion that baseline mark.
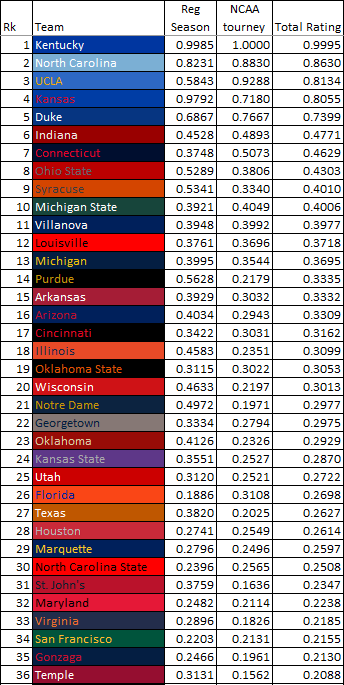
The Total Rating is the value on the far right, and it is this rating by which teams are sorted. Kentucky is college basketball’s best program with a score of 0.9995 (out of a possible 1.0000). The Total Rating is a weighted combination of both Regular Season and NCAA Tournament achievement, with the NCAA getting the stronger weight. We will now examine each rating portion in order.
Regular Season
The Regular Season score column rates each program’s success as it pertains only to the regular season, which for our purposes refers to any and all games that aren’t NCAA Tournament games. Although its called Regular Season, it implicitly includes conference tournament results. Implicit is the key term, because the Regular Season score is not directly any calculation of wins, win-loss percentage, or even other achievements such as conference championships. Rather, the Regular Season score is built based on NCAA Tournament seeding.
Seeding occurs at the conclusion of regular season play, and is thus the best judgment of how well a team performed to that point. Other results such as record or total wins or championships is schedule-dependent. A team which played a tough schedule will have a worse record than if it had played an easier schedule. The selection committee, although not perfect, takes this into account when selecting/seeding the 68 teams. Similarly, conference championships are dependent on the teams’ specific conferences. An easier conference is easier to win.
But teams with solid records and teams that win conference championships will be rewarded for these accomplishments through appropriate seeds in the bracket. It is the seed-line a team receives which determines how many rating points it gets for the Regular Season. Non-NCAA Tournament teams receive no rating points that season.
Allocating rating points is very important, as it must be done in proportionate value. How valuable is a 1-seed? Well, the question must be asked with regards to other seed-lines. A team earning 1-seed should receive more value points than a team earning a 2-seed, and the same with a 2-seed team when compared to a 3-seed team. But how much? What are these ratios?
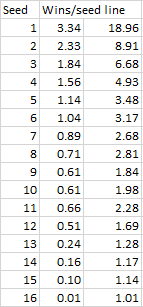
The best way to determine this is to use history. The NCAA Tournament is currently in the 64+ team era, and has been since 1985. In the 39 tournaments from 1985-2024, we have a large series of data which tells us how many expected wins each seed-line has. The table shows the estimated wins per seed line from that period.
The table shows that 1-seeds are expected to win 3.34 games per tournament. This is because they are typically the most talented teams and the easiest path through the bracket. From here, we see that 2-seeds win 2.33 games per tournament, 3-seeds 1.84 games, and so on.
The final column isn’t labeled, but it is also important. This column shows the expected number of weighted wins a seed will achieve in any one Tourney. A weighted win accounts for the fact that later round games are harder to win (because there are fewer of them), and allocates points accordingly. Expected weighted wins looks at how far in the tournament a seed is expected to go, with each successive round achieving double the weight as the prior round. The 16-seed is expected to earn only 1.01 weighted wins because it is expected to make only the Round of 64 99% of the time, as it rarely has made the Round of 32.
Weighted wins are as follows: Make the Round of 64 (i.e., lose in the First Round), earn 1 weighted win. Make the Round of 32 and lose, earn 2 weighted wins. Make the Sweet 16 and lose, earn 4 weighted wins. Elite 8 earns 8. Final 4 earns 16. Finish Second to earn 32. Win the Championship to earn 64.
Weighted wins will show up in a later portion of this methodology. But for now, know that they are used as expected. A team which earns a 4-seed from the committee due to its regular season success will earn 1.56 expected wins in the middle column and 4.93 expected weighted wins in the last column.
The expected-win data presented above is for all Tournaments 1985 and beyond. For seasons before 1985, we use other other numbers based on the bracket at the time. Tournaments from 1979-1984 had 48 teams. From 1953 through 1978, the number of teams fluctuated from 22 to 32. 1951 and 1952 had 16 teams. From 1939 to 1950, there were 8 teams.
Each bracket iteration has win estimates based on the standard of the time, but the estimated number of wins and weighted wins accumulate in the same fashion. The 64-team bracket is set as standard, so a team which made the Tourney in the 16-team era is guaranteed to make the Sweet 16 by virtue of making a more-select field.
Before getting to the NCAA Tournament portion of the rating, we need to first examine years there wasn’t an NCAA Tournament. This includes the seasons from 1896 to 1938, as well as 2020. In the pre-tournament days, conference championships and wins/losses were more important. But without a national ranking system, it is tough to judge these metrics against one another. Thankfully, we have two systems that help.
First is the Helms Athletic Foundation, which retroactively began awarding National Titles beginning in 1943. By the late-90’s, computer rankings were possible so it was the work of Premo and Porretta that provided Top 15, 20 or 25 lists by season starting in 1896. Using these systems, we can award regular season value-points and weighted value-points which translate to expected NCAA Tournament wins. The question to ask is as follows. Had the NCAA Tournament been around, what regular season value would we expect the Helms Foundation champion to receive? What about, say, the #12 team on the Premo-Porretta Power Poll? This is doable as these rankings can track with our understanding of modern seeds. Once careful calculations were made in determining the correct value points, these systems were incorporated so that the first four-plus decades of college basketball could be included in the program ratings.
2020 is an anomalous case, but what happened was that we had an entire regular season and no NCAA Tournament. Although the selection committee didn’t select and seed a field as it should have, we can still reasonable place teams in a hypothetical bracket. Even Ken Pomeroy did this on his website. After doing this, we treat each program’s expected seed-line and award it expected wins and expected weighted wins. That way, the best teams in the 2020 regular season can receive their due value-points.
NCAA Tourney
The NCAA Tournament score column is actually calculated in a similar way to the Regular Season score. However, instead of expected wins and expected weighted wins, we simply use actual wins and actual weighted wins.
One important note is that each tournament is patterned to the 64-team field for uniformity purposes. A team which makes the Elite 8 when there were only 32 teams is not penalized for not having to play in the Round of 64, for instance. But this means that official tournament wins aren’t used, instead we make an adjustment to account for seasons where teams effectively got “byes” to the later rounds.
Concluding Thoughts
When examining this list, note that there are non D-1 programs and defunct programs. They are part of the history of college basketball, but aren’t likely to move up unless something changes and they return to the highest level of collegiate play. I’ll close with some trivia. The first list is something you don’t want to be on, but the theme is “the best program to never ___.” These refer to current D-1 teams, with historic teams in parentheses.
The best to never win a National Championship: #14 Purdue
The best to never make a Championship Game: #21 Notre Dame
The best to never make a Final Four: #45 Missouri
The best to never make an Elite Eight: #88 Texas A&M
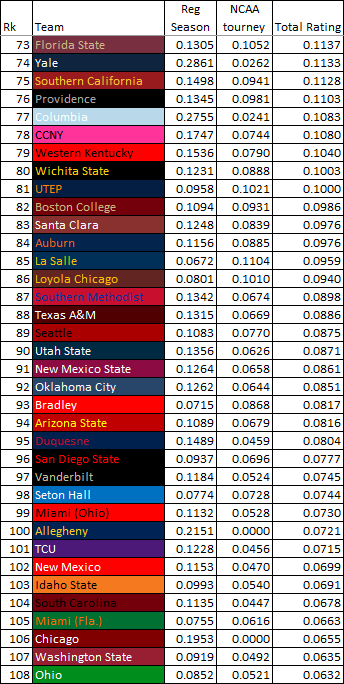
The best to never make the Sweet 16: #114 Bucknell (historically: #100 Allegheny [non-D1])
The best to never make the Round of 32: #120 Nebraska (historically: #100 Allegheny [non-D1])
Nebraska is also the only Power-6 team to have never made it past the Round of 64. The Cornhuskers are 120th on the list thanks to a surprisingly decent pre-1939 basketball history. In the tournament-era they’ve been far less fortunate, having gone 0-8 in the Round of 64. In those 7 appearances, they’ve been as high as a 3-seed yet still have never won a game. Given their cumulative seeds in those Tourneys, we’d expect them to have 6.84 wins.
UCLA’s 11-1 record in the National Championship game is amazing, and Connecticut is a perfect 6-0 when playing for a Title. Conversely, Ohio State is 1-4 in the Title Game. The worst program with a National Title is Loyola Chicago, ranking 86th in this rating system. CCNY, the 1950 champion, is the only champion no longer D-1 (it is currently D-3) and sits at 78th thanks to a strong pre-NCAA Tournament program history. Louisville, which still checks in at #12, is the only school which had a title vacated. It has 2 official NC’s after losing its 2013 banner. The best program not in a Power-5 conference (Big 10, Big 12, ACC, SEC, Big East) is #34 San Francisco, edging out Gonzaga by 1 spot. The Dons have 2 titles in their history (1955, 1956) but have not won an NCAA Tournament game or got past the Round of 64 since 1979.
The rating system is set up to compare any two programs in terms of a multiple. Simply divide one program’s Total Rating score against another to see (in terms of a multiple) how much better (or worse) one is than the other. Let’s look at a few examples (as of end of season 2023):
Kansas is 2.81x better than Kansas State
Kansas is 3.07x better than Texas
Kansas is 4.88x better than Missouri
Kansas is 6.86x better than Iowa State
North Carolina is 1.17x better than Duke
Indiana is 1.43x better than Purdue
UCLA is 2.46x better than Arizona
Kentucky is 2.69x better than Louisville
Kentucky is 1,334x better than Grambling State (#1 and #404 ranked programs)