The 2025 Kansas Jayhawks finished the season at 21-13 (11-9). Kansas earned a 7-seed before losing in the First Round of the NCAA Tournament. The team’s Sports Reference page is here.
Note: The value-metrics in this write-up might not match the final published numbers, as the 2024 college basketball season is still being played. But since KU’s season is complete, the only changes to value-metrics will be small and due to what happens with KU’s opponents and how their computer metrics trickle down.
The 2024 team came in with high expectations. Landed the best big-man transfer in the portal. Landed a sought-after portal wing and highly-athletic combo-guard. Returned three starters from team that earned a 1-seed in 2023. A McDonald’s All-American guard leading a decent recruiting class. A healthy coach. Pre-season AP #1. This took a bit of a hit when they lost Arterio Morris to a felony charge. Even still, on paper the team was expected to be good.
For the most part during the non-conference, Kansas lived up to expectations. Sure, its computer metrics took a when it failed to blow out certain teams it should have (Eastern Illinois, UMKC, Missouri). But it got huge wins against the likes of Kentucky, Tennessee, and Connecticut. At 12-1 heading into conference play, the team was trending toward another 1-seed.
The conference schedule was back-loaded in terms of difficulty, so the Jayhawks knew they had to play well in January. Unfortunately, the team lost to UCF and West Virginia on the road (as well as Kansas State in early February). It did have nice home wins—including a 13-point win against Houston in early February—but after McCullar got injured Kansas struggled to find any consistency. Since January 1, KU didn’t win or lose more than 3 games in a row. The team couldn’t find any momentum on the season, although saying the wheels fell off does seem like a stretch.
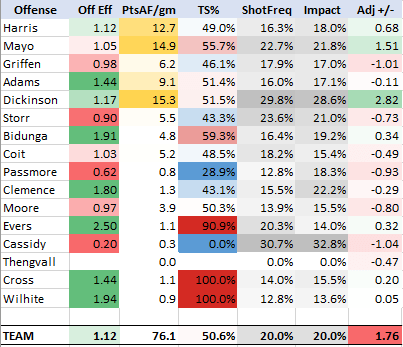
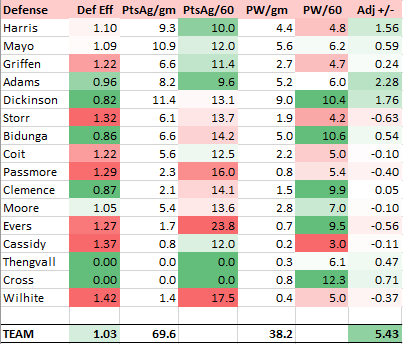
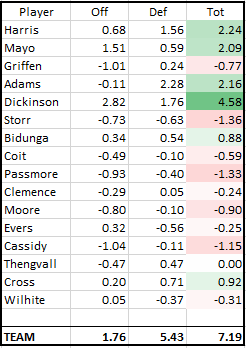
With that said, the focus on the season recap will be to look at how the roster performed relative to value metrics that help us judge players across seasons. We will also look at how each player did compared to his pre-season expectation, and finally look at the team as a whole. The shooting splits will be listed in the order of FG%/3-pt%/FT%.
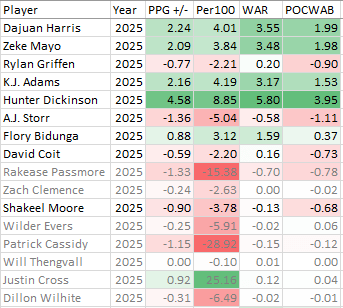
Dajuan Harris
Traditional Stat-Line: 8.5 PPG, 6.5 APG, 2.0 RPG, 1.5 SPG, 0.4 BPG on 35.7 MPG, 42.4%/38.4%/80.4%.
Pre-season Value Projection: +2.50 PPGAB, +4.20 Per100AB, +4.24 WAR
Actual Value Score: -0.14 PPGAB, -0.23 Per100AB, +1.57 WAR
Harris was projected to be KU’s second most-valuable player for 2024, as that’s what he was in 2023. But he got off to an awful start to the 2024 season. Aside from a stellar shooting night against Kentucky, he failed to reach double-figures in points until Indiana (11th game of the season). His defensive metrics were poor to begin the year. Through 10 games he was a -1.27 per game defender (in 2023 he was a +2.17 per game defender). This poor play wasn’t reflected much in the team’s overall record, but it did but Juan behind the 8-ball as far as his season-long performance.
By conference season, Harris would begin to play better, improving on the whole until he started playing near the level he had last season. Over his final 15 games, Harris was +2.54 per game, right where he was projected to be on the season. As these games included the stretch run and tournament play, it should be noted that he basically became the player KU was expecting him to be by the time the games really mattered. This makes his season a bit odd. KU played better during the part of the season where its point guard was playing worse. Given how polarizing he is as a player, this makes things even more confusing.
Harris will be back in 2025. There will be plenty of time to look ahead and forecast out his final season in a Kansas uniform. But in looking back at his 2024 campaign, Harris’ Per100 value metrics put him in the 34.5%ile of all Jayhawk rotation players since 1993. You want more from your starter than this. And while he can’t shoulder all of the blame on the team’s poor season, had he been as good as expected from Day 1, the team may have been a bit more competitive.
Elmarko Jackson
Traditional Stat-Line: 4.3 PPG, 1.7 APG, 1.4 RPG, 0.8 SPG, 0.1 BPG on 18.6 MPG, 40.6%/26.7%/76.9%.
Pre-season Value Projection: +0.10 PPGAB, +0.20 Per100AB, +1.44 WAR
Actual Value Score: -2.20 PPGAB, -6.83 Per100AB, -1.26 WAR
Freshmen are basically projected on a curve given their incoming class-ranking, so Jackson was expected to be about bubble-level given how the rating services saw him as a high school senior. Even during the off-season, 2024 NBA mock drafts had him as a possible lottery pick given his intangibles (explosive player, good size as a guard, decent-looking stroke, and so on). Nothing close to this potential developed in 2024. Jackson was given the starting spot in the backcourt to begin the season—in large part due to the poor play of others competing for that role—until he started to slump at the beginning of conference play as was replaced by Johnny Furphy.
Jackson’s season is at the bottom of the list in terms of KU history since 1993. He had the second-worst PPGAB score over the last 3+ decades (Quentin Grimes). His Per100 score was in the 3.85%ile of all rotation players, clearing only a hand-full of role-players and walk-ons who played minutes on past KU teams with depth issues (i.e. Jeff Hawkins and Moulaye Niang in 2003). His WAR, thanks to him playing so many minutes, was the worst in the 1993-2024 span.
It was a disaster of a season for Elmarko. He appeared in all 34 games, but only had an above-bubble impact in 8 of them. (Offensively, he was above-bubble in only 5 of 34). His non-conference play of -0.83 PPGAB looks relatively strong, compared to how he ended the season. Since the beginning of the conference season in early January, Jackson was a -3.05 PPGAB player.
Kevin McCullar
Traditional Stat-Line: 18.3 PPG, 4.1 APG, 6.0 RPG, 1.5 SPG, 0.4 BPG on 34.2 MPG, 45.4%/33.3%/80.5%.
Pre-season Value Projection: +1.71 PPGAB, +3.25 Per100AB, +3.23 WAR
Actual Value Score: +3.97 PPGAB, +6.71 Per100AB, +4.22 WAR
McCullar was a late-returnee for Kansas, coming back after nearly going pro. His return was certainly good news in the summer, but when he came out with an improved shot and stronger offensive game in the non-conference, KU was playing its best ball. Kevin cleared his PPGAB estimate by over 2 points and his Per100AB estimate by over 3 points. And even though he got injured and missed 8 ½ games, his WAR was over a win above expected.
McCullar had the highest PPGAB and Per100AB marks of any Jayhawk this season, and his WAR was third on the team but closely behind two players with 248 and 173 more minutes of game action. McCullar’s injury prevented him from adding to his legacy, as his efficiency waned during the part of the season he was trying to play through the pain.
Overall, Kevin’s jump in performance was a pleasant surprise in a season with few of them, and makes his injury and even more frustrating. When he was out there, he was an 85.1%ile Jayhawk, which is right on par with Ben McLemore’s lone season (2013).
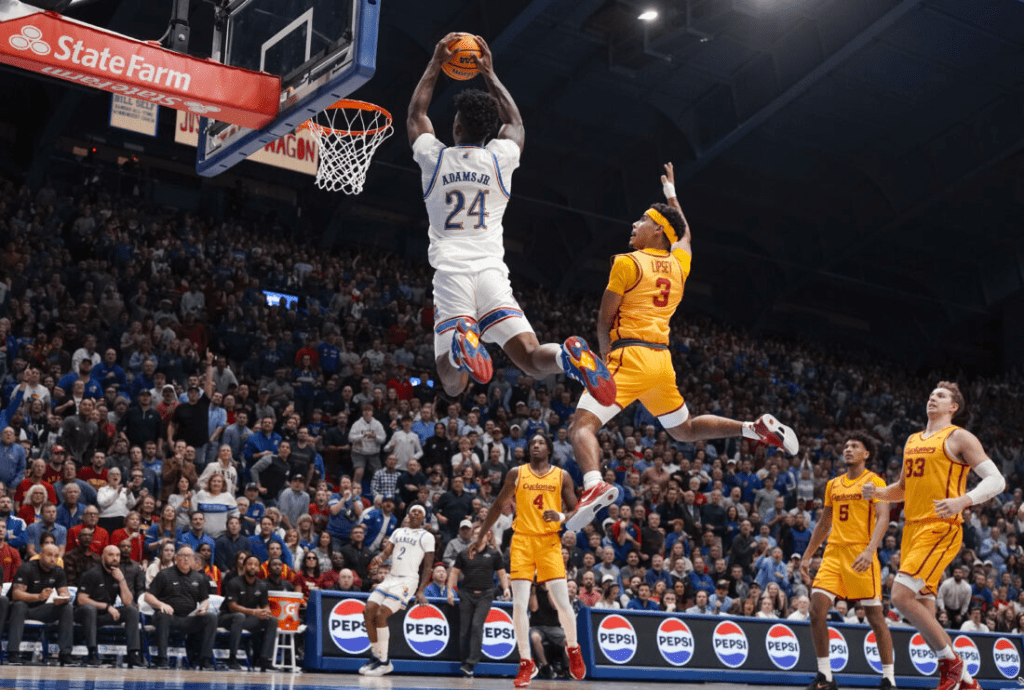
K.J. Adams
Traditional Stat-Line: 12.6 PPG, 3.1 APG, 4.6 RPG, 1.1 SPG, 0.6 BPG on 33.5 MPG, 60.1%/0.0%/60.0%.
Pre-season Value Projection: +0.93 PPGAB, +1.90 Per100AB, +2.33 WAR
Actual Value Score: +2.88 PPGAB, +4.98 Per100AB, +4.42 WAR
Alongside McCullar, K.J. Adams was KU’s most-improved player. He overachieved his PPGAB and Per100AB expected scores by 2 and 3 points respectively, and added 2 WAR above his projection. Adams’s offensive value was right where we thought it would be, it was his defense that made a huge leap. Adams was KU’s best defender, allowing 0.145 points per possession (or 8.7 points per 60 possessions). His strength, quickness, and ability to switch to both guards and posts helped KU put together a mostly acceptable defense for much of the season. Adams was also healthy and consistent, something no other Jayhawk from 2024 can really say. He was the team-MVP in 11 of KU’s 34 games, which led the team this year.
Another polarizing player, we will focus on 2025 and his role at a later date. But KU was barely a tournament team without Adams (even if McCullar/Dickinson were healthy all season). Unfortunately, he had his worst game of the season against Gonzaga, especially on the defensive end. For the season, he had a Per100AB at the 75.2%ile, which is very similar to the per possession value Julian Wright gave as a freshman (2006). And K.J. did this playing far more minutes and less rest. Adams’ value was very under-appreciated.
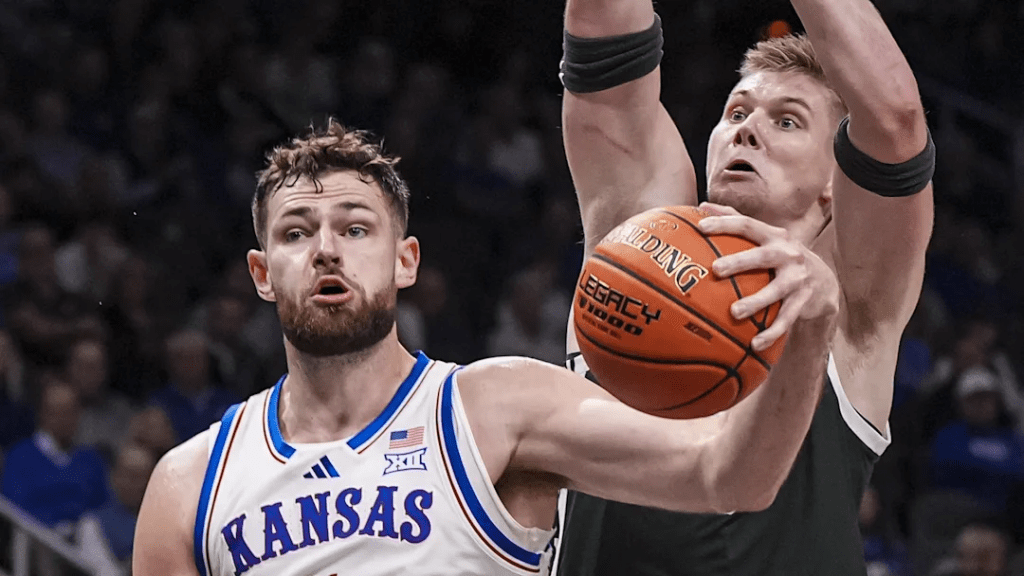
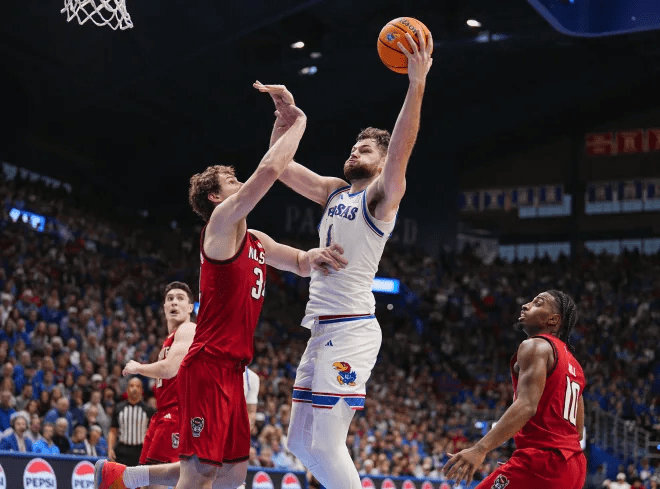
Hunter Dickinson
Traditional Stat-Line: 17.9 PPG, 2.3 APG, 10.9 RPG, 0.9 SPG, 1.4 BPG on 32.2 MPG, 54.8%/35.4%/62.4%.
Pre-season Value Projection: +5.18 PPGAB, +9.25 Per100AB, +6.88 WAR
Actual Value Score: +3.45 PPGAB, +6.19 Per100AB, +4.77 WAR
Hunter Dickinson had a good season, producing the second-highest PPGAB and Per100AB scores on the team and the highest WAR. Let’s start with that fact, so that the rest of the discussion will be in its proper context. Within this context, Dickinson very-much underachieved his projected totals, and his play worsened as the season progressed (even before his shoulder injury).
Hunt was a +5.40 PPGAB player through the home Houston game, when KU looked like it had turned a corner and was poised to have a strong February run building into March. After that game, beginning with the road K-State contest, Hunt was a -0.45 per game player. This was seen on both ends of the floor, but especially on defense. Over these last 11 games he played (he missed the Cincinnati game in Kansas City), Dickinson was a -2.41 per game defender. His shooting, particularly behind the 3-point and free-throw lines, got worse and hurt his overall offensive game. Even during his slumps, his offense was good enough to be value-adding.
On the season, Dickinson had 9 team-MVP games and had the best performance overall in his dominance of Tennessee’s big men during the third-place game at the Maui Invitational. But that seems like months ago because it was. He saw the likes of Samford take advantage of his propensity to over-hedge ball screens and recover slowly. Teams kept hurt the Jayhawks on this play, to the point that March Madness analyst Brendan Haywood pointed out that KU should think about dropping him into the lane to cover ball-screens this way. We would agree.
Dickinson was in many ways the anti-Harris. He started the season great but limped to the finish, unlike Harris who came around during the late push. But we don’t want to ignore Hunter’s 82.5%ile mark, second on the team and comparable to Nick Collison as a sophomore (2001). From a WAR perspective, Hunt’s season compared to the seasons of other big-men such as Perry Ellis as a junior (2015) or Jeff Withey either his junior or senior seasons (2012 or 2013). These are solid players, and show that Hunt added quite a bit of value.
Nicolas Timberlake
Traditional Stat-Line: 5.2 PPG, 0.6 APG, 1.9 RPG, 0.5 SPG, 0.1 BPG on 15.4 MPG, 38.3%/30.3%/78.6%.
Pre-season Value Projection: +0.32 PPGAB, +0.75 Per100AB, +1.50 WAR
Actual Value Score: -0.93 PPGAB, -3.50 Per100AB, -0.18 WAR
Timberlake had a rough season, producing 4 points worse Per100AB than expected. His poor play, particularly to start the season, also lowered his minutes volume…not something this KU team needed given its depth issues. And by the time Nick started to play better, KU had injuries to key pieces. We really never saw him filling his role when KU was at its best, although there were glimpses such as his senior-night performance vs. K-State.
In the non-conference, Timberlake played at a -1.78 PPGAB. Starting January 1, which was the beginning of conference play on through the NCAA Tournament, his performance was at -0.41 per game. This improvement was more pronounced on the defensive end, where he would grade out as a +0.27 per game player. He was able to move his feet okay, grabbed enough rebounds, and otherwise was a healthy and energetic player.
But his offense, unfortunately, never really clicked. He was officially credited with 22 assists on the season, which, as a 2-guard, is really terrible. We had him with 17 value-assists, which even if you doubled his minutes, would come to about 1 per game on 30 minutes. His shot didn’t consistently fall, which really hurt the value he provided to the team.
Timberlake was at the 14.0%ile of all Jayhawk rotation players since 1993. A close comp here would be 2010 Brady Morningstar or 2023 Joseph Yesufu. Given that Timberlake was meant to be a step-up from Yesufu, this was a major disappointment.
Positive moments Nick will be remembered for are his athletic dunks as well as drawing a late foul against Samford and knocking down 2 FT’s to put KU up 3 in the final seconds.
Johnny Furphy
Traditional Stat-Line: 9.0 PPG, 1.0 APG, 4.9 RPG, 0.9 SPG, 0.8 BPG on 24.1 MPG, 46.6%/35.2%/76.5%.
Pre-season Value Projection: -0.84 PPGAB, -6.30 Per100AB, -0.49 WAR
Actual Value Score: -0.23 PPGAB, -0.54 Per100AB, +0.90 WAR
Furphy was KU’s latest roster move, he joined the team so late he didn’t even play in Puerto Rico in August, and he wound up being the only newcomer to meet expectations. His were low, given limited information about him from recruiting services and the unknown about foreign players. Compared to Svi Mykhailiuk, Furphy had a much stronger season as a frosh than Svi did. After cementing his role as KU’s fifth starter (when the team was fully healthy), Furphy worked his way into an above-bubble player for the Jayhawks during the middle of conference play. He had some rough moments down the stretch of the season to finish below-bubble, but he was comfortably above D-1 average and therefore produced nearly 1 full win above replacement.
Furphy was at the 32.1%ile of Jayhawk players who crack the rotation, which was very close to Wayne Selden’s freshman season (2014). A career trajectory like Selden’s would be excellent news for Kansas. We shall see what happens with Johnny, a skilled scorer with clear pro potential.
Johnny’s offense ended up worse than his defense, which seems strange. Furphy’s defense wasn’t great, but he did add value by rebounding and just competing. His inability to break down defenses or generate points for others (only 28 value-assists on the season) took away from his solid shooting numbers.
Parker Braun
Traditional Stat-Line: 2.2 PPG, 0.3 APG, 1.6 RPG, 0.2 SPG, 0.6 BPG on 7.5 MPG, 66.7%/36.4%/66.7%.
Pre-season Value Projection: -0.39 PPGAB, -2.75 Per100AB, 0.00 WAR
Actual Value Score: -0.70 PPGAB, -5.44 Per100AB, -0.33 WAR
Parker was projected to be a replacement player, or average D1 guy coming in as a backup to Hunter Dickinson. The fact he didn’t get there is important, although he was never the guy who was going to make or break the season for Kansas. Parker knew his role, but his defense was never where it needed to be. He did shoot a high percentage, mostly on lob-dunks and layup attempts, but his lack of production hurt the team whenever he played.
Braun’s play registered at the 6.9%ile of all Kansas Jayhawk rotation players since ’93. He was about as good, per possession, as sophomore Mitch Lightfoot (2018), who played a similar role for a Final Four team when he backed up Doke. Braun played 18.6% of available minutes, close to the 20.1% that was projected for him.
Jamari McDowell
Traditional Stat-Line: 1.8 PPG, 0.5 APG, 1.2 RPG, 0.2 SPG, 0.1 BPG on 7.2 MPG, 30.8%/28.1%/84.2%.
Pre-season Value Projection: -0.72 PPGAB, -6.02 Per100AB, -0.40 WAR
Actual Value Score: -0.75 PPGAB, -6.01 Per100AB, -0.35 WAR
Jamari’s projection was the most accurate. We even nailed his minutes (he played 16.4%; projection was 17.1%). As a true freshman toward the lower-end of the Top 100, Jamari was never expected to be a huge contributor. With only 9 scholarship players, he filled a role as a back-up wing who was there to play defense first. McDowell’s play was at the 5.5%ile of all rotation players in KU history since ’93. He was about the same as Tristan Enaruna as a freshman (2020). Given how much better Enaruna has gotten (albeit at a low-major), there’s no reason to think McDowell can’t become a KU-level player as an upper-classman.
TEAM
We projected KU to be a +8.51 team, meaning they would beat their opponents by 8.51 more points per game than a bubble-team would be expected to. This projection, independently arrived at, was quite close to how KenPom and Bart Torvik saw them. This number ended up being +3.62 by season’s end. This ended up being the worst team in the Self-era as well as the worst team since 1993 (1989 was likely the last Kansas team to be this bad from a computer-rankings/efficiency perspective).
In October we looked at different scenarios as to how the season could play out. A median case, worst case, and best case scenario. Look at what we wrote about what could happen if KU had a worst case type of season.
In this scenario, one of its key players struggles with an injury and this weakens an already depleted roster. KU’s offense could also struggle as teams force McCullar and Adams to make jump-shots while forcing the ball out of Dickinson’s hands. On defense, while it’s difficult to see KU being bad on this end, teams could put Dickinson in high-ball pick-n-rolls and take advantage of Self’s propensity to switch screens.
If KU were to struggle enough, it could lose games it was projected to win preseason and find itself slipping down into the 5-6 seed range. In this range, a First Round upset loss is more likely and a second-weekend in the NCAA’s less likely. For KU’s worst case scenario to be a comfortable NCAA Tournament team is something most teams can’t say a few weeks before the season starts.
This is basically what happened. McCullar’s injury proved to be too much. Jump-shots stopped falling, and Hunter had more difficulty avoiding double-teams. KU’s defense faltered when Hunt was put in high-ball pick-n-rolls. Kansas did get a 4-seed, making it slightly better than it could have been, but didn’t make the second-weekend. However, its tough to see the season playing out worse under any reasonable situation. KU’s floor is so high, that it makes rebuilding easier. We won’t look ahead until later posts, but there isn’t any reason to panic about the state of the program right now.
That about puts a bow on the 2024 season. Thank you and Rock Chalk.
All KU fans agree that Hunter Dickinson is a skilled and valuable offensive player. Some argue that Dickinson’s defensive deficiencies (they take for granted he’s a poor defender) severely undercut his offensive value. This post will examine Hunter’s defense by comparing him to other players on this season’s roster as well as KU centers in seasons past.
A player can be a plus defender in one of two broad ways. He can either do so by limiting the amount of points his man scores or he can be a good defender by getting the ball back for his team (such as rebounding). Note that these are related. A defender getting a rebound is also preventing his man from scoring on a putback attempt. The very best defenders are good at both aspects–they limit their opponents’ good looks and they get the ball back for their team.
Applying this to Hunter in particular, we want to examine how often he is most responsible for the other team scoring (compared to others) and how often he wins possession back through a block, rebound, steal, or forced turnover (compared to others).
Using the Charting methods, we calculate that Hunter has allowed 276 points in 23 games this season (12.0 ppg). When we convert this to a 60-possession basis, this comes to 12.9 per 60. This conversion is done to compare Hunter to other players.
Next, we can count the number of stops KU gets because Hunter gets the ball back through either a block, rebound, steal, or forced turnover. As rebounds are most common way a defense gets the ball back after a stop, Hunter’s importance is mostly by being a great rebounder. He averages 10.5 possessions “won” over 60 defensive possessions.
For the 2024 team, we can consider this table.
Looking at the Points Against Per 60 column, this shows that Hunter (allowing 12.9 per 60) is worse than the other starters save Furphy (13.0 per 60). However, he is better than his backup Parker Braun (15.4). Additionally, only K.J. Adams (7.9) is significantly better than Hunter at disallowing points. Harris and McCullar have been in the middle-of-the-pack.
If we move to the far-right column, we see possession winners per 60. In this case, Hunter is clear-and-away the best at getting the ball back following a miss or through a forced turnover.
When some think of defense, they mostly consider the first aspect of this, or on-ball defense. And this aspect is very important. Not getting beat, not fouling, closing out on shooters, forcing a player to pick up his dribble and pass, etc. are all ways a defender can make it more difficult for the opponent to score. But the second aspect, or coming away with the ball, is also important. First-shot defense that doesn’t win the ball back will lead to second and third chances that can allow points. A player who might not be a great first-shot defender can still add value if he prevents opponents from getting second-chances. So, we need a way to combine these elements of defense into one number that estimates player value.
Using theory regarding the relationship to points and possession in basketball, we can calculate how valuable these defensive metrics are. We will now include the defensive value metric in the final column of the table.
This final column estimates, in points per game, how valuable a certain defender is when compared to a replacement (bubble-level) player. Due to his stingy on ball-defense, K.J. has graded out as KU’s best overall defender. But the second-best defender has been Hunter Dickinson–not because he is always great at disallowing points–but because he limits teams’ second-chances. Imagine KU without Hunter on the floor. Teams would get many more baskets through second-chance opportunities.
This is common among bigs in today’s game. The prevailing offensive strategy involves getting opposing 5-men away from the basket (to clear driving lanes and cutting angles). As Hunter is involved in ball-screen defense and plays on the perimeter at times while on defense, he is often put in situations where he can find himself out of position. This leads to breakdowns, rotations, and open shots for opponents. But this isn’t always what happens. Other times he defends fine, and the possession ends with a missed shot that he has a great chance of rebounding due to his height and good rebounding technique.
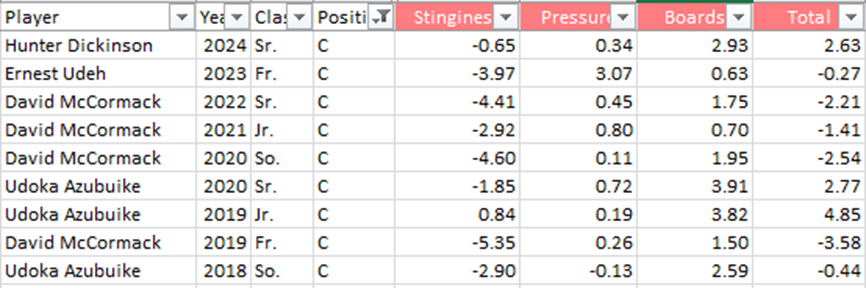
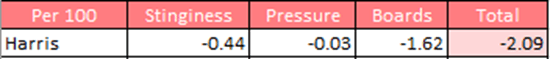
We can break down the defensive value provided by 2024’s roster further, using 3 categories and a Per 100 possession basis. These three categories are: Stinginess (or points allowed), Pressure (forced turnovers/steals), and Boards (rebounds).
Hunter’s Stinginess score is below-bubble, but at -0.65 points we estimate that it only costs KU less than a point per 100 possessions. His Pressure (+0.34) and Boards (+2.93) make up for it, leading him to be a +2.63 player over 100 possessions. This is nearly 4 points better than his backup, Parker Braun has been. He is also better defensively than all other players save K.J. Far from being a liability, Hunt’s been a valuable asset for the 2024 defense.
We can also compare Hunter to 5-men of past seasons. Below is a table of all players labeled center who’ve played 10% of minutes on the season or more since 2018. This includes 9 player-seasons.
Here we see a pattern. 8 of the 9 centers on this list have negative Stinginess value, showing that they are allowing points more often than the average defender. This makes sense. Teams are attacking the slowness of the big men to find an advantage that leads to points. However, once we move right, we see that the 5-men can Pressure and Board better than average. So while your guards are likely to be better at preventing open shots, they struggle to get the ball back. Hunter’s rebounding better than any recent center not named Udoka. Additionally, his overall defense is 3rd best out of 9 centers since 2018, again only behind 2019 and 2020 Azubuike.
We can expand this more, just with less detail. Since 1993, there have been 192 players who have played at least 40% of the team’s minutes during the season. Of this 192, only 45 have had a per game defensive value as good as Hunter’s having this year. He’s objectively around the 76th percentile of defensive players in recent Kansas history. Ignore people who don’t know how to track defensive value and fail to consider all relevant factors of defense.
In addition to tracking individual defense, we can confirm these general findings by looking at proxy metrics. One such metric would be points in the paint. This season, for reference, KU’s offense is averaging 40.1 points per game from paint scoring. That’s what a good offense does. A large chunk of this is from Hunter (although K.J. and Kevin are also doing well at the rim). So let’s use KU’s offense as a comparison to KU’s defense. The thought would be that if Hunter’s offensive-value is being wiped away by poor defense, then KU will be allowing nearly as many points in the paint as it is scoring.
This isn’t the case at all. KU is only averaging 25.8 points per game in the paint. This is a difference of 14.3 points, which is more than the overall point difference (10.9). KU is winning points in the paint but losing in all other areas (that is FT’s + 3’s + 2’s outside the lane). This is just further confirmation of Hunter’s value.
Wins Above Replacement (WAR) and PAB (Points Against Bubble) have similar concepts and therefore the lists will be similar. Both are attempting to rank the careers of all KU players since 1993 to see which Jayhawks have been the most valuable for the program. The differences stem from the benchmark player upon which value is judged. In WAR, the “replacement player” is basically an average D1 player whereas in PAB, the “bubble player” is a player whose value makes a bubble team no more or less likely to make the tournament. In other words, a bubble player is a much higher standard than a replacement player.
So why the two lists? Which list is more valid?
At the top of the list there isn’t a ton of difference as guys like Raef LaFrentz easily clear the bubble level just as they clear the replacement level. It is further down the list where this distinction matters. Take Jeff Boschee for instance. Boschee was a four-year starter who is currently 57th in career WAR but 168th in PAB. Boschee was better than a replacement player but not better than a bubble-level player for the majority of his career1.
These are widely different rankings, leading to the follow-up question, which list is better? Well, it depends. Being a better-than-bubble player is crucial for KU to approach the success demanded of it. So we would normally lean with PAB. However, sometimes players who are not quite at bubble-level (but still solid enough to be above replacement level) are required to play heavy minutes due to roster issues or coaching decisions, and it wouldn’t be fully accurate to list these players below low-minutes-played players because of this. Boschee serves as a great example. He was certainly a below-KU-average guard given the minutes he played, particularly as an underclassman. But he was still valuable because he was better than the alternatives at his position.2 This is where WAR can be a better metric.
There is a third way to measure that is present, namely Per100 (possession) against bubble value. This is the third column on the second table. This shows the value the player provided while on the court, effectively ignoring playing time. Be aware of the limitations of this measurement. One, if we sorted by this list we’d include walk-ons at the top who graded out very well in very small, unimportant minutes. Two, durability is an important feature inherent to both WAR and PAB but ignored in Per100 value. A player who generates high value per possession but does not stay healthy throughout the year may not help the team as much as someone who can play a full schedule and heavy minutes at a lower value. A four-year player with solid value (like Marcus Garrett) will provide more value to KU than an elite one-and-done (like Joel Embiid).
Both WAR and PAB are useful lists but cannot be considered in isolation. If we are looking toward the top of the list, PAB is the better measurement. It estimates how many points a player gave to Kansas above that of a bubble-player over his career. Toward the middle and bottom of the list, WAR becomes the better mark. Clearly role players with sub-bubble (but above-replacement) value are preferable to the walk-ons. Lastly, Per100 can add some more context but we must be careful to not over-emphasize this measure as it is total value, not per possession value, that is most important when determining this ranking.
Boschee’s only above-bubble season was his senior year in 2002. ↩︎
Marlon London and Jelani Janisse are examples of other backcourt players on the roster in the Boschee-era. KU’s backcourt talent depth was quite thin during Boschee’s first three seasons at Kansas. ↩︎
Dajuan Harris’s last 15 games of 2023 vs. Dajuan Harris’s first 15 games of 2024:
Stat
2023 – Last 15 Gms
2024 – First 15 Gms
PPG
11.3
6.9
eFG%
62.8%
48.5%
TS%
61.5%
471.%
APG
5.8
7.1
A/TO
3.0
2.6
SPG
2.6
1.2
RPG
2.9
2.2
ORtg
109.6
102.4
Pts AB +/-
+48.39
-44.98
PPG +/-
+3.23
-3.00
Per 100 +/-
+5.14
-4.84
The numbers speak for themselves. Another notable thing is that KU’s average opponent had a KenPom rating of +17.10 over last 15 games in 2023 compared to +4.77 over KU’s first 15 games in 2024. Juan’s drop in production and efficiency has come against weaker foes.
The last three numbers are the value scores, first in total points against bubble, and then rated in per game and per 100 possession bases. These numbers account for opponent strength as well as deeper defensive metrics such as points allowed (Harris is allowing 12.4 points per game in 2024; it was 10.0 over the last 15 in 2023).
Aside from assists, Harris has gotten worse in every facet of the game. But even with assists, his increase in assists has come with a greater increase in turnovers, meaning his overall “ball-handling” value has worsened.
This and That
The following bits of info relate to the 2024 season through KU’s first 15 games.
Johnny Furphy’s defense has been better than his offense. Per 100 possessions, Furphy is about -1.03 points to a bubble player on offense and 0.00 to a bubble player on defense. Furphy is shooting well, but he relies on assists to score and turns it over far more than he creates offense for others. Defensively, his coverage score is not terrible and he rebounds at an acceptable clip.
Elmarko Jackson has posted 3 above-bubble offensive games, or 20% of the 15 he’s played so far in his KU career. And 2 of these came in KU’s first 2 games. What’s giving him any playing time at the moment is his defense. Jackson has produced 10 positive defensive outings this season (67% of games).
K.J. Adams is KU’s best defender right now, posting a +2.23 average defensive game score. This is far better than his 2023 season, which was negative (-0.10). Adams’ improvement on defense is in large part due to him defending less in the post as an undersized 5-man, his role last season. Offensively, Adams has seen a slight decline from ’23 to ’24 (+0.60 to +0.44).
Kevin McCullar’s value-score improvement from last season to this season, on a per game basis, is +3.98. This is better than Jalen Wilson’s improvement from ’22 to ’23 (+3.34), Ochai Agbaji’s improvement from ’21 to ’22 (+3.09), and Christian Braun’s improvement from ’21 to ’22 (+3.83). The largest season-to-season jump on record is Frank Mason’s ’16 to ’17 improvement (+4.52). Thomas Robinson from ’11 to ’12 was +3.67. Tyshawn Taylor from ’11 to ’12 was +3.65. Other large jumps in the past include Raef LaFrentz from ’95 to ’96 (+3.67), Keith Langford from ’02 to ’03 (+3.59), and Drew Gooden from ’01 to ’02 (+3.41). There have certainly been other great career developments of steadier growth, but in terms of having such a large leap in value production in consecutive years, what McCullar is doing this season is very special.
Hunter Dickinson’s two worst value-score games (-10.40 vs. Marquette, -6.23 at UCF) have coincided with both of KU’s losses. Through 15 games, Hunter is currently KU’s second-most valuable player this season, but is neck-and-neck with Kevin for this distinction. If both can finish the season above +5.00 per game, they’d be the first duo since the Morris twins in 2011 to do this for a Kansas team.
Jamari McDowell has not proven to be the answer to the team’s poor wing play. The freshman has produced the worst Per 100 value of any scholarship player, at -7.91. After some initial stingy defense, Jamari has gotten scored on quite frequently in limited minutes. At best, McDowell is only going to be a role player and defense-first guy this season.
Parker Braun has been KU’s 5th-best player, and might warrant more court time. He is athletic and experienced. His value scores through 15 games have been 7 positive, 7 negative, and 1 right at 0. While he is at Kansas primarily to back up Hunter, there have been a few moments where Self has gone “small” and played Adams as the 5 when Hunter is sitting. But this leads to more minutes for guys (Jackson, Harris, Timberlake) that aren’t playing as well as Braun has, and haven’t shown enough offensive firepower to compensate the loss of not having a true center inside. Parker isn’t necessarily someone who will win you the game, but he is someone who can keep you in it until Dickinson can return.
(Long article. Scroll down to bottom for the summary)
During the midst of the 2023 season, KU had a 3-game losing streak and a date at Rupp Arena against a talented Kentucky team. Dajuan Harris was coming off poor showings in his last 2 games, and questions surrounded a team that had no true center in the starting rotation and a pass-first point guard who wasn’t a natural scorer.
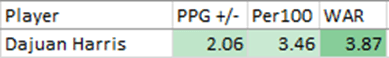
Kansas went on to beat Kentucky that game, bolstered by great play from Jalen Wilson, but also a good outing from the rest of its starters, including its point guard Dajuan Harris. From that game forward, KU would play 16 games to close out the season. Harris produced a +3.22 per game value score, indicating that he was worth over 3 points per game to Kansas than a “bubble” level player would be. During this stretch, Harris was playing his best ball, comparable to a junior-year Frank Mason (2016 season) or senior-year Tyshawn Taylor (2012 season). Harris was doing it in different ways than these scoring guards; certainly through defense first, but he was also adding value on offense thanks to both shot-making and assisting.
In fact, during the closing stretch of 2023—KU’s final 10 games, Harris produced offensive value of +1.06 per game. This was third on the team behind Wilson and Gradey Dick over that period. While KU getting bounced in the Round of 32 wasn’t fun, no one can blame the play of Dajuan Harris. He was solid against the Razorbacks on both ends, adding about a point-and-a-half both ways and +3.30 points overall. For the season, Harris contributed +2.06 points per game above bubble. Roughly, based on his play, Harris was worth 2 points a night when compared to an average player on a bubble-team.
The elements for Dajuan Harris having a successful 2024 were all in place. He was coming in as a 5th-year-in-the-program player (having redshirted), 2-year starter who saw his game improve each season. Always a defense-first, pass-first player, Harris had improved during the back-half of his junior season and started to be a net contributor to the offensive scheme. This development is common, but not guaranteed, among Bill Self program guys. Harris was making the same strides in his game that others had before him. Some of these strides were unique to him, but he was playing better and making a positive mark on a program that has had numerous talented players come through.
Coming in to the 2024 season, Harris was projected to be a +2.50 player on the season, a conservative improvement on his 2023 value scores. Harris was expected to see a slight bump on both offense and defense. It wasn’t that his expectations were too high. If anything, they were somewhat low. By all appearances, Harris had figured things out. His defense had been consistent throughout his career, and now his offense had finally come around. With Hunter Dickinson coming in, his assist numbers would reach career highs. His shooting and scoring would still be there, but he wouldn’t need to do too much.
But through 10 games, this hasn’t been the case. Not only is Harris not performing to his projections, he isn’t performing anywhere near what he is capable of. He is playing worse than in 2023, by a long shot. He is also playing worse than he did in 2022, when he was a role player on the national championship team. But not only that, Harris is worse than he was in 2021 as a red-shirt freshman who rarely shot and got taken advantage of by stronger players.
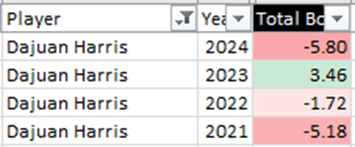
Looking at Per 100 numbers, that is the value a player adds (in points) to his team over the course of 100 possessions, Harris’s development looks like this:
2021: -5.18
2022: -1.72
2023: +3.46
Players tend to improve as they age through their college careers, although again not everyone develops in this straight-forward of a manner. Some players have drops in value or flat-line after they reach certain points. So, if Harris was merely on pace to produce a similar or slightly worse season than last year, this wouldn’t be out of the ordinary. Even if Harris was noticeably worse, say close to 0.00, it would be disappointing but not unprecedented. Unfortunately, this isn’t the case, either. In fact, Harris is playing the worst basketball of his career at Kansas.
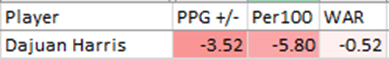
2024: -5.80
Again, this is a per possession number, so it takes into account the fact Harris is playing more than he has in past seasons. On a per possession basis, Harris is worse than a bubble-player by 5.80 points, which is even worse than his value during his freshman season of 2021.
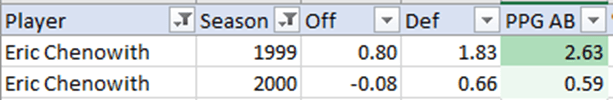
If we look at it from a per-game mark, it looks even worse. At -3.52, Harris is producing the worse per-game mark of any Jayhawk rotation player by over a full point per game (2019 Quentin Grimes -2.40). Harris is also worse than his prior season at over 5.50 points per game. Never has there been such a drop-off, year-over-year. KU has had players unexpectedly decline, Eric Chenowith’s junior year (2000) being one example (he went from a +2.63 player to a +0.59 player), but it has never been this dramatic.
Breaking down Harris’s play so far, we’ll first look at offense, comparing his 2023 and 2024 seasons.
Going through each line, we see that Harris’s efficiency has slipped from 1.11 to 1.03. What makes this worse is that KU hasn’t faced its meaty conference schedule yet. Not only is Harris less efficient, he is less efficient against an easier schedule. Harris is accounting for nearly 2 fewer points per game on offense than he did last year, despite playing more minutes. Harris is shooting worse overall than he did last season (49.5% vs. 45.2%). He is also shooting less, despite the team needing him for more production. In turn, his impact is less this season. Once we adjust for opponent, we see that Harris is 2 points worse (in terms of overall value) on this end that he was last season.
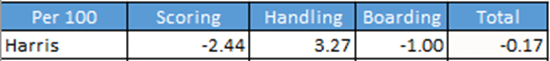
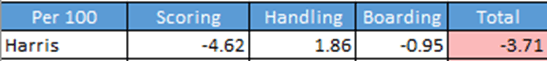
Breaking down into offensive categories on a Per 100 possession basis, we see (2023 vs. 2024):
Not only is Harris’s scoring down, his handling (turnovers/assists) is also down. Only his boarding, or offensive rebounding value, has changed for the better. But in terms of overall value, this increase is negligible.
Defensively, Harris has declined even more.
Harris went from a stingy defender, giving up 9.2 points per 60 possessions to allowing 11.8 per 60. The other important category, possession winners (PW), went from 5.3 to 4.2 per 60. A player needs to win possessions to add value. Harris is getting fewer steals, forcing fewer turnovers, and not rebounding any better while giving up more points to his man. All despite playing an easier schedule when compared to 2023 numbers. This leads to a player who is worse on the defensive end by more than 3 points a game.
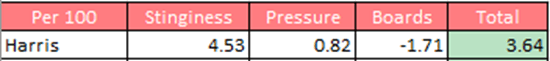
His Per 100 numbers on defense, broken down into categories:
Harris went from KU’s best defender in 2023 to its worse in 2024. How? Well, mostly by giving up too many points to his opponent. A stinginess score in the red means he has to add value from generating turnovers (which he hasn’t done well at in 2024) or rebounding (which is marginally better, but as a point guard, not ever going to be the area where he adds defensive value). This is the biggest disappointment in Dajuan’s decline. He was the Big 12 defensive Player of the Year last season. Now, he’s a liability most games.
2023 vs. 2024. Harris is over 5.50 points per game worse in 2024. He is over 9.20 points worse Per 100. He has also gone from a season where he added 3.87 Wins Above Replacement to one where he has lost 0.52 WAR.
Should Harris be benched?
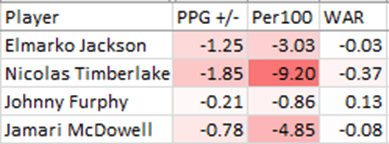
Dajuan is putting up historically-bad numbers in a season which has him playing historically-high minutes. Clearly, something isn’t working with him. But if KU went to the bench, who would replace his minutes? We can’t consider Adams, McCullar, or Dickinson/Braun, players whose minutes are already maximized or aren’t suitable replacements for a guard. Let’s look at KU’s other four guards/wings in terms of player value. Remember, based on the roster, KU needs to have at least 1 of these guys on the court at all times right now. If Juan gets benched, you’ll need 2 of these 4 to play at once.
There’s a bunch of red here. For one, Nicolas Timberlake is playing worse than Harris on a per possession basis. Next, we can look at the play of Jamari McDowell and Elmarko Jackson. Neither has been much better than Harris. McDowell in particular has struggled recently after a hot start. Of these four, only Furphy has produced near bubble-level value and positive WAR.
So, let’s grant that Furphy has been better than Harris. Who else do you go with? Elmarko has had his poor moments. McDowell is very limited on offense, and his defense won’t likely become elite anytime this season. Timberlake is an even worse option. Another consideration is that, when you take Juan out, you need Kevin McCullar to run more point/generate more offense. Sure, you still have Elmarko and maybe part of the solution is giving him the keys from time-to-time. But if he’s been struggling as an off-guard with less pressure, what chance does he have being the guy to get everyone organized and the offense started?
KU’s best chances are still with Harris. He cannot, surely cannot, continue to play as poorly as he has. As a 3-year starter, Harris put up back-to-back seasons that were better than anyone else on the list above. If he could just match the 25% percentile of his play over the past two years, he’ll be much more valuable on the court than more minutes for the other four guards/wings.
Silver Lining
The good news is that Harris will not continue to play as poorly as he has. Yes, it’s been a disappointment. Here are many reasons to consider that his play will tick up.
He will get exploitable matchups as teams game plan around stopping Hunter/Kevin/K.J. He will get open layups, open 3’s, and other opportunities.
He will have a few defensive shut-down games to boost his defensive score.
As schedule gets harder, Harris will play up to his opponent. While he hasn’t done well against KU’s better opponents, he’s still better against KU’s 5 power-conference foes (-2.87 per game) than the 5 lower-tier opponents (-4.17 per game).
Harris’s score can naturally climb faster given how poor he’s been. Just a few positive games can be enough to change the narrative.
The team is currently 9-1 despite him playing poorly. Juan hasn’t been responsible for a loss, as the 14-point Marquette loss was the fault of many poor showings.
Precedence of Tyshawn Taylor in 2011. Taylor was -3.89 per game during 17 conference regular season/tournament play yet still finished the season with a solid NCAA Tournament of +3.35 per game (even his play during the VCU game wasn’t terrible). So other good players have gone through disastrous stretches but still picked things up later on.
Precedence of Remy Martin in 2022. Harris’s former teammate Martin had a disappointing regular season (-0.05 per game). But in his 9 tournament games (Big 12 + NCAA’s), Martin put up +3.66 per game in value, hitting huge shots in key moments during KU’s National Title run. Again, like Taylor, we see improvement when it matters most.
If Harris can get back to the level of play he had in 2023, his tough start to 2024 won’t matter at all.
Conclusion
Here are the key points. Dajuan’s performance through 10 games this season has been his career worst. Compared to other KU starters, Harris has been worse than any other Jayhawk in 30 years. He has seen decline in his game across all categories, but the primary problems have been with his scoring and defensive coverage. He isn’t scoring enough but is letting his man score too easily.
However, despite his poor play, Harris is a necessary component to this team. His would-be replacements are either worse or wholly unequipped to carry the load as a Big 12 point guard. Not only does he need to play, he needs to play substantial minutes for this team.
The expectation should be that Harris improves and is back to being a positive contributor by season’s end. There is precedent for good Kansas guards figuring it out by NCAA Tourney time. As KU is winning despite his poor play, a solid Dajuan Harris can make this team a true national title contender.
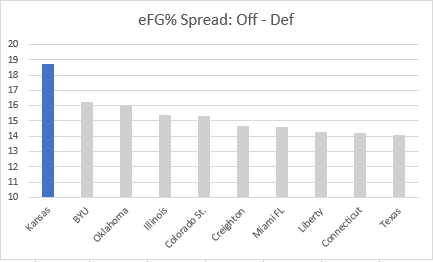
KenPom has Kansas as the 6th best eFG% offense and the 14th best eFG% defense in nation, counting only D-1 matchups. This spread, of 18.7%, is the best in the nation and nearly 2.5% better than the second-best of BYU. To reference, the difference from #2 BYU to the #10 team is smaller than the gap between Kansas and BYU. Which is to say, KU’s shot quality is far superior to its opponents in the brief number of games played so far.
While KU is winning the shot quality battle, it is losing the other battle, that is the battle for net extra possessions. A net extra possession means offensive rebounds minus turnovers. Teams that turn it over too much lose out on chances to shoot. Teams that hit the offensive glass add shooting chances. We want to find the net of these numbers.
Collectively, KU’s opponents have had -1 net extra possessions, meaning KU has forced 1 additional turnover than it has allowed offensive rebounds. This doesn’t sound all that bad on the defense’s behalf, until you see what KU’s offense has done. In its 6 games, KU has turned it over 41 more times than it has got an offensive board, meaning the team is -41 in this metric. If we find the difference between these numbers, we see that KU’s opponents have had 40 more chances to score than KU has this year, solely due to turnover and offensive rebounding differences. This works out to -6.7 per game. KU is effectively getting 7 fewer scoring chances than its opponent on average. If we only consider the top opponents, who to this point are Kentucky, Marquette, and Tennessee; KU is -11.3 per game. Knowing this, its amazing the Jayhawks were able to take 2 of those 3 games.
Opponent
KU NEP
Opp NEP
Diff
North Carolina Central
-6
0
-6
Manhattan
-3
-6
+3
Kentucky
-6
+7
-13
Chaminade
-8
-5
-3
Marquette
-8
0
-8
Tennessee
-10
+3
-13
TOTAL
-41
-1
-40
NEP means Net Extra Possessions
The silver lining is that KU should improve on this possession battle. Much of this can be attributed to effort and newcomers learning how they need to play. Valuing the basketball and hitting the glass is something that will be expected for those looking to earn minutes alongside the “big 4” of Harris, McCullar, Adams, and Dickinson (KU also needs more from Harris and Adams on this front). As long as KU continues to get good looks, and having Hunter is a large reason for that, they should be fine. In tonight’s tune-up against Eastern Illinois, KU needs to dominate the glass and turnover margin in order to prepare for Connecticut and other tough games that will come later in the year.
The 2023 version of the Champions Classic proved to be a classic, with a high-action, fast-paced game between the two winningest programs in college basketball history. In the end, our beloved Jayhawks prevailed, but not before giving up a 9-0 lead and being down as much as 14 in the second half.
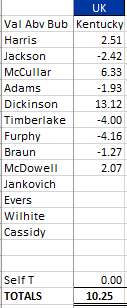
First things, first. Here are the PPGAB +/- scores from last night, and these will be referenced below. This was quite a game, as so much happened.
Game Notes:
Hunter Dickinson (27 points, 21 rebounds) became Kansas’ first 20/20 player since Thomas Robinson (2012 season vs. North Dakota) and the first to record 20 and 20 against a power conference opponent since Nick Collison (2003 season vs. Texas).
This milestone featuring traditional stats is paralleled by a team-best +13.12 value score. This value score is Dickinson’s second +10 game of the season (NCCU) and his second team-best game (Manhattan).
Dickinson’s value score was quite bad to begin the game, as the charting indicated he was responsible for 16 of Kentucky’s first 24 points due to sagging defense and over-helps (i.e. initiating late double-teams that allow for an easy escape pass). Over the rest of the game, he was not responsible for any more points allowed. It’s estimated that Dickinson’s opponent-adjusted value score over the final 26 minutes was better than +20.
As rare as Dickinson’s 20/20 milestone was, an even rarer event occurred with Kevin McCullar recording the program’s third official triple-double in its history. (This excludes the Chamberlain era, when certain stats weren’t officially kept). McCullar was the first Jayhawk to get the triple-double by registering 10+ assists, as the prior two (Cole Aldrich, Jeff Withey) did so with points, rebounds, and blocks.
McCullar’s 12 point, 10 rebound, 10 assist night was also bolstered by a stingy defensive effort. McCullar’s defensive PPGAB +/- of +5.41 is the most valuable defensive performance of any player in any game so far this season.
McCullar’s triple-double came in the last second of the game, literally, as he grabbed his 10th board following a missed 3-point shot from Kentucky.
The Kansas/Kentucky game was a high-paced game, with 81 recorded possessions from Charting the Hawks. KenPom’s box score shows 83, and his line score shows 80. Either way, the fast tempo allowed more possessions which in turn allowed more opportunities for Dickinson and McCullar to record their milestone nights.
KU is currently the fastest-paced team in KenPom, with an adjusted tempo score of 77.2. In the Self-era, KU’s highest rank on the tempo metric is 40th (2004), and the Jayhawks have only been above 70.0 in terms of adjusted tempo 2 times in 20 seasons under Self.
Not to be overlooked, Dajuan Harris scored a career high 23 points on 5/6 shooting from 3 (with his only miss being a desperation heave following a broken play with the shot clock expiring). Harris graded out as KU’s second-best offensive player against Kentucky.
This is in stark contrast to Harris’ point output in the team’s prior 2 games. Against North Carolina Central, Harris didn’t take a shot from the field or line, and against Manhattan he scored only 2 points on 1-4 shooting. Yet when Kentucky went under screens or put help defenders on the likes of Hunter Dickinson, Harris was there to make them pay by his ability to score.
Defensively, Harris’ game was not his sharpest. He went under multiple screens leading to easy Kentucky 3-point opportunities and gave the Wildcats some run-out layups by careless live-ball turnovers. In all, he was responsible for 19 Kentucky points and graded out as the second-worst defender for Kansas in the game, slightly ahead of K.J. Adams.
Speaking of K.J. Adams, the junior continued his explosive scoring with a 16 point outing on 8-11 shooting. While not a shooter, he scores off of cuts, lobs, and put backs better than almost anyone I’ve seen. Adams also added 3 assists.
Adams’ defense was the team’s worst, and he fouled out with under 4 minutes to play from a careless loose-ball foul, gifting Kentucky 2 free throws.
Freshman Jamari McDowell was Adams’ replacement, despite not playing during the first 36:14 of the game. McDowell would play the final 3:46, during which KU would go on a 14-3 run to win.
McDowell didn’t allow a point to an explosive Kentucky offense, continuing his streak this season. In nearly 17 1/2 minutes of play, McDowell has not allowed his opponent to score.
McDowell also put the finishing touches on the win, grabbing a rebound following a 3-point miss that, had it gone in, would have tied the game for Kentucky. After being immediately fouled, McDowell calmly made both free throws to set the final margin of 5.
In the first 3 minutes and final 3 minutes of the game, KU outscored UK 20-1. The Cats were 14 points better during the middle 34.
Kentucky shot 38 3 point shots, equaling the total of FG attempts they had inside the arc. The team from Lexington was 9-18 to begin the game, allowing them to first come back from 9-0 and then take the lead. However, they would cool off considerably, hitting only 3 3-pointers in the second half (none after the 8:00 mark), and finish 12-38 for the game. This works out to 31.6%, which is worse than the 33.3% the Jayhawks shot (6-18).
Freshmen reserve guards Shepperd and Dillingham went 7-9 from 3 for the Wildcats. The rest of the team, including Antonio Reeves, went 5-29 (Reeves 3-17). When Kentucky was making its 3’s, it looked unbeatable. It was running, hustling for loose balls, and scoring in spurts. But this pace, which helped Kentucky build up a 14 point lead, allowed Kansas to come back once the shots stopped falling.
The recent 2024 player projection write-up has KU with an average game score of +8.51. This correlates to a 2-seed on average. This post will look at KU’2 2024 season from a median, worst case, and best case scenario.
Median
The median scenario sees the Jayhawks with a +8.51 average score and 2-seed and was the scenario predicted in the link above. In this scenario, KU uses a strong starting 5 and solid 6th man to find success amidst a difficult schedule. The median projection views KU’s offense being dependent on Hunter Dickinson to score and create. Among the 9 rotation players, only Dickinson and fellow transfer Nicolas Timberlake are expected to be better offensive players than defensive players. So while questions about outside shooting and guard isolation scoring will come up during the season, this will be balanced by excellent guard/wing defense from the likes of Dajuan Harris, Kevin McCullar, and K.J. Adams.
Projecting NCAA Tournament results are difficult due to the single-elimination format, but as a 2-seed KU would have a good shot of getting out of the first weekend. The median scenario would see this team as an Elite 8/Sweet 16 team most often, with still an outside shot of making a Final Four. If this were a betting website, the over/under for tournament wins would likely be 2.5.
Worst Case
The worst case scenario implies a reasonable worst case scenario (KU could lose its starting 5 to season-ending injuries, but this is very unlikely). In this scenario, one of its key players struggles with an injury and this weakens an already depleted roster. KU’s offense could also struggle as teams force McCullar and Adams to make jump-shots while forcing the ball out of Dickinson’s hands. On defense, while it’s difficult to see KU being bad on this end, teams could put Dickinson in high-ball pick-n-rolls and take advantage of Self’s propensity to switch screens.
If KU were to struggle enough, it could lose games it was projected to win preseason and find itself slipping down into the 5-6 seed range. In this range, a First Round upset loss is more likely and a second-weekend in the NCAA’s less likely. For KU’s worst case scenario to be a comfortable NCAA Tournament team is something most teams can’t say a few weeks before the season starts.
Best Case
The best case scenario is the most fun to think about. Again, this is a reasonable projection. We aren’t expecting KU’s three true freshmen to all play as 2024 lottery picks or for Timberlake to average 25 points per game. But we do see a situation in which Hunter Dickinson’s numerous offensive skills lift the games of other around him. We do see a reasonable chance for KU’s defense to work together so well it takes care of potential problems from a few of its weaker links, and becomes the best defense in the country. Shooting improvements from McCullar and Adams can make a difference in key situations. We aren’t projecting all of these things, but there is a chance things can work out well.
In this scenario, KU earns a 1-seed for the third consecutive year. Assuming Coach Self can stay healthy and KU’s draw isn’t as tough as last season’s, a run to the Final Four and beyond is certainly within reach. The average 1-seed wins about 3.4 games per tournament (since 1985), so an over/under of 3.5 wins would be a reasonable line. Winning the National Championship can be a goal for this team.
In the Bill Self era, a common critique is that KU teams struggle in the Round of 32. A similar complaint is that KU teams struggle in the second game of the weekend series in the Tourney, i.e. not just the Round of 32 but also the Elite 8.
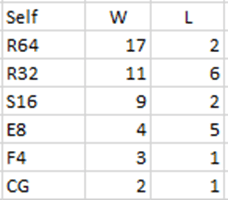
Let’s look at Self’s W-L record in the NCAA Tournament by round while at Kansas. *These games include the 2023 Tourney, in which Norm Roberts was the acting coach on the bench as Coach Self was recovering from his health issue.
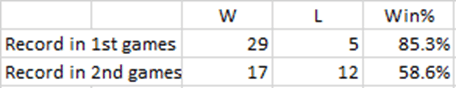
There is a steady drop-off from the R64 to R32, but this should be expected given that the second round games will be against good teams, not sub-100 KenPom teams as it is most years in the first round. But when KU teams make it to the S16, they do quite well, only to see another steep drop in the E8. The next table compares the records of KU in the first games of the Tourney pods (R64, S16, F4) against the second games of these pods (R32, E8, CG).
This shows quite a contrast. Again, opponent quality is likely at play here. But there does seem to be some indication that KU plays better in its first games (when it has time to rest/prepare) than its second games (which occur with only one day of rest/prep). To test this, we will see how KU did against its projected margin using Vegas odds.
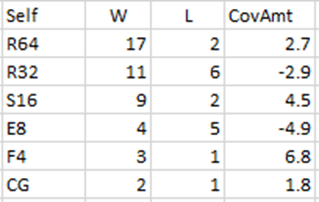
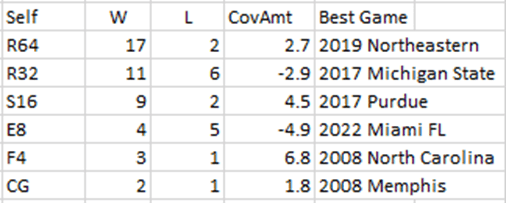
This table recreates the earlier one, with the average Cover Amount column added. This column shows how much better (or worse) KU does in points against its cover amount. For the R64, KU’s average margin is 2.7 points better than what the lines showed. But when we get to the R32, KU is 2.9 points worse than their lines. The last time KU covered a R32 was in 2017 vs. Michigan State. They are 0-5 ATS in this round since. The second weekend games are even more pronounced. KU is +4.5 in the S16 and a shocking -4.9 in the E8. And this was with KU going 2-0 in its last two E8 appearances (2018 vs. Duke, 2022 vs. Miami FL). Before 2018, Self’s teams were 10.28 points worse than expected on average in the E8 round.
For whatever reason, KU teams under Self do better in the NCAA Tourney when they have more time to prepare. Last, we’ll expand the table again to show KU’s best performance (against Vegas expectation) during the Self era.