Starting in 2024, the Big 12 will have 16 teams. Or even more. With Florida St. jostling to leave the ACC, thus making things shaky over there, and commissioner Brett Yormark looking to expand the Big 12’s footprint, this could change. But for now, the plan is 16 teams.
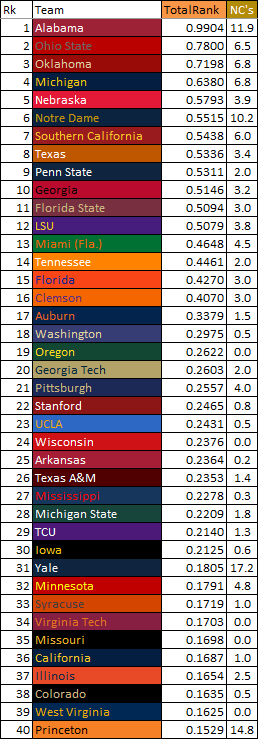
However, there aren’t a ton of historically great football programs in the Big 12. Since 1869, the first year college football emerged, teams have been playing and building up a profile of their program. Once we combine all end of season poll rankings, bowl appearances and victories, and weight the recent BCS and CFP championships, we get a defensible list of programs rated from best to worst. For the new Big 12, here’s the list (and associated ranks).
29. TCU
37. West Virginia
39. Colorado
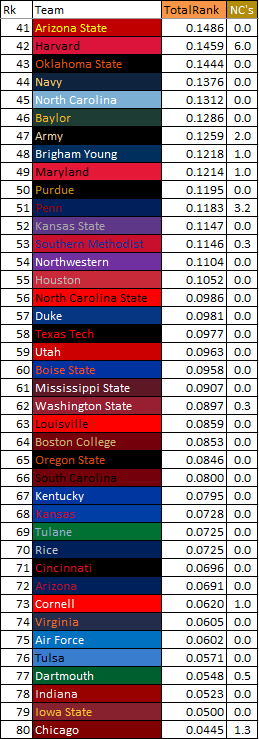
42. Oklahoma State
44. Arizona State
46. Baylor
51. Brigham Young
52. Kansas State
55. Houston
57. Texas Tech
58. Utah
68. Kansas
71. Cincinnati
72. Arizona
78. Iowa State
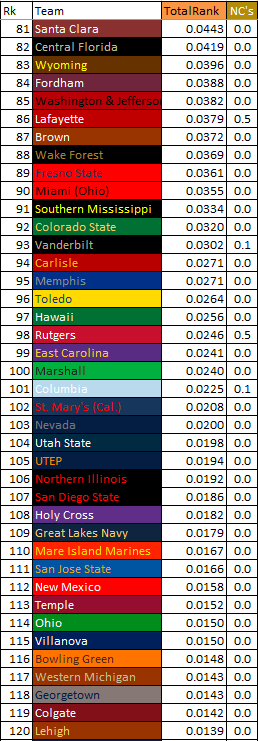
82. Central Florida
This collection of programs also has 2.8 National Championship Shares. See here for an explanation of NCS. Of this group, only 2 programs have made the CFP (TCU/Cincinnati), and only one program (TCU) has made a national championship game appearance since the beginning of the BCS/CFP era (1998).
The average ranking is 55.1, and the median ranking is 53.5 So, historically, these teams haven’t dominated. But let’s just look at how these teams fare from the beginning of the BCS/CFP era (1998-on).
20. TCU
24. Oklahoma State
28. Kansas State
29. Utah
30. West Virginia
33. Cincinnati
35. Baylor
43. Central Florida
44. Brigham Young
49. Texas Tech
50. Arizona State
53. Arizona
58. Iowa State
59. Colorado
60. Houston
72. Kansas
The average ranking here is 42.9, with the median ranking at 43.5. And a couple programs creep into the top 25, something that the conference failed to get when looking at all-time rankings. Looking at some of the teams that left the Big 12 semi-recently; Nebraska ranks 23, Texas A&M 32, and Missouri 37.
So, these programs have been better recently than their long-term history suggests. Now let’s rank these teams just from the beginning of the CFP era, which was 2014 (10 seasons).
12. TCU
16. Oklahoma State
20. Baylor
22. Utah
23. Cincinnati
29. Central Florida
31. Kansas State
39. Iowa State
41. West Virginia
43. Arizona
44. Houston
48. Brigham Young
53. Arizona State
65. Colorado
81. Texas Tech
114. Kansas
The average rating is 42.6, with the median at 40. The top teams are better, with 5 programs in the top 25 over the last 10 seasons. Of those who left, Nebraska is 85, Texas A&M is 30, and Missouri is 35 in this span. Just being included as a member of the Big Ten or SEC does nothing to help your program necessarily.
Who knows how things will play out, but the Big 12 will get a guaranteed team to the 12-team CFP next season, and depending on how things work out, might get 2 or even 3 with 6 available at-large berths.
Let’s look at the other new conferences. First, the new SEC:
1. Alabama
3. Oklahoma
8. Texas
11. LSU
12. Georgia
14. Tennessee
15. Florida
17. Auburn
25. Arkansas
26. Texas A&M
28. Mississippi
36. Missouri
60. Mississippi State
66. Kentucky
67. South Carolina
93. Vanderbilt
Average rating is 30.1; median is 21. The total NCS is 37.5, which is considerably more than the Big 12. We won’t list ratings from 1998 or 2014-on, but since 1998-on the new SEC has 6 top 10 teams. It has won 6 of the 9 CFP games with a chance to win 7/10 if ‘Bama can pull it off this season.
The new Big 10 will add four teams from the West Coast, and it will have the following rankings:
2. Ohio State
4. Michigan
5. Nebraska
6. Southern California
9. Penn State
18. Washington
22. Oregon
23. UCLA
24. Wisconsin
27. Michigan State
30. Iowa
32. Minnesota
38. Illinois
48. Maryland
49. Purdue
53. Northwestern
79. Indiana
100. Rutgers
Average rating is 31.6; median is 25.5. Again, this is better than the new Big 12 to be sure. The total NCS is 35.3, just slightly below the SEC’s. Ironically, the oldest of these programs, Rutgers (which played in the first college football game ever), is also the worst at #100. Rutger’s only national championship share (of 0.5) came in this first season, where it is recognized as co-champs alongside Princeton. Rutgers has never won a bowl game above Tier III (bowls are tiered into four categories based on strength), being one of only a few power conference teams with this distinction.
Last, we will look at the current ACC. We will include Florida State and Notre Dame since ND plays around 5 games against ACC opponents each year.
7. Notre Dame
10. Florida State
13. Miami (Fla.)
16. Clemson
19. Georgia Tech
20. Pittsburgh
21. Stanford
33. Virginia Tech
34. California
35. Syracuse
45. North Carolina
54. Southern Methodist
56. North Carolina State
59. Duke
62. Louisville
64. Boston College
74. Virginia
88. Wake Forest
Average rating is 39.4; median is 34.5. NCS is 29.7. Again, the Big 12 is the outlier in terms of national championship shares. Since 1998, these 18 ACC schools have two top-10 teams (Florida State at 5 and Clemson at 6). However, the average ranking is 43.2 and median is 39.5. Those average and median
rankings are comparable to the new Big 12 programs during this time.
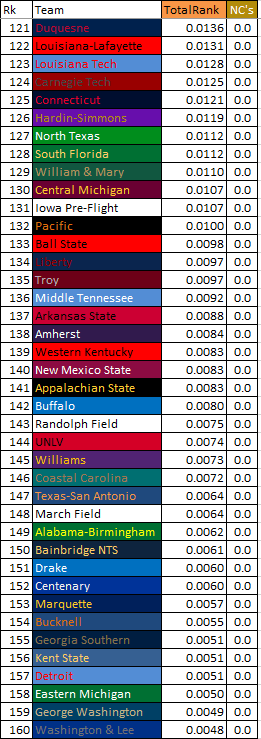
The “others” are teams that don’t have a spot in one of the current big four conferences. These include Oregon State and Washington State. Of these “others,” there are a total of 46.8 NCS. Most of these came from Ivy schools early on in the history of the sport. Other schools such as Boise State and Tulane are hoping to improve their conference affiliation and boost their program’s profile should more rounds of realignment see them added somewhere. But there’s not much these teams can do at the moment.
Should I stay or should I go?
Soon after being excluded from the final four-team CFP, Florida State made public its intentions of leaving the ACC. This will be difficult considering that it signed into a GOR agreement with the other ACC schools, but only the future knows what will happen and how long it will take for things to change. The SEC doesn’t seem to want Florida State, and the Big 10 is also hesitant according to reports. The Big 12 would love to add FSU (alongside teams like Clemson and North Carolina) as a way of jockeying itself as a strong third conference to challenge the emerging hegemony of the two others. Where this would leave the handful of other ACC teams remains to be seen.
There are so many issues at play here, but let’s start with the playoff formats as they’ve evolved. Florida State has begun to feel that the ACC was beginning to not be competitive enough for it to compete for national championships, so when the committee essentially agreed by leaving the Seminoles out, this was the straw that broke the proverbial back.
But, is this the case moving forward? With a 12-team playoff, FSU would have been hosting the 12 seed Liberty Flames and then gotten a chance to take on the 4-seed Alabama Crimson Tide. Furthermore, had things gone differently in the SEC (such as Auburn holding on to win the Iron Bowl), FSU would have likely remained in. The 12-team playoff should take care of the problems of the BCS/4-team CFP era, which was the oddities and vagaries of the college football season leading to controversial selections. A large enough playoff at least gets all good teams into the final tournament, although the seeding controversies (i.e. who gets a bye) will likely remain. The point of this segue is to argue that Florida State might be best to remain as the top dogs of the ACC. With Clemson slipping, and Notre Dame not technically playing for a conference bid, FSU is primed to finish with a strong record each year and have a good chance to win the league on a consistent basis. No ACC league champion will get left out moving forward.