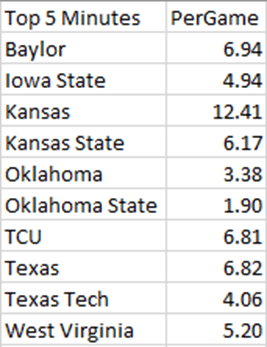
“Starters” reflects the Top 5 players on the team in minutes played. Due to injuries, rotation patterns, and so on; what constitutes a starter might differ from team-to-team. The term “crunch-time five” might also apply. These numbers are in Points Above Bubble through 1/29/23:
Kansas leads the league with a top five which is collectively 12.41 points above bubble per game. There is a large gap until you get to the rest of the pack. The list is in alphabetical order.
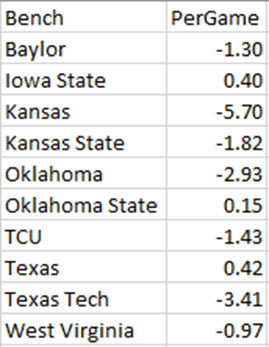
The bench refers to the rest of the roster combined. Walk-ons are included, but their numbers are negligible. This shows the collective points against bubble of the reserves in a per game ratio:
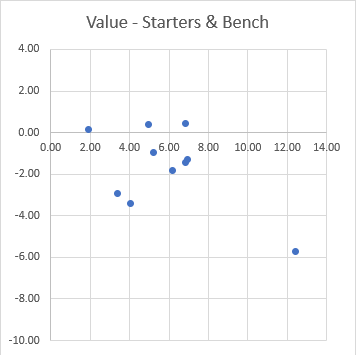
The best bench is Texas’ bench, which is slightly above bubble-level. Iowa State and Oklahoma State are also above-bubble. As you can see, Kansas’ bench is by far the lowest. The below chart graphs this out, putting the starters on the X-Axis and bench on the Y-Axis. To the right and up is where you want your team to be. See if you can tell which button Kansas is represented by:
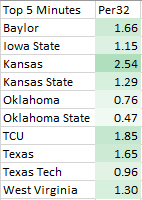
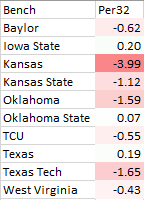
A Per32 look is also instructive. First, look at the average starter for each team in a 32 minute span. This will be a good estimate of how much value a certain team’s average starter can provide if playing a decent load of minutes.
Now the same thing, just with the bench.
KU’s starters are clearly the class of the league, but its reserves are so far behind it almost boggles the mind. KU’s bench isn’t just bad, it’s also the most noticeable unit in this exercise. Any bubble-level player from past seasons, such as a freshman Christian Braun or a sophomore Landen Lucas or a junior Naadir Tharpe, would make this team 2 to 3 points better per game. KU can only make this work as good as it has because it plays its starters the bulk of available minutes (77.4%, leads the conference). If it lost anyone of its starting 5 for a decent amount of time, it would get noticeably worse.
One more note about the Kansas starters. If you removed Jalen Wilson, the other four starters would still produce an above-bubble value which is above 6.00 points per game. That group would still be 5th in the conference among starting 5’s, but very close to the other 4 teams and under 1.00 point per game below the new first-place team. With Jalen, its not even close who has the best starting 5. Effectively, Jalen’s excellent season is mostly being washed away by the team’s poor bench.
In creating the ranking of Big 12 players, there was the ability to explore more regarding the makeup of the conference. Here are some additional things that stand out about the makeup of players in the Big 12:
The League is Senior-Heavy. While experience has always mattered, the post-pandemic and transfer-portal era has produced a large share of veterans. Using the classifications from KenPom, 36% of all Big 12 players are seniors. When you look at minutes played, the senior-heaviness of the conference becomes more apparent. 51% of the minutes played by Big 12 players have been played by seniors. Iowa State has 8 seniors who have played at least 100 minutes. For Texas and West Virginia, this is 6. K-State and OSU have 5. Kansas is the only team with fewer than 2 seniors in the main rotation (Kevin McCullar). In many cases, a player labeled as a senior is in his fifth year, however there are some 4th year players classified as seniors which does confuse things somewhat. But with 2021 not counting against eligibility, one would expect the trend of senior-heavy rosters to continue for the next two seasons.
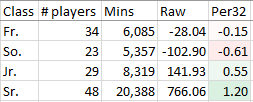
Not only do they play more minutes than the other three classes combined, seniors have collectively produced far more value for their teams. The following chart shows how much value the typical player produces by class. The important column is the one on the right, labeled Per32. This is to set player-value by class over a 32-minute span. We’ll use 32 minutes (80% of a non-OT 40-minute game) to serve as a proxy for the average minutes for a starter in Big 12 play.
When weighted by playing time, the average senior produces 1.20 points above-bubble over 32 minutes of play. The other three classes, when combined, are effectively 0.00. Interestingly, freshmen are out-performing sophomores. This appears to be an effect of the “one-and-done” system. Two Baylor would-be sophomores (Sochan and Brown) went to the NBA draft and are now pros. In turn, two excellent college freshmen in the Big 12 (George from Baylor, Dick from Kansas) are poised to be first round picks in this year’s draft. Were the NBA draft rules different, either the early-entrees would still be in college as sophomores or the freshmen might not have come to school. This would make each class’s value scores look different.
Jalen Wilson is another interesting case. Due to injury as a true freshman, he redshirted. Although he is listed as a junior, by age he is a senior. Think how much wider the senior/junior gap would be if he were classed as a senior. To a lesser extent, this also applies to Dejuan Harris who is a senior by age but junior by class. Last, Joseph Yesufu is classed as a junior even though he is in his fourth season. With him getting a fifth-year of eligibility, KU effectively had both his 2022 and 2023 seasons be as “juniors.” Again, classifications are all a mess in this era.
By class, here are the best 5-players in the Big 12 through 1/26/2023.
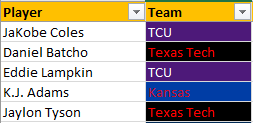
Seniors
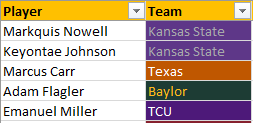
Juniors
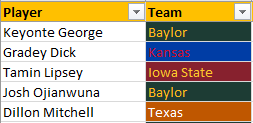
Sophomores
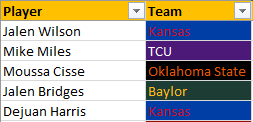
Freshmen
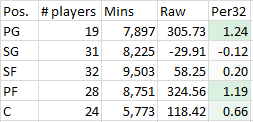
Point Guards and Power Forwards Excel. This is partly due to the two leading Big 12 players, Jalen Wilson (PF) and Markquis Nowell (PG), having separated themselves from the pack. Other great PG’s in the league include Marcus Carr, Adam Flagler, and Mike Miles…all in the Top 6 of all players. Regarding PF’s, Emanuel Miller (TCU), Aljaz Kunc (ISU, currently injured), and Kalib Boone (OSU) are also having good years.
Classing players into a traditional position (PG, SG, SF, PF, C) is harder that it used to be. A few things have happened. One, there are more “positionless” players and systems. Two, teams are becoming more perimeter-oriented, playing 4-out and often 5-out systems without true post presences. This can be handled one of two ways. One is to recognize the change in the game and place players in positions which they’d historically be classed. Therefore, a rotation might play a PG, two SG’s, and a SF alongside a PF. The other way is to do what Pomeroy essentially does, and continue to utilize the traditional position names regardless of the style being played. So when a team plays a small-lineup, this just means that whoever its biggest/most interior player is gets classified as the “Center.” Even a SG might become that line-up’s “Power Forward.” The logic to this seems to be that, regardless of the style you play, you are going to be competing against someone of whatever position you are at, 1-5. To apply this to KU, this would mean that K.J. Adams (as a small-ball “5”) is seen as a Center, because he primarily guards (and is guarded by) the opponent’s biggest player.
For the chart below, players have been classified using a combination of Pomeroy’s algorithm and the alignment of players into their natural, historical positions. For one, Pomeroy’s algorithm isn’t 100% accurate (he has Jalen Wilson as KU’s “Center,” likely due to how poor of a rebounder K.J. Adams is). We want to see which styles have been most effective among Big 12 play. Some teams play two true PG’s (i.e. Texas with Carr and Hunter). We want to reflect that here. As far as K.J. Adams is concerned, his position is PF. This means KU starts two PF’s, instead of a PF and C as would be traditionally done.
The Shooting Guards and Small Forwards grade out the worst, indicating that there is some diminishing value in filling a roster with wing-types who mostly shoot jump-shots. If you have shooters, it obviously works. But if you don’t, then what? Oklahoma State (-68.92) and Texas Tech (-33.42) have the worst collection of wings in the conference (number in total cumulative points against bubble at those positions). They also have the two-worst offenses in the league according to KenPom. Of the wings who are solid, the three best in the league are Johnson (K-State), George (Baylor), and Dick (Kansas).
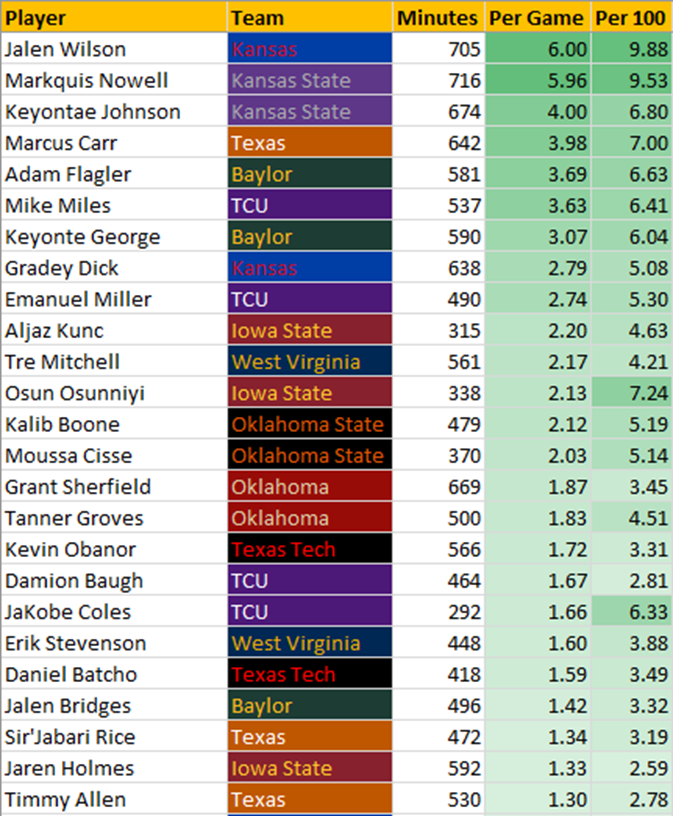
Below are the top 25 players in the Big 12 through: 1/25/2023, linked also here. This ranking covers the entire season of play, not just Big 12 games. This list will be updated on the other link weekly or so, whenever time permits.
The list is sorted on Per Game, which is the Adj. PPG +/- estimate for Big 12 players. Note that for the 9 non-KU Big 12 teams, these are estimates using only box score data. The data for KU players is more complete, as it uses defensive coverage stats (and other non-box-score statistics).
For non-KU players, the actual Adj. PPG +/- number could be higher or lower. This will largely depend on how much better that player is than his team’s average defender, as defensive coverage stats are estimated by divvying out the team’s defensive value among its roster by minutes played. The takeaway is this. For non-KU players, his score is roughly accurate but could vary by as much as 1.00 point per game (or 2.00 points per 100) depending on his defense. If you have good reason to think his defense is much better than average, add some value up to 1.00. Or if he is a less-than-skilled defender, his value may be overstated to some degree.
As far as conference Player of the Year goes, the race is currently between Jalen Wilson and Markquis Nowell. Team success will play into it somewhat, if either Kansas or Kansas State wins the league it might make the difference in who wins this award, but consistency in the area of scoring will be the biggest determinant. Nowell has been a double-figure scorer in 17 of 20 games this season, and two of those were 9-point performances. His low, against Kansas ironically enough, was 4 points.
Jalen Wilson has reached double figure in all of his 20 games, with a season low of 11. Wilson is the better rebounder and has more shot volume, whereas Nowell is the better shooter (TS%) and assist-man. Either would be an acceptable choice at this point.
The other Jayhawk on this list is Gradey Dick, at #8. He checks in as the second-best freshman, only slightly behind Keyonte George. There is a lot of experience on this list. Multiple fourth and fifth-year players are having good seasons. Quite a few of these names were actually born in the 1990’s, making them 23 turning 24 this year. Getting old has been the recipe for success in the post-pandemic era.
Other notable Jayhawks include Dejuan Harris (#26), K.J. Adams (#31), and Kevin McCullar (#32). Right now, KU should have one conference first-teamer and one second-teamer.
If we filter to only include the Big 12 players with at least 100 minutes, which is around 12% of total playing time (each team will have its own number of possible minutes played, but for convenience sake using 100 as a filter works); we get a total set of 97 players. Here are the KU players who qualify, and their conference ranks:
(#1) Jalen Wilson: +9.88
(#14) Gradey Dick: +5.08
(#33) Dejuan Harris: +2.05
(#37) K.J. Adams: +1.74
(#39) Kevin McCullar: +1.52
(#78) Zuby Ejiofor: -3.35
(#88) Joseph Yesufu: -4.61
(#96) M.J. Rice: -6.91
(#97) Bobby Pettiford: -7.95
Compared to the rest of the conference, KU has an elite star, an excellent #2 option, a collection of above-average starters who add a small but positive level of value, and a bench that is among the worst in the league. Actually, other benches are also struggling, even amongst the conference’s good teams. K-State has two elite college players, but after that it goes downhill. Only Texas features a solid, top-to-bottom rotation among its top 8-10 players. The Longhorns are the only school which doesn’t feature a player with a Per100 below -3.00 among its players with at least 100 minutes. In fact, their depth is easily the best in the Big 12. The worst Longhorn is still currently better than -1.00 Per100. Texas’ rotation is deep and experienced.