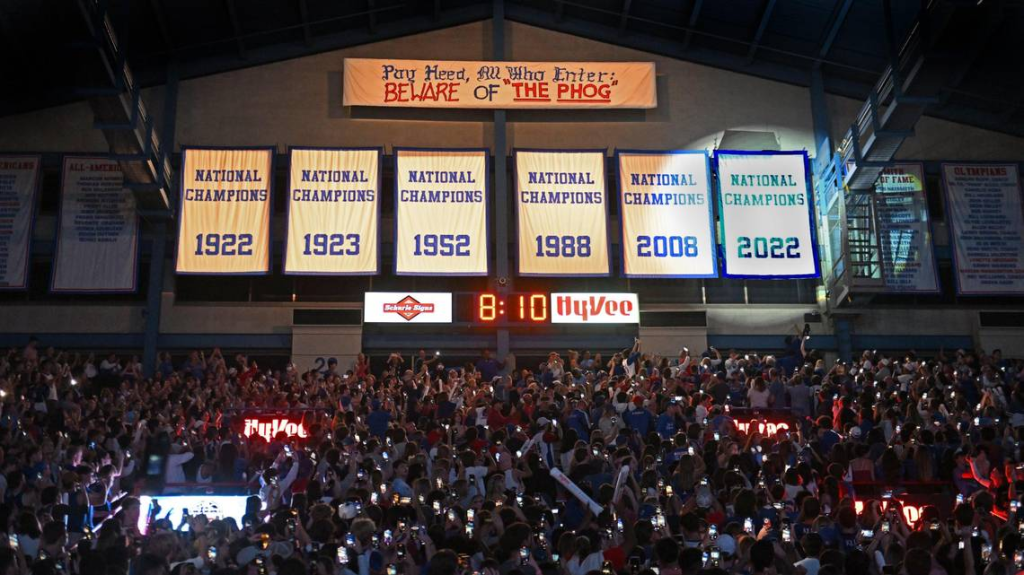
Since the last time we looked at the worth of Allen Fieldhouse, KU has added a National Championship banner. It has also added 15 home wins to just 1 home loss in a difficult Big 12 and non-conference slate. So, it was time to rerun the numbers to see how Allen Fieldhouse has held up.
To refresh, what we’re doing is looking at how good Allen Fieldhouse is at helping Kansas win games per expectation. This is difficult to quantify, but the system that was devised has good reasoning behind it. First, we can look at how good KU has been at home. Since 2010, the beginning season of this exercise, KU is 212-11 in AFH for a 95.1% winning percentage. This is clearly excellent. But how much of this is due to KU being a talented team year in, year out, and how much of this is attributable to the magic of “THE PHOG”?
To isolate the impact of Allen Fieldhouse, we needed to account for KU’s skill. Thankfully, we have a way to do this. Ken Pomeroy’s website (with subscription) provides pregame winning percentage expectations for each D1 game, factoring in the skill levels of both teams and game location (home, away, neutral, etc.). So all we have to do is to compare KU’s wins and losses against cumulative expectation, and what’s left is Allen Fieldhouse. We are effectively comparing the Fieldhouse’s impact against an average home-court.
Since 2010 is the first season where Pomeroy published pregame winning percentage expectation, we begin with this season out of necessity. KU has played 223 games at the Phog in that time, again winning 212 of those games. But what was the expected number of wins (per Pomeroy)? All we have to do is add up each game’s pregame expected winning percentage to get this number. After collecting the data, we arrive at 194.9 expected wins. Simply subtract 212-194.9, and we get 17.1 Wins Above Expectation (abbreviated WAE). In 14 seasons, this works out to over 1 win per year, which can be significant in tight conference races.
This gets us somewhat of an understanding of the excellence of the Fieldhouse, but it still needs further context. After all, just as with anything else there has to be some places which perform better than expectation (just as there are some arenas that perform worse than expectation). In short, is 17.1 WAE a statistically significant difference?
To test this, we constructed a simulation which would run each game 10,000 times (using KenPom’s pregame odds) to see the frequency of results as a total win/loss record. For instance, if KU goes 212-11 in 20% of simulations, this means that it isn’t that unlikely and Allen Fieldhouse’s accolades are overstated.
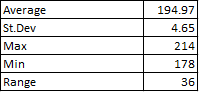
So, running the results this time, we got these totals (in wins out of 223 games):
The average number of wins in the simulation is very close to the true expected number of wins, helping confirm that 10,000 sims was a large enough size. The standard deviation is listed next. The next number is the highest number of total wins in any specific sim, with the number below that the lowest number of total wins in any sim. Last, the range shows the broad difference between high and low win totals.
The Max number of 214 shows that we have at least one result of at least 212 wins, just through “luck.” This tells us that, given enough chances, KU’s run over the past 14 seasons could be replicated at a different home arena. This is noteworthy, but we still need to calculate a few more numbers before we fully discount the aura of “THE PHOG.”
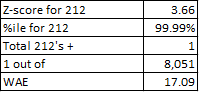
Taking 212 wins (given pregame winning expectations), a z-score of this event occurring is 3.66. Converting this to percentile terms, this high level of a z-score is in the 99.99%. We see next that there was 1 total result of 212+ wins in the 10,000 simulations, and we would expect this result (212 + wins) to occur in 1 out of 8,051 random sims. Last we see the WAE number of 17.09.
In layman’s terms, Allen Fieldhouse has won games for KU. We can factor out KU’s elite talent, as that is already calculated in pregame winning percentage expectations. We can factor out general home-court advantage, as KenPom’s system accounts for where games are played. What is left is the pure aura of Allen Fieldhouse. How KU wins this many games is up for debate. But there is something special about the Phog, and it is something that persists over time.
In the Bill Self era, KU famously has as many home losses as conference championships. No team has won more than twice against Self at home, and many fans can recall each loss Self has had in the Fieldhouse from memory.
Just how good is Kansas at home? Since the 2010 season, the Hawks have complied a 197-10 record at Allen Fieldhouse. This is obviously amazing when compared to other programs, but how much of this record is due to the talent and coaching on Kansas, not the building? After all, Kansas is 77-36 (.681) in conference road games since the 2010 season. So perhaps the mystique of Allen Fieldhouse is merely just Kansas’s sustained talent alongside a home court advantage common across college basketball. If you shipped the talent Kansas has had over the years to Bloomington or Storrs or Baton Rouge, would you see similar home court records at Indiana, Connecticut, or LSU? Or if Allen Fieldhouse really is special in its ability to deliver wins, how can this be quantified?
The answer comes from predictive analytics. We’ll use Ken Pomeroy’s predictions, since they are the most famous in college basketball and tend to be the most accurate.
Pomeroy’s website contains a treasure trove of statistical information, but more than this, his system also attempts to most closely predict the final margins and winners of college basketball games. His background in meteorology has helped him forecast college basketball results with accuracy. The point is that his predictions can be used as a serious, accurate, objective standard.
One feature Pomeroy includes is home-court advantage. On his website, he notes that his is calculated by taking the last 60 home and road conference games, and finding the difference. KU’s home-court advantage is well-above average, but not close to the top (37h) at 3.8 points per game. If we were to conclude from this rating alone, we’d have to place Allen Fieldhouse not even in the top half of the Big 12, as Kansas St., Oklahoma, TCU, Iowa St., Texas Tech, and West Virginia all have better home-court advantage scores.
But I don’t see this stat as being indicative of home court advantage alone. In fact, it is just as likely to be a measure of poor road performance. The poorer a team does on the road, the better its home performances look by comparison. As mentioned above, KU has won over 2/3 of its conference road games since 2010. We don’t want to unjustly count KU’s road performances against it when assessing Allen Fieldhouse as a home court advantage.
Not Points, But Wins
Point differential and wins are two separate things. The two are interrelated, but the statement we intuitively know is true and want to show mathematically is not that Allen Fieldhouse produces large point differentials for KU (although it does do that often), but instead that it produces wins for KU.
Up to this point, we’ve established that Pomeroy makes accurate and objective predictions. Pomeroy’s system is a computer algorithm; it’s based on trends and correlations from large data sets. There are no biases; the computer doesn’t care which team name is which to next point total number. Pomeroy is using game data from all 350+ teams to make his predictions, making the model applicable across all of D-1 basketball. He also tests his predictions to ensure accuracy.
For instance, let’s say KenPom has a game where Team A is favored to win over Team B and is given an 80% chance of winning. Team A is expected to win, but if Team B won it would be a mild upset since this result would be expected to occur 1/5 of the time. Over the course of a season, or multiple seasons, we can test all games which featured one team with an estimated winning percentage around 80%. If the actual results of this collection of games turn out to be wins for the favorites about 80% of the time, then we know the prediction system is fairly well-tuned. If the results are off by some factor (perhaps these favorites won 70% or 90%), tweaks need to be made somewhere. This ability to fine-tune the model leads it to be more accurate, which makes it trustworthy. And this is in fact what Pomeroy does.
This is just the system we need to test Allen Fieldhouse. Note that in Pomeroy’s system, KU’s inherent skill level is accounted for. His predictions consider the talent of the players and level of coaching. Also, whatever amount of point value inherent to Allen Fieldhouse is also factored in. What we should be left with is a purely unbiased and accurate gauge of how much Allen Fieldhouse helps KU in terms of wins.
To test this, we will take each Kansas home game and the predicted win percentage at the time, and then compare to the results of what actually happened. Pomeroy’s site began offering probability predictions for the 2010 season, so we will begin here and go through 2022. For instance, KU’s first home game of the 2010 season was against Hofstra, in which the Jayhawks had a 98.7% chance of winning. KU did end up winning, so, it earned 1 – 0.987 = +0.013 Wins above Expectation (WAE).
As we continue this exercise for each game played over that period, we should expect the WAE to be around 0.000. Remember that the skill level of Kansas and home court advantage has already been built into the predictions. Remember also that Pomeroy tests his estimated win percentages, so we should be getting accurate prediction ratings for a team with the skill level of Kansas and a generic home court advantage. Anything substantially more or less than 0.000 needs explanation.
For KU, they have a WAE at Allen Fieldhouse since 2010 of, drum roll, +15.50. With a population of 13 seasons this is at a rate of over 1 more expected win per season. It’s difficult to stress how ridiculous this level of winning is. Instead of being 197-10, a team as good as KU has been against the same quality of opponents KU faced on the parameters of a normal home court would have an expected home record of 181-26. This is the difference between a 95.2% winning percentage and 87.7%, not a slight difference. Using Odds Ratio, Allen Fieldhouse has produced 2.77 times better results than expected.
Looking at each year individually, we see that only in 2018 (14-3 record) did KU have a negative WAE. Every other season was above expectation. 2018 was also the only season that KU lost more than 1 home game over this span.
We can also test how likely it is for KU to have an undefeated home record given its opponents. Since 2010, KU has had undefeated home seasons in the following: 2010, 2012, 2015, 2016, 2019. 5 seasons out of 12 isn’t bad; but how many would we expect KU to have?
Using similar methods, we can calculate the independent probabilities of an undefeated season for each season, and then add the results to see how many we would expect. For instance, for 2010 we’d predict that Kansas has a 38.5% chance of going undefeated. Since it did go undefeated at home that season, the 2010 team earned 1 – 0.385 = +0.615 Undefeated Seasons above Expectation (USAE). After calculating all years 2010-2022, we come up with an expected 1.749 undefeated seasons, or a +3.251 USAE. Note that even 2 undefeated home seasons would be above expectation, since over the course of 15, 16, or 17 games the math says that you should trip up at least once. But KU has managed to avoid defeat at home in five of these seasons.
Testing the Results
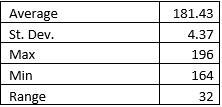
The first way to test these results is to run a simulation to see how frequently KU finishes with a WAE of +15.50. A quick simulator on Excel was built, and 10,000 sims were run. Here are the results, in terms of wins (out of 207 games played):
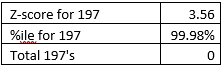
As you can see, assuming a random distribution of performances in terms of win/loss, the maximum number of wins KU achieved was 196 under 10,000 simulations. This is actually fewer than the total of home games KU actually won in this span. Looking at the 197-win mark, we can calculate how statistically rare such a feat is:
The z-score counts standard deviations, so 197 wins is 3.56 standard deviations above average. This works out to a 99.98 percentile. Out of 10,000 simulations, not once did KU reach the 197 wins at home. Given the distribution, we’d expect them to reach this win total once out of 5,453 simulations, which is a bit more common than 0 out of 10,000 but still a rare instance. KU’s success at Allen Fieldhouse has been off-the-charts.
Further Study
If anything, these numbers are undersold. Remember KU went undefeated in 2009 and 2008. If we stretched it back to the 2004 season, the first year of the Self-era, Kansas would be at 255 wins to 16 defeats, a slightly lower winning percentage but an overall larger population of games. The z-score might move even further right.
(Although we don’t have KenPom pregame win probabilities for these seasons, they can be reasonably estimated given opponent quality. It would take more work, and they wouldn’t be as precise as what a predictive model would have estimated. We will keep the (real) results for now, with the option of adding seasons 2004-2009 as an amendment so that the entire Self-era is captured).
A Free Lunch, Taking KU at Allen Fieldhouse on the Money Line
Outperforming an accurate and fine-tuned prediction model is noteworthy enough, but certainly Vegas would be tough to beat. After all, after years and years of KU winning such a high percentage of its home games, shouldn’t the betting market reflect the magic of the Phog?
It turns out the answer has been no. We won’t bury the lead on this section. You were guaranteed to win money if you bet a consistent amount money on KU to win each of its home games over any part of the past 15 seasons. Read that again. You could have started this strategy the first game of the 2008 season, or even for the Kentucky game this season that KU ended up losing. Bet a consistent amount on the Money line for KU to win outright and you will end up in the black.
KU has been 234-10 in AFH since the 2008 season (so games beginning in November 2007). Let’s set a consistent betting amount of $10. So, regardless of opponent or history, the strategy is to bet $10 on Kansas to WIN straight up on a Money Line bet.
Not all KU home games have had a Money Line, at least according to the archives. The first game in this span I could find that had a Money Line was KU’s November 2007 game against Northern Arizona, at -10000. Betting $10 would have netted you $0.10 for the KU win that game. Fast-forwarding to today, if you had kept at this strategy, you’d have $183.07, an increase 18x your initial investment.
To compare the increase of the S&P 500 over that period, if you started with $10 and let it sit in the market, you’d have about $30 today. Betting on KU to win at Allen Fieldhouse has proven to be a better long-term investment than the stock market. Anyone with a background in finance or betting markets knows how absurd this is.
Another way to look at this is to see how much the market would have to move on these games to make it efficient. In order for a better to have exactly $10 after betting $10 on each of these games, the Money Lines would have to collectively move 2.87 times what they were (so if KU was -10000, it’d have to be -28000; if KU was -275 it’d have to be -789, etc.).
Other Questions for Future Analysis
Switching gears some, it would be good to see how well other home courts do at converting wins. Clearly some teams will see better win/loss results than expected at home than other teams, this is the nature of statistics. But how well do other bluebloods, such as Kentucky and Duke perform? What about teams like Purdue; exactly how many wins has Mackey Arena been worth? Or is Hilton Magic real? Remember, since a team’s skill has already been factored into the pregame predictions, we should get apples to apples comparison regarding home arenas only, since team skill differential has been accounted for. The problem is that this data must be scraped, so it makes it time-consuming to try and build up any dataset. Maybe it would be prudent to start with a few big schools (Duke) and go from there? But there’s no way to avoid missing whatever home court has been the biggest advantage in terms of win/loss without running through every team, since that’s the very thing we’re looking for!
Conclusion
Allen Fieldhouse was worth over 15 wins over the course of the 2010-2022 seasons, propelling KU to an absurd 197-10 during this time. The chances this would occur by pure luck alone are at best 1/5000, indicating that something has happened in that building (crowd support for KU players lifting them up, opponents feeling pressure, refs being affected by the crowd, etc.) to get the team wins it otherwise wouldn’t have gotten. Whatever the reason, you can conclude this. Until proven otherwise, Allen Fieldhouse is the biggest homecourt advantage in college basketball and probably in all of sports. A 3.56 Z-score and 99.98 percentile is very unlikely to have been matched by any other arena during the past 13 seasons.