Harris vs. Martin

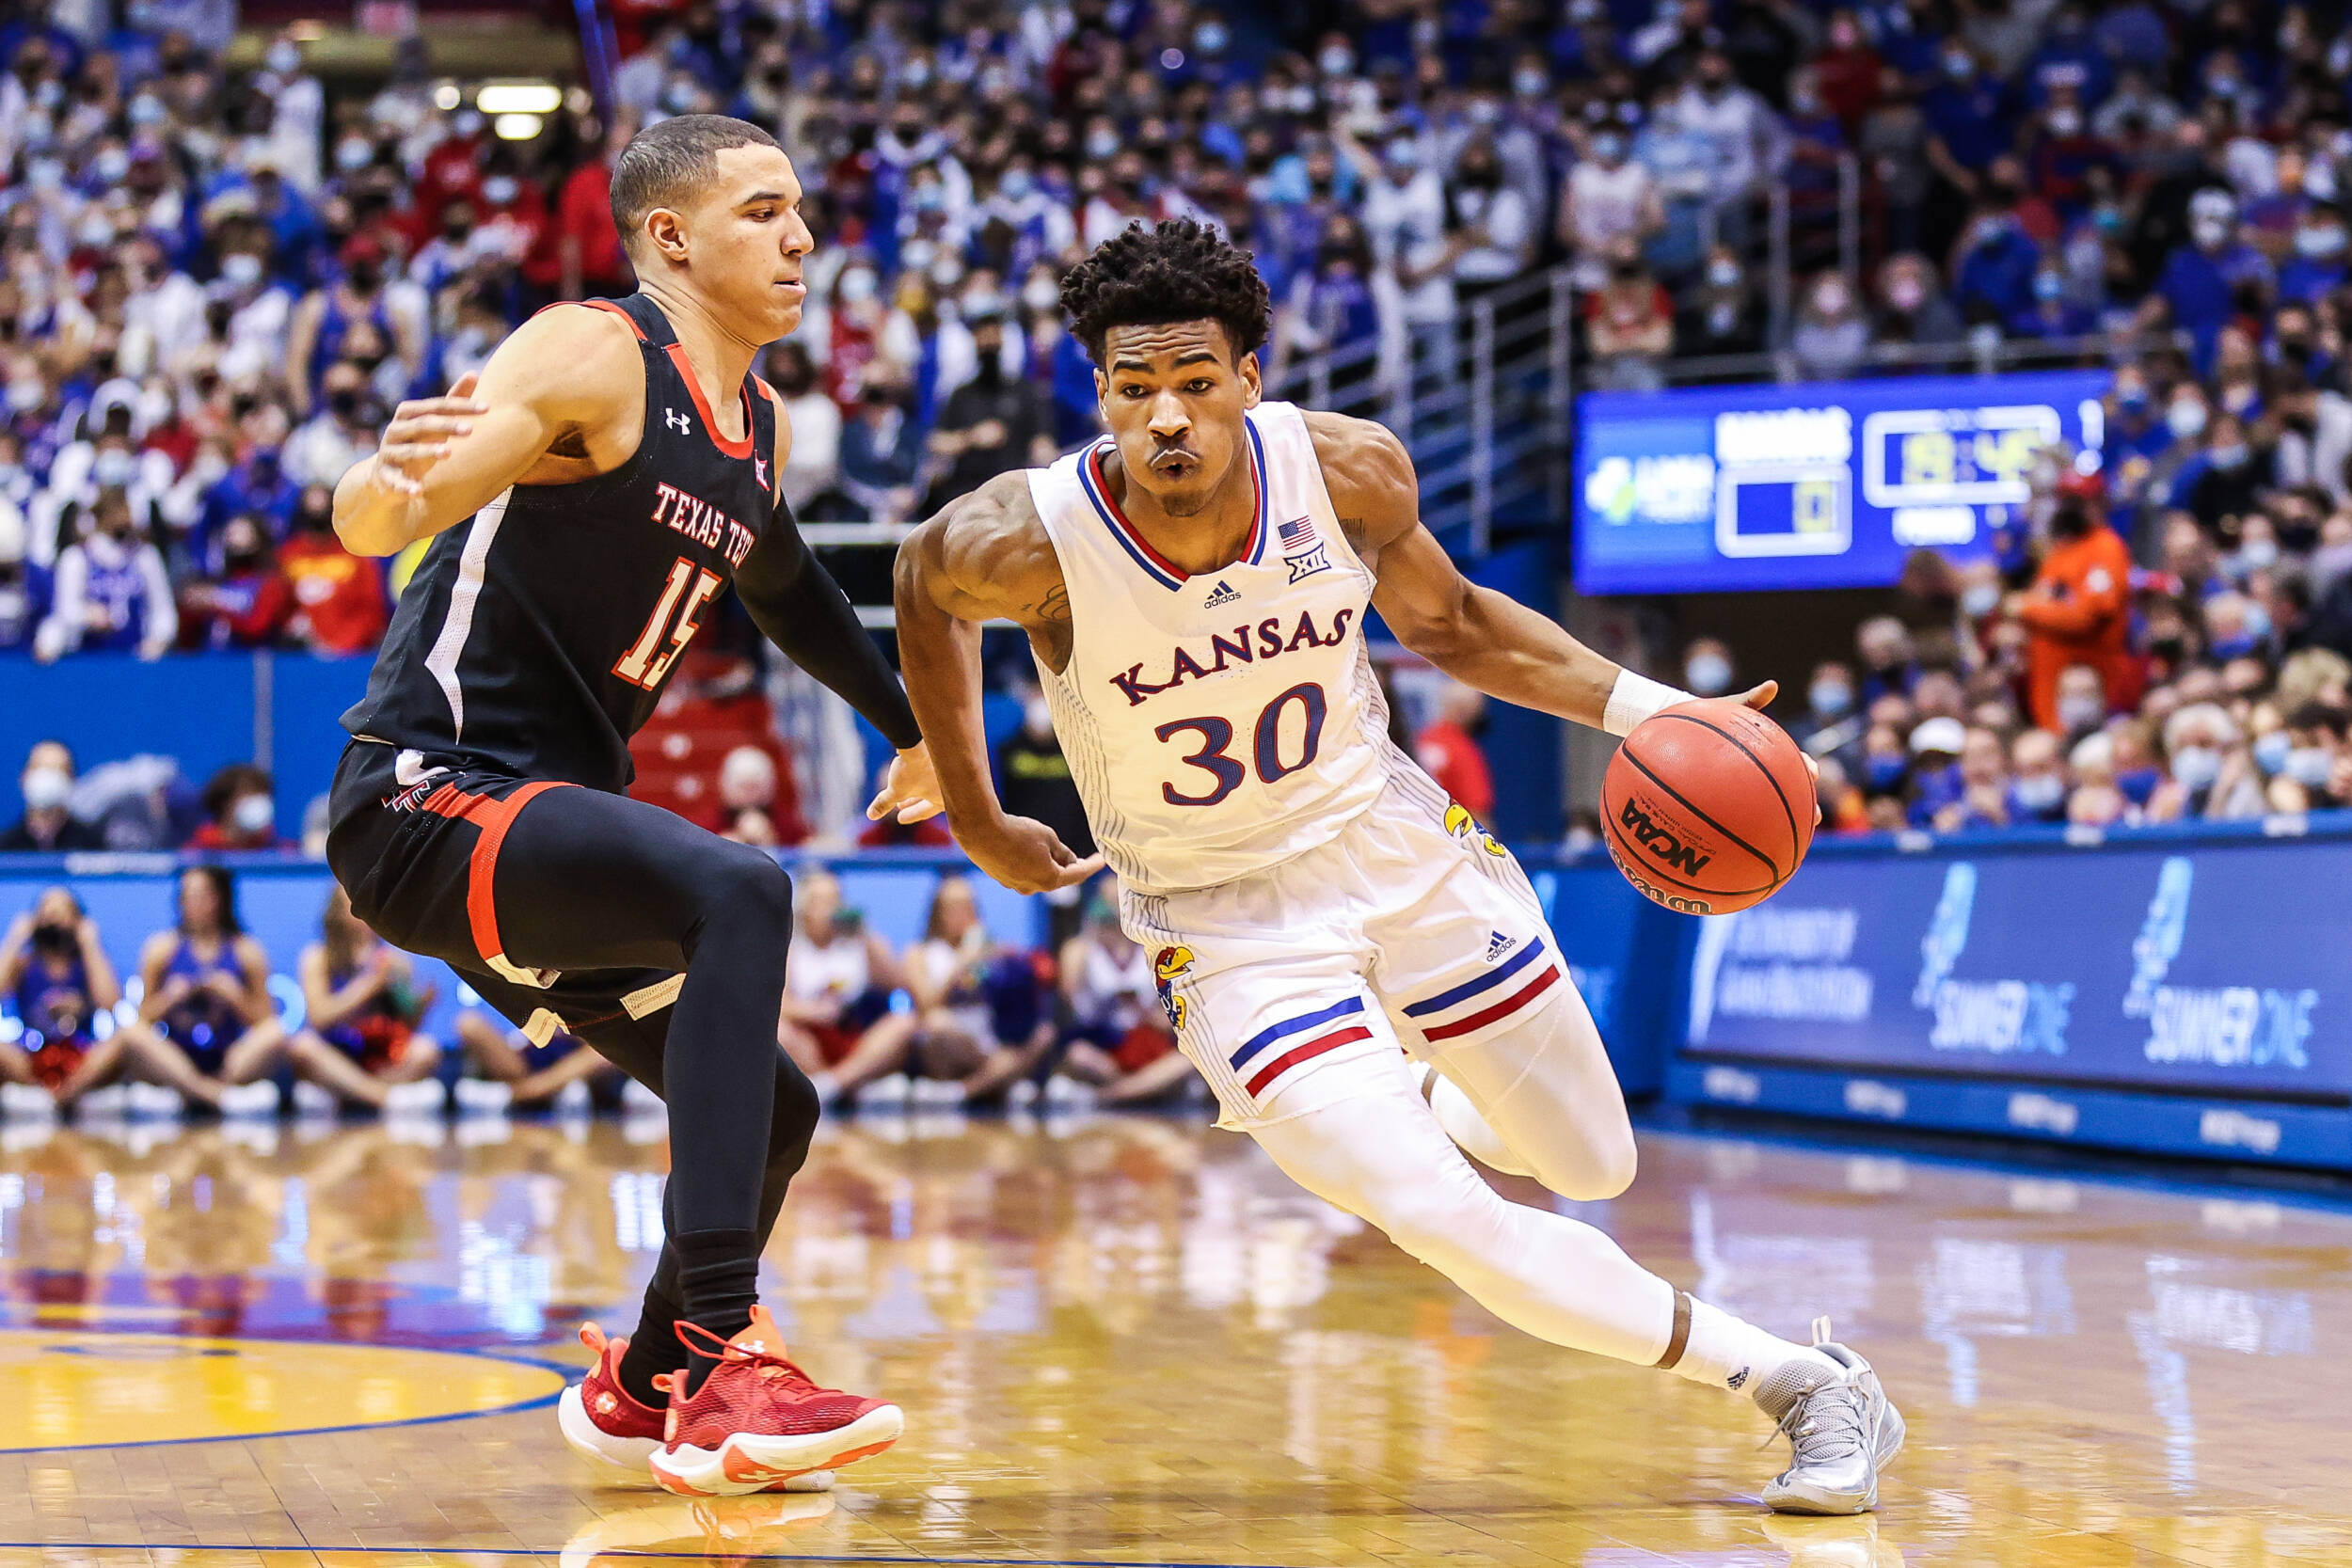
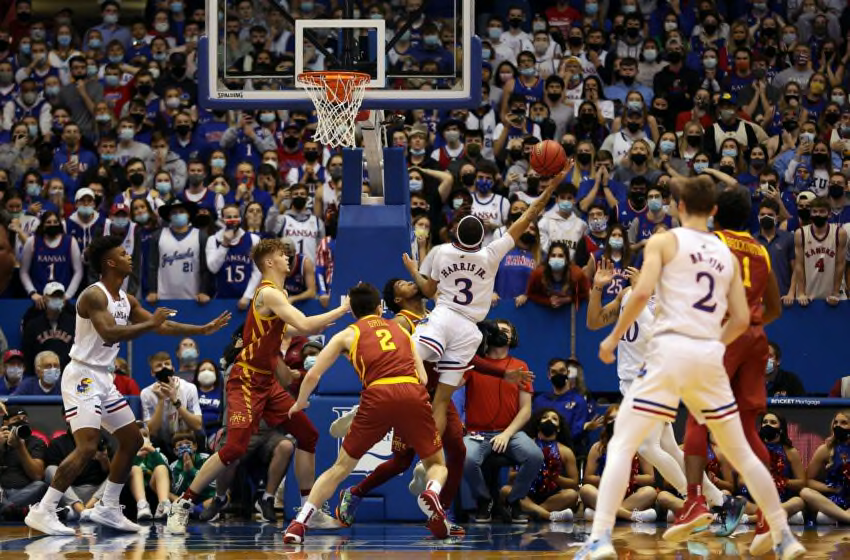
With 5:04 left in regulation, Remy Martin checked out for the final time against Texas Tech on Monday. Although we didn’t know it at the time, the game would last 15:04 due to 2 overtimes being needed, and it would be Dejuan Harris and not Remy Martin getting the PG duties. When Martin left the game, KU was up 8. The Hawks would be outscored by 5 the rest of the way, first giving up an 8-point lead in regulation and then needing a second overtime to avoid losing the game.

Martin’s playing time, or lack thereof, down the stretch certainly had Jayhawk fans scratching their heads. Coach Self was even asked about this during his press conference. He responded that he didn’t know who to take out if he put Remy in, even insinuating that he didn’t consider removing Harris by noting he couldn’t play two small guards together due to defensive mismatches.

Those wanting to see Martin finish the game pointed out +/- differentials to justify their arguments. Martin was +9 and Harris -8 on Monday night. But even those using +/- acknowledged its limitations and uselessness over a small sample size of 1 game. *

*Really the sample size isn’t 1 game, but the 85 possessions the game featured, or perhaps the 50 or 60 possessions that Martin or Harris actually played. Nevertheless, we would want to see more possessions (closer to 1,000) against similar competition than what we saw on Monday.

The eye-test certainly bolsters the argument for Remy. He was quick, aggressive, and made countless plays despite only scoring 4 points (the same total as Harris). The team seemed to have more offensive flow with Martin running the show. On the other hand, the eye-test runs into the same problem as +/-. Yes, Remy played better on Monday night. But what about the whole season? Just a few days prior, Martin had a rough game against Kansas St. Given his recent health issues and bouts of inconsistent play, how long do you want to gamble with someone who has overperformed in this one game?

The point of all this, is to ask the question on everyone’s mind…who should play more as the team’s point guard, Dejuan Harris or Remy Martin? To answer this, we will use the stats found on this website to compare how each has played over the first 19 games.

To start, we will fragment each’s games into offensive numbers and defensive numbers. From there, we will combine these into value scores and see which has played better so far throughout the course of the season. Last, we will look beyond the value scores (which are just season averages) and attempt to see who has been more consistent, who has produced more good games, fewer bad games, and so on.
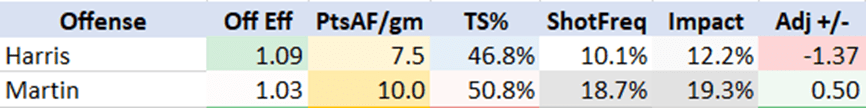
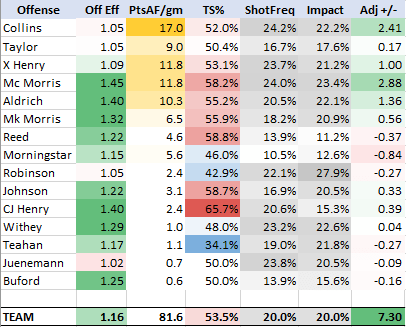
Offensive Stats:

The first offensive stat we will compare is actually PPG. Although this is not an “advanced” stat, it actually correlates quite strongly with overall player value. Players who lead the team in points per game are likely the team’s best natural offensive talent. They are likely to be better shooters than average (from a TS% perspective). They are likely to be better athletes than average and thus are probably better rebounders or passers or defenders than others their position. And they are also good enough to play enough minutes to have the chance at leading the team in PPG.

Through 19 games, Remy Martin is averaging 8.4 points and Dejuan Harris is averaging 5.2. This is a noticeable difference. When we even out the minutes (Harris is playing 4.5 more MPG), this gap is even wider. Martin is averaging 14.0 points per 40, and Harris is nearly half as proficient of a scorer at 7.2.

Next, we will look at shooting efficiency. Effective FG% is a good way to do this, but TS% is even better. Getting to the FT line, and converting, is a skill that needs to be accounted for. Using the formula for calculating TS% developed by CtH, we arrive with Martin at 50.8% and Harris at 46.8% (Sports Reference has Martin at 55.1% and Harris at 50.5%, so the relative difference isn’t affected much by source).

Putting these two stats together, we see that Remy is scoring more than Harris is on a rated basis and is doing so by shooting better. The last comparison we want to make for two guards is assist and turnover numbers. Once again, per 40 numbers from Sports Reference are helpful. Both players are averaging 5.1 assists per 40, whereas Martin turns it over more than Harris (3.0 vs. 2.0 per 40 minutes). CtH’s numbers are similar, but we give the slight ball-handling advantage to Harris.

Offensive rebounds are negligible for small guards. The main components on offense are scoring, shooting, assists, and turnovers. Martin is comfortably the better of the two when it comes to scoring and shooting, whereas Harris is slightly better on the ball-handling stats.

Putting it all together, Martin is producing +0.50 points per game of value more than a KU-level replacement guard would. He hasn’t been great on offense, but he has been serviceable. On the other hand, Harris is well-below where KU fans would expect from a starting or even backup PG. His only value-adding offensive aspect is his low turnover numbers, although this is a product of conservative play which creates little offense.
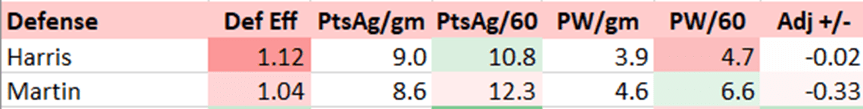
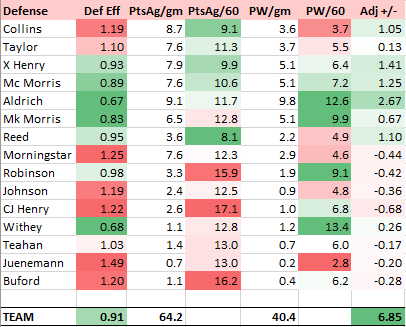
Martin’s shot frequency is in a normal range, Harris barely shoots.

Defensive stats:

Just as points scored is a strong indicator of player value, the strongest defensive indicator is how many points a player gives up on defense. However, this stat isn’t kept at the official level. It is kept by CtH, so we are in luck. Instead of a per game basis, we will compare Harris and Martin on a per possession basis. This is multiplied up to 60 possessions, so the numbers are per 60.

Harris is allowing 10.8 points per 60; Martin is giving up 12.3 points per 60. Harris has been the more consistent defender and grades slightly above replacement, whereas Martin is slightly below replacement. The next thing to check is possession winners, which are defensive rebounds, steals, and forced turnovers. When we rate per 60 possessions, we see that Martin is better at winning possessions off a defensive stop than Harris (6.6 vs. 4.7). There isn’t much more to say on defense. Once we put everything on this end together, we see that Harris (-0.02) grades out slightly better than Martin (-0.33). Neither are that impressive.
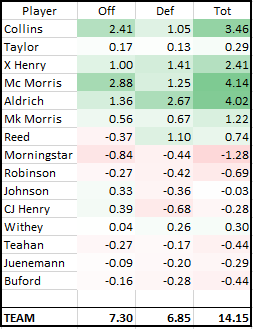
Martin’s defense took a step forward after a solid outing Monday night.

Total Value:

Next comes simple arithmetic. Adj. PPG +/- is just the sum of the Off and Def components.

Adj. PPG +/- scores

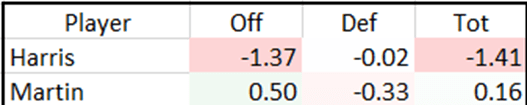
Martin is over 1.5 points per game better than Harris. This isn’t an insignificant difference by any means. Harris’s poor offensive output really stands out here. KU-level players should be able to reach a higher level of production.

Consistency:

The last thing to consider is the level of consistency each displays. What are each’s highs and lows? To answer this, we will take each’s best three games and worst three games using value score, adjusted to opponent.

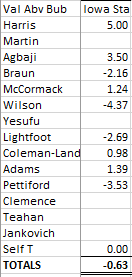
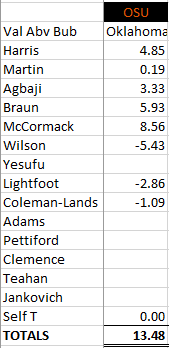
Harris’s 3 best games: +6.77 (Missouri) +4.98 (Iowa State) +4.97 (Oklahoma State)

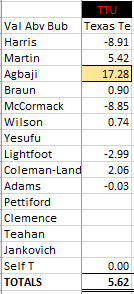
Martin’s 3 best games: +6.52 (North Texas) +5.90 (St. John’s) +5.42 (Texas Tech 2)

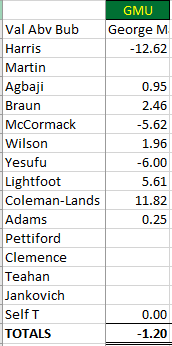
Harris’s 3 worst games: -12.64 (George Mason) -8.91 (Texas Tech 2) -4.69 (UTEP)

Martin’s 3 worst games: -10.12 (Kansas State) -7.93 (Stony Brook) -3.38 (Texas Tech 1)

Harris has both the best and worst overall game between the two. He also has the worst second and third lowest scores, whereas Martin has the second and third best scores in comparison. It should be noted that Harris has played 19 games, but Martin has only played 16. This is partially the reason Harris has lower-scored games. Of course, playing in fewer games works against Martin on the plus side. But generally Martin’s highs and higher and lows lower than Harris.

Team MVP’s is another way to compare. Harris’s +4.98 score against Iowa State (including the game winner) was the best of any Jayhawk that night. Martin has yet to register a team MVP this year. Each player has had one game where he was more valuable than the team’s margin of victory; Harris +4.98 in that 1-point win over Iowa State and Martin +5.42 in that 3 point Texas Tech win. On the other side, Harris scored -4.36 against Dayton (in a 1-point loss) and Martin has not had a score lower than the margin of defeat in any of KU’s losses so far this season.

We can also look at the number of positive games vs. negative games using value score. Harris has had 6 positive games and 13 negative games, meaning 32% of the games he plays in add value to KU. Martin is 8 positive and 8 negative, which is 50%. Just as with average value score, Martin has been the better player over the course of the season when we use this measure of consistency.

Conclusion:

In summary, Martin is the better offensive player as he is a better scorer and shooter even at higher volumes than Harris. Harris takes care of the ball better and grades slightly higher at assisting, but these are too small to make up for the scoring/shooting value difference.

On defense, Harris is better at not giving up points, whereas Martin’s rebounding is superior (Harris gets more steals/forces more turnovers). These factors mean Harris has more defensive value.

In total, Martin has been worse than advertised yet still a consistently better player than Harris. I don’t recommend changing the starting lineup, but the closing lineup, that is the one down the stretch in a close important game should include Martin as the PG and leave Harris on the bench.

Kansas 94 Texas Tech 91

Ochai Agbaji’s career high of 37 points was matched by solid defense.

Game Summary:

For the second consecutive game, Ochai Agbaji had the best game of his career. Finishing with 37 points, Ochai only gave up 9 points on defense, a stout number in 46+ minutes of play. Agbaji also grabbed 7 defensive boards, including a few clutch ones in double-OT. Remy Martin had the second best game of any Jayhawk. Despite scoring only 4 points, Martin only gave up 2 points, and produced additional value with 6 assists and 3 forced-turnovers. His energy really sparked the Jayhawks, and hopefully there is more to come.

Coleman-Lands didn’t play a ton, but he was solid in his nearly 5 minutes of play. He made a jump shot while not giving up points on defense. Christian Braun and Jalen Wilson, in 48+ and 47+ minutes each, had slightly positive contributions overall. Both had nice plays toward the end of the second OT, sealing the win for the Hawks.

K.J. Adams has the most misleading score, as he was guarding Tech’s Bryson Williams for most of the time he played. Adams gave up 9 points (3 off a banked in jump shot), but scored 6 of his own to go with 6 rebounds and 0 misses/turnovers. Unlucky defense will even itself out over the course of a 35 game schedule, and Adams showed he is capable of playing at this level moving forward.

Mitch Lightfoot was in foul trouble for much of the night, and ended up giving 9 points while only scoring 4. He’s had better outings for sure. David McCormack had his second-worst performance of the season, partially due to Bryson Williams playing outstanding. Still, whenever Tech needed a pop-out 3 they did so going against McCormack. Big Dave also failed to collect important defensive rebounds in crucial times.

Last, Dejuan Harris had a poor outing on both ends. He has produced 4 consecutive negative games since hitting the game-winning shot vs. Iowa St., his worst performance being against Texas Tech.

The team’s score of +5.62 was about 4 points below expectation, as you’d want KU to win a bit more comfortably than they did. KU built up a 12 point lead with about 6 minutes to play, and it was still 8 before Tech won a few offensive rebounds off missed free throws and converted to cut the lead to 4. Personnel questions were also abundant; KU seemed to struggle once Martin came out for good with 5:04 left in regulation. The final 15:04 were played by Harris as the sole ball-handling guard, and KU was -5 in that stretch.

Kansas 67 Oklahoma 64

Game Summary:

Jalen Wilson and Christian Braun led the Jayhawks to their fourth conference win with efficient offense and solid defense. Kansas also got positive contributions from Mitch Lightfoot and David McCormack, and Ochai Agbaji came back from a poor first half and wrist injury to make big plays down the stretch. KU’s small guards each had poor showings. Remy Martin did not play well in his return, and Dejuan Harris was outplayed by Oklahoma’s guards for most of the night. Yesufu gave up a bucket in his 2 minutes of game action. K.J. Adams posted a negative value game for the first time since Missouri.

The team’s score of +8.33 is slightly below their season-average (12th best of 17 games so far), yet was still good enough to get a win.

Kansas forward Jalen Wilson, right, celebrates with teammate Christian Braun (2) in the second...
Jalen Wilson earned his second team-MVP honors with his 16-point performance in Norman.

Kansas 85 West Virginia 59

Kansas Jayhawks basketball beats West Virginia: recap, score | The Wichita  Eagle
Ochai Agbaji earned his 6th team-MVP of the season, scoring 20 points as well as playing great defense.

Game Summary:

Ochai Agbaji was the overlooked player in KU’s 85-59 win, as 20+ point games are quite common for him now. However, it was Och’s defense which made him so valuable, only allowing 2 points the entire game. Och’s value score against the Mountaineers is the highest game performance of any Jayhawk this season. Of course, the performances of David McCormack (19 points, 15 rebounds) and Jalen Wilson (23 points, 8 rebounds) were a welcome sight to KU fans. The two best returning offensive players from last season finally got going, showing how high the team’s ceiling can be if everyone is playing well. Wilson’s performance was tempered somewhat by poor defense, but for the season he has shown enough improvement on that end to make one think that the last game was a one-off performance. Other positive performers included K.J. Adams, Jalen Coleman-Lands and Chris Teahan.

On the other side of the value-ledger, Christian Braun struggled to finish at the rim in the first half and had his second consecutive negative-value performance after starting the season with fourteen positive games. Another notable would be the play of Joseph Yesufu, who got more minutes Saturday than he typically sees. While his value score wasn’t pretty, he did make some athletic plays, making one think that he is due for a breakout game and some positive-value performances in the future.

With a team score of +22.54, KU broke a slump of poor games with its second-best opponent-adjusted performance of the year (Missouri).

Kansas 62 Iowa State 61

No. 9 Jayhawks Win on a Last-Second Shot against No. 15 Iowa State
Dejuan Harris earned his first career team MVP against Iowa State

Game Summary:

Not only did he hit the game-winner with 7 seconds left; Dejuan Harris was solid on both ends to earn team MVP honors. Ochai Agbaji was poised to win this distinction due to a solid 22-point outing, but his defense down the stretch lowered his value score significantly. K.J. Adams got the start and had yet another positive outing (10 of his 13 game appearances have netted positive value). Despite being benched for most of the game and only scoring 1 point, David McCormack was good on the defensive end and glass. Christian Braun had his first negative-value performance of the season, and Bobby Pettiford returned from injury but looked very rusty.

The team is missing Remy Martin, and frankly David McCormack although the latter is on the coach and not due to injury. Playing worse players at these positions (such as Pettiford/Yesufu or Lightfoot) has unsurprisingly made this team worse. The team is loaded at wing, so giving K.J. Adams a look at the 5 can provide a small bit of value most nights.

Kansas 76 George Mason 67

Kansas defeats George Mason 76-67
Jalen Coleman-Lands lit it up for 20 points on 5-7 3-point shooting. He earned team MVP honors.

In terms of value produced, here are summaries for each player:

Jalen Coleman-Lands +11.82. Not only did he have an incredible shooting game, JCL also played solid defense, only giving up 7 points while grabbing a few rebounds. His first team MVP as a Jayhawk was also the fourth-best individual performance of any KU player this season.

Mitch Lightfoot +5.61. It was a good game for veteran players, as KU’s second-best performer was the 6th year senior. Both efficient on offense and stingy on defense, Lightfoot’s score was only hampered by his poor defensive rebounding effort.

Christian Braun +2.46. CB overtook Agbaji as Kansas’ best overall player in this game, although the two are statistically even at this point. He didn’t have a great game, but still played well by knocking down late free throws.

Jalen Wilson +1.96. J-Wil rebounded very well to make up for a poor shooting game. He also defended well, in fact all of KU’s wings have played good defense this season.

Ochai Agbaji +0.95. Agbaji didn’t have a great game offensively, but still defended well and made a nice and-1 on a drive to finish with 11 points. He is a “quiet” defender, in that he doesn’t block shots, grab a ton of rebounds, get many steals, or force many opponent turnovers.

David McCormack -5.62. Bad Dave was back, starting the New Year with only 1 point and a poor value score. He grabbed five offensive rebounds, but never finished any of his put-backs. His defense on the perimeter and interior was worse than Lightfoot’s, which is why Coach Self went with the backup during most of the second half.

Joseph Yesufu – 6.00. With Remy Martin out due to injury, this was a great opportunity for Yesufu to have a break-through game. Unfortunately, it was more of the same. Yesufu’s main issue is on defense, where he gives up both outside shots and drives despite his quickness.

DeJuan Harris -12.62. As good as JCL’s game was, Harris’ outing was bad enough to wipe away enough value from what his teammate added. Harris had a typical offensive game for him, only scoring 4 points, but it was on defense where he struggled, allowing 19 points and multiple 3-pointers. It was a disappointing step-back after his solid performance against Nevada.

TEAM -1.20. KU was 1.20 points worse than a hypothetical bubble-team, who would have been expected to beat George Mason at home by about 10.20 points (for this season, think Creighton as a bubble-team). Looking at the performances, KU got more-than-enough from its super seniors Coleman-Lands and Lightfoot. But it was the three players who had terrible games that held them back. With conference play beginning Tuesday, these types of performances will result in losses.

Kansas 80 Stephen F. Austin 72

Christian Braun had his 4th MVP game of the season

Although it was closer than expected, KU’s talent shown through at crunch time, and the Jayhawks held on to win, 80-72 over Stephen F. Austin. With Kansas being about a 22 point favorite from the computers (Vegas had it at 23.5), the 8 point win meant this was KU’s second-worse performance of the season. Below are the value scores:

Christian Braun has now produced positive value in all ten games this season. He was the most valuable Jayhawk against SFA with a value above bubble of +6.76 points. As in most games, he filled the stat sheet. Along with being the leading point producer, he won 9 defensive possessions Saturday night, the most on the team.

Ochai Agbaji did not have his best game finishing scoring chances (two missed dunks), but played solid defense in 39 minutes, only giving up 7 points defensively. He produced +3.12 points above bubble, showing that his improvement in the off-season has brought up his “floor” immensely.

Jalen Wilson had a nice night off the bench in about 20 minutes. His one 3-point attempt didn’t fall (making him 1-15 on the season), but he made some shots in the midrange. His defense has remained steady in 7 games this year, and it helped provide value for his team last night.

Zach Clemence didn’t play much but scored on a put back attempt following an offensive rebound. His defense wasn’t great in the few minutes he played, but still managed to produce an overall positive value game.

Remy Martin was clutch, making a late 3-point basket to give Kansas a more comfortable 6 point lead during the final minute of play. However, he gave up a quick lay-up soon after. He struggled to get going and had some defensive lapses, leading to a slightly negative game.

Jalen Coleman-Lands made a couple free-throws in a few first-half minutes (he didn’t play in the second half), but also played poor defense.

Joseph Yesufu gave up two buckets in his few minutes of play, once on a mismatch inside and once giving up a drive to a guard.

Mitch Lightfoot played the bulk of the minutes inside, giving up some scoring to SFA’s skilled big Gavin Kinsmil. However, he hit the offensive glass to the tune of 4 boards.

Dejuan Harris only took one field goal attempt, a missed dunk. He did put in four FT’s to ice the game away. While he struggles to produce points aside from assisting, his defense last night was as good as it could have been.

David McCormack had a very poor game, finishing with only 2 points and battling foul trouble all evening. Still, you need more than 10 minutes out of him.

TEAM was at -3.70, meaning a similar type performance against a bubble team on a neutral site would result in a 3-4 point loss. Kansas is getting very consistent positive performances from Ochai Agbaji and Christian Braun. The team normally gets at least an okay game from Martin and Wilson. But it is the others; in particular McCormack, Lightfoot, Coleman-Lands, and Harris; who mix good to great games with bad ones.

Note that K.J. Adams was out sick and was unavailable. Bobby Pettiford is also still recovering from his injury, so KU only dressed 10 scholarship players (all of whom played) for this game. Agbaji, Braun, and Martin all played season-high minutes (39, 36, and 35), which resulted in a game which saw the least amount of bench-play so far this season. Using the HHI player rotation metric (higher means less substitution), the SFA game was at 0.73, well beyond the range of 0.50 – 0.66 that the season’s first 9 games had seen. The rotation is being tightened as conference play nears.

Best Duos in Recent KU Basketball History

This blog post was inspired by a discussion that Matt Tait and Nick Schwerdt had recently. Tait always has a refreshingly positive look at the team, and Schwerdt’s assessments are always quite reasonable. If you haven’t seen it already, I recommend watching the short video located here. In it they discuss how well Ochai Agbaji and Christian Braun have been playing. Schwerdt goes as far to posit that this might be one of Bill Self’s best duos he’s had, something Schwerdt admits he wasn’t expecting to say at the beginning of the season.

This prompts both to think of other pairs at KU. Schwerdt comes up with Frank Mason and Devonte’ Graham, who played together for three seasons (2015, 2016, 2017), and which had their best collective season in 2017. Tait brings up Devon Dotson and Udoka Azubuike, who mostly played together in the 2020 season (Azubuike missed most of 2019). Another duo mentioned was Graham and Svi Mykhailiuk, although this seemed to be chosen more for stylistic reasons.

If there’s one thing Charting the Hawks seeks to do, it’s to answer questions such as these using an objective statistical-scoring system which assesses player value. The value-metric of choice will be Adjusted PPG +/-, the proprietary system developed here. This will be a one-number metric, expressed in points per game, which shows the value a player provides over that of a KU-level replacement player (or “bubble” player).

In order to see which duos have performed best, I simply separated the two best players of each season, and combined their scores. For instance, for the 2021 season, I took Marcus Garrett and David McCormack’s value scores and combined them to arrive at +7.32. I went back to each year since 1997 and then ranked the duos in terms of highest to lowest. The results are below.

The 1998 team was carried by Raef LaFrentz and Paul Pierce

Through nine games, the duo of Agbaji and Braun have been the second-best of any season since 1997, closely behind LaFrentz and Pierce. Of course, this is only through nine games. The season is about 1/4 of the way complete, so there’s reason to think both players will see their value scores revert down somewhat. (Note however that these numbers are schedule-adjusted, so they aren’t arbitrarily high due to opponent quality. Agbaji and Braun have truly been that good). The current leaders in the Bill Self era (years highlighted in blue) was the 2005 version of Wayne Simien and Keith Langford. Simien’s 2005 season is currently the highest of any player since 1997, barely nudging out Frank Mason’s 2017. Langford had a solid senior season, but the reason that due is so high on this list is because of Simien. With the Agbaji/Braun combo, it’s the case that both have been elite that is so interesting.

The next question I had was to see how rare it was for any one team to have two or more players with a value score as high as Agbaji and Braun. Without being arbitrary, we can select +5.00 as the cutoff…how many Jayhawk teams since 1997 have had two players with a value score of at least +5.00?

Since 1997, there have been 356 player-seasons (for instance Devonte’ Graham’s has 4 of these 356 player-seasons seasons since he played at Kansas 4 seasons). Only 15 out of 356 have been above +5.00. So this is a rare feat for any individual player. Rarer still is the occasion of this happening for multiple Jayhawks in the same season. In fact, it has only happened twice; in 1998 with LaFrentz and Pierce, and in 2011 with the Morris twins. Agbaji and Braun would be only the third duo if they keep this up.

In closing, Agbaji and Braun have been playing at elite levels even by KU standards, comparable to the LaFrentz/Pierce duo or even the Morris twins. But it is the vast improvement of both players which is so surprising. In a future post we will look at the largest improvements year-over-year and see how these two compare.

2010 Kansas Jayhawks

The 2010 Kansas Jayhawks finished 33-3 (15-1), winning the Big 12 Regular Season and Conference Tournament. The team earned a 1-seed in the NCAA Tournament and made the Round of 32 before losing. The team’s Sports Reference link is here.

OFFENSE

The 2010 offense was led by Sherron Collins, the senior point guard and team’s most-veteran leader. He added a solid value score of +2.41, second on the team behind much-improved sophomore PF Marcus Morris. Collins was not super efficient, but he could take and make the tough shots and get looks for others due to his skill and effort running the show. He led the team in shot frequency percentage, taking 24.2% of shots while in the game (20.0% is average). Marcus Morris’s efficiency led the team, and he did so while still contributing more than his fair share of attempts. Others positives to mention include the efficient big man Cole Aldrich and the versatile wing freshman Xavier Henry.

DEFENSE

The 2010 defense was anchored by 6’11 center Cole Aldrich, an inside force who won 12.6 possessions per 60 possessions played. He even added value in how many points he allowed, using his length and experience to overcome a lack of quickness as well as teams trying to force him to guard outside the lane. Other defensive standouts include Xavier Henry, Marcus Morris, and Tyrel Reed. Reed may have also been the team’s most underrated defender, as he led the team in points allowed per 60 possessions, with Sherron Collins behind him a bit.

Total Adjusted PPG +/-

In a bit of a surprise, Marcus Morris graded out as the top Jayhawk, although his per game value was not statistically more significant than Cole Aldrich. The 2010 Kansas Jayhawks had tremendous balance, with its top seven players in minutes played all providing positive value for the team. The depth on this roster is unmatched; freshmen Thomas Robinson, Elijah Johnson, and Jeff Withey would all be starters on the 2012 team that finished national runners-up. Despite being clearly talented prospects, they were 9th, 10th, and 13th in minutes played on this team due to depth.

It’s unfortunate this team didn’t have more tournament success, because it was poised for a deep run. Sometimes, fluke losses happen. That’s certainly what happened here. The 2010 team was versatile, experienced, and deep. It had great college players along with future NBA players. Counting its game margins and strength of schedule, it grades out as the third-best KU team (and Self’s second-best team at KU) since 1997 (behind 2008 and 1997).

Kansas' Cole Aldrich, right, hugs Sherron Collins after Kansas' 82-65 win against Kansas State...

Coverage Metrics

(Coverage metrics relates to how much video, radio, highlights, play-by-play, newspaper, etc. coverage was available to chart this season, with each medium weighted by its a preset value score. Recorded TV coverage is best, followed by video highlights, radio, and so on).

The 2010 season has a coverage score of 90.61%. This number indicates the average accuracy score for possessions that season. As it is in yellow, this makes the 2010 season slightly above the middle in terms of coverage. In general, the further back in time we go, the less video we have for that season.

Out of 36 games that season, there are still 22 games left that don’t have full video. For many of these games, partial highlights do exist and have been incorporated. Additionally, play-by-play description and analysis from newspaper coverage can help with the charting. But nothing beats video. In total, 41.9% of possessions in 2010 were charted from video, which is the second-lowest from 2006 – present. Most years prior to 2006 will be below 41.9%. The last column looks at how many possessions have a strong degree of confidence (90%+). These are plays that are either seen on video or are described through play-by-play. Nearly 9 out of 10 plays have a strong confidence, with the other 10.6% being more speculative.

The hope is that the plays which don’t have as high a degree of confidence will balance out among the players. These plays are essentially split among players based on certain estimates (i.e. if an opposing big man scores, it is likely due to the faulty defense of a KU big man who is on the floor at that time). What ends up happening is that a coverage error exists. The hope is that the error is small. If we look at the value scores again…

…we should understand that these are estimates of player value, and that there is an coverage error of some factor, perhaps as high as +/- 0.50 points per game for certain players. More work will be done to establish a coverage error number.

Coverage error is the only type of error being discussed here. Other potential errors which haven’t been discussed are systemic errors (how the system is set up), mathematical errors (in making calculations), as well as interpretation errors (i.e. when charting, the charter erroneously gives credit/blame to Player A when it should have gone to Player B).