Dajuan Harris’s last 15 games of 2023 vs. Dajuan Harris’s first 15 games of 2024:
Stat
2023 – Last 15 Gms
2024 – First 15 Gms
PPG
11.3
6.9
eFG%
62.8%
48.5%
TS%
61.5%
471.%
APG
5.8
7.1
A/TO
3.0
2.6
SPG
2.6
1.2
RPG
2.9
2.2
ORtg
109.6
102.4
Pts AB +/-
+48.39
-44.98
PPG +/-
+3.23
-3.00
Per 100 +/-
+5.14
-4.84
The numbers speak for themselves. Another notable thing is that KU’s average opponent had a KenPom rating of +17.10 over last 15 games in 2023 compared to +4.77 over KU’s first 15 games in 2024. Juan’s drop in production and efficiency has come against weaker foes.
The last three numbers are the value scores, first in total points against bubble, and then rated in per game and per 100 possession bases. These numbers account for opponent strength as well as deeper defensive metrics such as points allowed (Harris is allowing 12.4 points per game in 2024; it was 10.0 over the last 15 in 2023).
Aside from assists, Harris has gotten worse in every facet of the game. But even with assists, his increase in assists has come with a greater increase in turnovers, meaning his overall “ball-handling” value has worsened.
This and That
The following bits of info relate to the 2024 season through KU’s first 15 games.
Johnny Furphy’s defense has been better than his offense. Per 100 possessions, Furphy is about -1.03 points to a bubble player on offense and 0.00 to a bubble player on defense. Furphy is shooting well, but he relies on assists to score and turns it over far more than he creates offense for others. Defensively, his coverage score is not terrible and he rebounds at an acceptable clip.
Elmarko Jackson has posted 3 above-bubble offensive games, or 20% of the 15 he’s played so far in his KU career. And 2 of these came in KU’s first 2 games. What’s giving him any playing time at the moment is his defense. Jackson has produced 10 positive defensive outings this season (67% of games).
K.J. Adams is KU’s best defender right now, posting a +2.23 average defensive game score. This is far better than his 2023 season, which was negative (-0.10). Adams’ improvement on defense is in large part due to him defending less in the post as an undersized 5-man, his role last season. Offensively, Adams has seen a slight decline from ’23 to ’24 (+0.60 to +0.44).
Kevin McCullar’s value-score improvement from last season to this season, on a per game basis, is +3.98. This is better than Jalen Wilson’s improvement from ’22 to ’23 (+3.34), Ochai Agbaji’s improvement from ’21 to ’22 (+3.09), and Christian Braun’s improvement from ’21 to ’22 (+3.83). The largest season-to-season jump on record is Frank Mason’s ’16 to ’17 improvement (+4.52). Thomas Robinson from ’11 to ’12 was +3.67. Tyshawn Taylor from ’11 to ’12 was +3.65. Other large jumps in the past include Raef LaFrentz from ’95 to ’96 (+3.67), Keith Langford from ’02 to ’03 (+3.59), and Drew Gooden from ’01 to ’02 (+3.41). There have certainly been other great career developments of steadier growth, but in terms of having such a large leap in value production in consecutive years, what McCullar is doing this season is very special.
Hunter Dickinson’s two worst value-score games (-10.40 vs. Marquette, -6.23 at UCF) have coincided with both of KU’s losses. Through 15 games, Hunter is currently KU’s second-most valuable player this season, but is neck-and-neck with Kevin for this distinction. If both can finish the season above +5.00 per game, they’d be the first duo since the Morris twins in 2011 to do this for a Kansas team.
Jamari McDowell has not proven to be the answer to the team’s poor wing play. The freshman has produced the worst Per 100 value of any scholarship player, at -7.91. After some initial stingy defense, Jamari has gotten scored on quite frequently in limited minutes. At best, McDowell is only going to be a role player and defense-first guy this season.
Parker Braun has been KU’s 5th-best player, and might warrant more court time. He is athletic and experienced. His value scores through 15 games have been 7 positive, 7 negative, and 1 right at 0. While he is at Kansas primarily to back up Hunter, there have been a few moments where Self has gone “small” and played Adams as the 5 when Hunter is sitting. But this leads to more minutes for guys (Jackson, Harris, Timberlake) that aren’t playing as well as Braun has, and haven’t shown enough offensive firepower to compensate the loss of not having a true center inside. Parker isn’t necessarily someone who will win you the game, but he is someone who can keep you in it until Dickinson can return.
The 2023 portion of the 2024 regular season is wrapped up. KU went 12-1 during this non-conference stretch, a good result given the quality of opponents it faced. Using the NCAA’s Net Rankings, KU went 3-1 in Quad 1 games and 1-0 in Quad 2 games. Extrapolate that type of performance out over the rest of the season, and the Jayhawks will cruise into March as a 1-seed. But, this may not be that likely given a few concerning trends.
Best Game, Worse Game
Using a very similar concept to how Ken Pomeroy rates his teams, Charting the Hawks using a point margin difference to rate individual players or games. For CtH, a comparison level of a bubble-team is used to judge how well a player or the Kansas team itself is performing. This is in point differential (or margin) in comparison to a bubble-level mark. For instance, if we’d expect a bubble-level team to beat KU’s current opponent by 10 points (after accounting for location), and KU wins by 18, we’d say that KU had a “game score” of +8.00. This +8.00 score would also equal the net of all Kansas players’ individual game scores, as the system is breaking down each player’s value as a portion of the total team score.
This system is not perfect, but it does have the benefit of being easy(ish) to calculate and understand. In the non-conference, KU’s best game (relative to opponent) was its first one against North Carolina Central. KU’s game score was +24.04, meaning it won by 24 more points than a bubble-team would have expected to. On the flip side, KU’s 8-point win against Eastern Illinois garnished a game score of -15.43, indicating that the actual single-digit margin Kansas won by was about 15 points worse than what a bubble-team would have expected to achieve.
Looking at individuals, KU’s best performance in a game was Hunter Dickinson’s +17.63 margin against Tennessee. Dickinson scored 17 points in that game, but defended great (only allowing 3 points) and rebounded at an elite level, coming down with 20 official rebounds. The interior was owned by Kansas, forcing Tennessee to jack up 33 3-point shots, only to make 9. KU scored 20 more points than the Vols inside the arc that game.
Hunter also has KU’s worst individual performance. It occurred the night before the Tennessee game, against Marquette. Hunt’s score was -10.16 points, indicating a bubble-level player (think average player on a bubble-team) would be expected to play this many more points better against that opponent. In Dickinson’s case, it was the play of Oso Ighodaro which contributed to such a poor game score. Hunter had his worst defensive performance as Ighodaro scored 21 points that night, much of it against HD. In total, Dickinson would give up 26 points to Marquette while grabbing a season-low 8 rebounds.
While this was Dickinson’s worst game, on the season Hunter has been tremendous. Through 13 games, he is adding an estimated 5.35 points per game above bubble, second only to Kevin McCullar at +5.89. The team, as a whole, is averaging only +5.30 points per game above bubble. While the Hawks are 12-1, their point margins haven’t been as good as we’d expect.
Grading Projections
Before the season, KU was projected to have an average game score of +8.51 (vs. +5.30 in reality). This 3.21 point per game difference could be the difference of a win and loss in multiple conference games. In fact, KenPom’s predicted scores for KU’s conference games show 14 games out of 18 to finish within single-digits. KU having underachieving its desired margins so far is a sign of concern, as point margin has predicative implications. This doesn’t mean Kansas can’t improve. To see how, let’s break down KU’s performance to the player level.
This table shows each player’s 2024 projection and actual play through 13 games in points per game.
Player
Pre-Season Proj
Current Actual
Dajuan Harris
+2.50
-2.79
Elmarko Jackson
+0.10
-0.89
Kevin McCullar
+1.71
+5.89
K.J. Adams
+0.93
+2.33
Hunter Dickinson
+5.18
+5.35
Nicolas Timberlake
+0.32
-1.82
Johnny Furphy
-0.84
-0.12
Parker Braun
-0.39
-0.37
Jamari McDowell
-0.72
-1.07
TEAM
+5.30
+8.51
In PPG, individual scores won’t add up to TEAM due to walk-on scores missing
While there is still a lot of season left, there have been quite a few players with far different scores than their preseason predictions. Dajuan Harris has been the worst, performing over 5 points worse per game than his projection. Nicolas Timberlake and Elmarko Jackson have also been worse than expected, although Jackson has performed to his preseason expectation over his last 8 games (thanks to his defense). But KU’s guards are what’s holding the team back.
On the flip side, Kevin McCullar has overshot his preseason forecast by more than 4 points a game. McCullar is the Jayhawks’ leading scorer, having hit double-figures in every game this year. His low output was 12 against Kentucky, but this came in his first triple-double performance of the season (he’d add another against Chaminade). Fellow returnee K.J. Adams is defending at a conference first-team level after making the switch back to the defensive perimeter this season. His value score has easily exceeded his value score last year, as he’s also finding new ways to score. Newcomer Hunter Dickinson has hit his lofty preseason expectation of over 5 points of value per game. His backup, Parker Braun, is right at his incoming projection. The other wings, Johnny Furphy and Jamari McDowell, are within range of their projections, but Furphy has certainly played the better of the two.
If we look at where KU can get more value, it’s clear that the wings and interior players are tapped out. Not much more can be expected from Hunter or Kevin. KU needs its guards to start playing better on a consistent basis. This starts with Dajuan Harris. After reaching a season low -3.64 points per game against bubble mark after the Mizzou game, an unprecedented mark for a starter, Harris has responded with 2 positive games over his last 3. Against Wichita State, Harris had his best performance mostly due to a solid defensive game. It’s on this end where Harris has been especially disappointing. Dajuan was the conference defensive player of the year last season; in the 2024 season he’s worse than 1.08 points per game compared to a bubble-level defender. Had he been generating a bunch of offense to compensate, this would be more understandable. But his offense has been the worst it’s ever been, due to limited scoring and poor shooting rates on his floaters and runners.
With KU performing around 3.21 points worse per game than expected, and some of that due to the play of the walk-ons, we can essentially single out one single culprit as to why KU’s margins aren’t as strong as they were expected to be. This culprit is Dajuan Harris. While Timberlake and Jackson have been less valuable than expected, their poor play has been covered by the strong play of McCullar and Adams. Had Harris only played at a bubble-player level, or around 0.00, KU would be hitting its preseason expectations and be about fifth on KenPom (instead of 13th). Furthermore, Harris is KU’s point guard. He is the only one with the pace and ball-handling to run the team effectively at this point. KU can mix and match on the wings, using Furphy and McDowell when Jackson or Timberlake struggle. It doesn’t really have a Dajuan replacement and thus needs him to perform.
New Projections
The new projections use the actual play over the first 13 games along with the preseason projections in a weighted fashion. We should expect a player to trend back toward his preseason projection. These numbers are just a math equation; there’s been no new analysis involved at deriving them.
Player
Pre-season Proj
Current Projection
Dajuan Harris
+2.50
-0.63
Elmarko Jackson
+0.10
-0.49
Kevin McCullar
+1.71
+4.18
K.J. Adams
+0.93
+1.76
Hunter Dickinson
+5.18
+5.28
Nicolas Timberlake
+0.32
-0.95
Johnny Furphy
-0.84
-0.36
Parker Braun
-0.39
-0.38
Jamari McDowell
-0.72
-0.88
TEAM
+8.51
+6.61
In PPG, individual scores won’t add up to TEAM due to walk-on scores missing
Worst Case, Median Case, Best Case Scenario
These scenarios are updated from the preseason ones. Also included after each scenario is a look at what that team’s Final 4 chances would be, using historic F4 percentages by seed-line.
The new team scenarios are as follows. The actual worst case is of course an injury to Kevin or Hunter, but barring that improbability, a worst-case scenario that sees KU maintaining its full roster would be that KU’s guards never develop and teams continue to double on Hunter to make the others beat them. In this scenario, teams also focus their defensive energies on denying the ball to McCullar. While I can’t see KU failing to win all but a few of its home games, it could hit a tough spell during conference play on the road and rack up multiple losses in a row. For seeding purposes, KU could fall to a 5 or 6-seed if it can’t get necessary plays from its back-court. F4 chances: ~5%.
The most-likely scenario, or median case, would be that Jackson and Harris pick things up, building off of recent good performances, and start to produce for the Jayhawks during conference play. Harris doesn’t seem far off, and Jackson has been a legitimately solid defender whose offensive game has started to come around (had a career high 12 points vs. Wichita State). In this scenario, KU continues to win close games, loses a few close games, but also gets a bit better on the margin front which helps it out. KU earns a 2 or 3-seed and has a good chance to make the second weekend given its experience and talent. F4 chances: ~15% (Bart Torvik puts KU’s F4 chances at 10.4% as of 1/2/2024)
The best-case scenario is that KU gets the Dajuan Harris of last season to go along with the excellent play of its wings and front-court. Jackson fills his role nicely as a solid transition player and defender, Furphy and Timberlake come off the bench to knock in 3’s, and Braun and McDowell continue providing solid energy so the team can play 9 and stay fresh. In this scenario, KU establishes its dominance during conference play and fends off the new teams with strong efficiency marks in non-conference play. KU then goes on to earn a 1-seed in the NCAA’s and puts itself in a good position to make a Final Four run. F4 chances: ~35%
The following table projects the career majors for 100 top and notable golfers. This projection was made as of January 1, 2024. The ages listed reflect the golfer as of this date.
Player
Age
Current Majors
Projected Majors
Est’d Total Majors
Tom Kim
21
0
2.23
2.23
Scottie Scheffler
27
1
2.17
3.17
Collin Morikawa
26
2
1.77
3.77
Gordon Sargent
20
0
1.60
1.60
Viktor Hovland
26
0
1.55
1.55
Jon Rahm
29
2
1.54
3.54
Jordan Spieth
30
3
1.43
4.43
Sungjae Im
25
0
1.42
1.42
Rory McIlroy
34
4
1.08
5.08
Joaquin Niemann
25
0
0.90
0.90
Rasmus Hojgaard
22
0
0.80
0.80
Justin Thomas
30
2
0.72
2.72
Xander Schauffele
30
0
0.69
0.69
Patrick Cantlay
31
0
0.69
0.69
Cameron Smith
30
1
0.61
1.61
Cameron Young
26
0
0.60
0.60
Brooks Koepka
33
5
0.56
5.56
Matt Fitzpatrick
29
1
0.55
1.55
Sam Burns
27
0
0.54
0.54
Nicolai Hojgaard
22
0
0.49
0.49
Will Zalatoris
27
0
0.44
0.44
Hideki Matsuyama
31
1
0.43
1.43
Bryson DeChambeau
30
1
0.41
1.41
Ludvig Aberg
24
0
0.37
0.37
Ryo Hisatsune
21
0
0.31
0.31
Tommy Fleetwood
32
0
0.30
0.30
Min Woo Lee
25
0
0.29
0.29
Sahith Theegala
26
0
0.27
0.27
Tyrrell Hatton
32
0
0.27
0.27
Si Woo Kim
28
0
0.21
0.21
Jason Day
36
1
0.21
1.21
Patrick Reed
33
1
0.19
1.19
Mito Pereira
28
0
0.19
0.19
Corey Conners
31
0
0.18
0.18
Wyndham Clark
30
1
0.18
1.18
Tony Finau
34
0
0.16
0.16
Cameron Davis
28
0
0.16
0.16
Beau Hossler
28
0
0.15
0.15
Denny McCarthy
30
0
0.14
0.14
Rickie Fowler
35
0
0.14
0.14
Max Homa
33
0
0.13
0.13
Russell Henley
34
0
0.12
0.12
Aaron Rai
28
0
0.11
0.11
Christiaan Bezuidenhout
29
0
0.11
0.11
Justin Suh
27
0
0.11
0.11
Emiliano Grillo
31
0
0.11
0.11
Shane Lowry
36
1
0.10
1.10
Dustin Johnson
39
2
0.10
2.10
Talor Gooch
32
0
0.10
0.10
Patrick Rodgers
31
0
0.09
0.09
J.T. Poston
30
0
0.09
0.09
Brian Harman
36
1
0.09
1.09
Taylor Montgomery
28
0
0.08
0.08
Abraham Ancer
32
0
0.08
0.08
Lee Hodges
28
0
0.08
0.08
Adam Svensson
30
0
0.06
0.06
Sepp Straka
30
0
0.06
0.06
Harris English
34
0
0.06
0.06
Vincent Norrman
26
0
0.06
0.06
Adrian Meronk
30
0
0.06
0.06
Keegan Bradley
37
1
0.06
1.06
Harold Varner III
33
0
0.05
0.05
Jordan Smith
31
0
0.05
0.05
Byeong Hun An
32
0
0.04
0.04
Adam Schenk
31
0
0.04
0.04
Adam Hadwin
36
0
0.04
0.04
Andrew Putnam
34
0
0.04
0.04
Cameron Tringale
36
0
0.03
0.03
Mackenzie Hughes
33
0
0.03
0.03
Billy Horschel
37
0
0.03
0.03
Yannik Paul
29
0
0.03
0.03
Adam Scott
43
1
0.03
1.03
Thorbjorn Olesen
34
0
0.03
0.03
Gary Woodland
39
1
0.03
1.03
J.J. Spaun
33
0
0.03
0.03
Nick Taylor
35
0
0.03
0.03
Alexander Bjork
33
0
0.03
0.03
Justin Rose
43
1
0.03
1.03
Mark Hubbard
34
0
0.02
0.02
Jason Kokrak
38
0
0.02
0.02
Dean Burmester
34
0
0.02
0.02
Chris Kirk
38
0
0.02
0.02
Stephan Jaeger
34
0
0.02
0.02
Alex Noren
41
0
0.02
0.02
Ben Griffin
27
0
0.02
0.02
Brendon Todd
38
0
0.02
0.02
Matthieu Pavon
31
0
0.02
0.02
Matt Wallace
33
0
0.02
0.02
Ben Kohles
33
0
0.02
0.02
Ryan Fox
36
0
0.02
0.02
Marc Leishman
40
0
0.02
0.02
Sam Ryder
34
0
0.02
0.02
Luke List
38
0
0.02
0.02
Matt Kuchar
45
0
0.01
0.01
Tiger Woods
48
15
0.01
15.01
Chesson Hadley
36
0
0.01
0.01
Eric Cole
35
0
0.01
0.01
Nicholas Lindheim
39
0
0.01
0.01
Lucas Glover
44
1
0.01
1.01
Phil Mickelson
53
6
0.00
6.00
The list is sorted in terms of projected majors from 1/1/2024 on. Tom Kim leads, with a projected 2.23 majors.
The Process for Determining Future Major Champions
Major championships are the defining feature of professional golf, defining a player’s career across generations. Debate about who the greatest golfer of all time generally ends once Jack’s 18 is brought up. When a golfer wins multiple majors, his career is almost always compared to others with the same major total. Brooks Koepka, once he became the 2023 PGA Champion, suddenly joined the echelon of Seve Ballesteros as 5-time major winners. Pundits discuss who the best players are to have not won a major, indicating that this accomplishment is what truly makes a golfer great.
In addition, young players’ careers are often forecast in terms of major championship potential. When we hear of a young new potential star, the question emerges naturally. How good is this new guy gonna be? Just good enough to win a handful of times on Tour and enjoy a profitable career good? Or multiple majors good?
What hasn’t been done, to my knowledge, is the creation of a systematic process meant to identify which golfers have the best potential to win majors. The goal of this process is to quantify a player’s major championship potential. This is no easy task, but there are five key factors that determine a player’s expected future majors.
Skill level
Age
Past major performance
Health
Major Qualifying Status
Skill Level. As Data Golf has shown, the average major winner has been a player who was playing about 1.5 strokes per round better than an average PGA Tour player leading up to the event. In fact, only 6% of the last 113 major winners were playing worse than an average PGA pro in the onset of those majors. Additionally, pre-tournament models and betting odds reflect that the better the player is, the better his chance is at winning a major.
Age. When projecting out a career, age is also important. The vast majority of major champions have been between 23 and 39 years old. While there are a handful of 40+-year-olds who have won majors, only once as a golfer in his 50’s won a major (Phil Mickelson). As players age, their career windows for winning majors shrink. Historically, the prime spot in a career for golfers has been during their early-30’s (30-32). Lately, there are indications this number has moved toward younger golfers, i.e. those around 28-29. Whatever the case, age is a huge factor.
Past Major Performance. There is a tendency for some guys to play better in majors (than their record week-to-week would otherwise suggest), and for some to play worse in majors. Brooks Koepka is a paradigm example of this, having won 5 majors at this point.
Health. Health is similar to age, in that it determines the amount of opportunities left for a golfer to win a(nother) major. This is difficult to project, but the factor is implicit when we look at historic data.
Qualifying Status. This factor has grown in importance with the onset of LIV and the OWGR refusing to award points to these LIV events. Numerous LIV players without exempt status have lost and will continue to lose major opportunities unless something changes. Talor Gooch is a prime example. As a player in his 30’s, the next couple of years will be his best chance to win a major. Currently, he is not exempt in a single major for 2024 despite winning the 2023 LIV Golf individual title.
The five factors are accounted for in the model, which uses a player’s historic skill-level (using Data Golf public strokes-gained data), age (easy to get), and past major performance (using an internal model which projects estimated true majors won). Implicit in this data will be health data, with qualifying status being important mostly to the names on LIV that don’t have exemptions.
The most time-consuming part of the model was the creation of a player/age skill curve (PASC), which measures the normal career of a player as he ages. Regardless of relative skill level, the average player is at the top of his career during a period between age 26 and 35, normally peaking around 30-32. As mentioned earlier, the trend has been for players to peak younger.
The PASC allows us to project out a player’s remaining career. It is by no means perfect, but it does help to compare a player who is very good for 21 (like Tom Kim) vs. one who is in his prime years.
Independent of the PASC is the major performance chart, which looks at how a player has performed in majors so far using an in-house performance model. This is weighted to be important, but not overriding.
Analyzing the Results
Tom Kim is projected to win 2.23 majors in his career according to this model, the most of any golfer moving forward. The factors in Kim’s favorites are numerous. He is young yet still very skilled. Additionally, he has a T2 finish at a major (2023 British Open). Him being healthy and exempt in 2024 to the majors is also a plus.
Contrast Kim (2.23) vs. Ludvig Aberg (0.37). Aberg burst onto the scene with a solid rookie season, but there are some things that the model dislikes about Aberg’s chances. First, his skill-level has actually been worse than Tom Kim’s in each of the last 4 years. Kim has been better, in terms of strokes gained. Adding context to this is that Kim is three years younger than Aberg. Kim’s age 24 season is projecting out to be better than Aberg’s very good age 24 season. Aberg has also not had a top major finish. This leads to more uncertainty regarding his ability to contend in the biggest events. One might assume that Ludvig will contend in majors without problem, but this isn’t always the case. Max Homa didn’t earn his first Top 10 in a major until last year, during his age 33 season.
Gordon Sargent is also projecting out very high, as the model assumes he should win 1.60 majors in his career. At age 20, Sargent has shown elite potential. Collin Morikawa, who has won 2 majors already, is still only 26. He is just entering his prime. Don’t sleep on him. Of all players currently 30 or over, the model still loves Jordan Spieth to win another major or more. Spieth’s performance in majors is underrated. People forget his 2019 PGA and 2021 British Open battles despite not playing great during this point of his career. Even if Spieth has already peaked, he will have a chance to rack up another grand slam event somewhere along the way.
The LIV guy hurt the most by the current OWGR system is Joaquin Niemann. The model has him winning 0.90 majors, but if he can’t receive exemptions over the next couple of years it will hurt his chances (he has qualified for the 2024 British already). So, adjust this score down somewhat.
Lastly, the model is likely underrating Koepka’s major potential. The problem with any model is that it attempts to apply general factors to specific players, and Brooks is anything but general. Koepka’s career is special. He plays at an elite level in majors, and the major performance factor should likely be weighted more heavily for him. But coming into his age 34 season, he has fewer chances to add to his career than one might otherwise think.
Phil Mickelson is projected to win 0.002 majors moving forward. While I wouldn’t write him off completely (he did finish T2 at last year’s Masters), his 6 majors is a great career and likely the end result. However, his new nemesis, Rory McIlroy, has been sitting on 4 majors for 9 seasons. Rory, a consistent top player with strong major results is expected to win 1.08 more majors, which would be behind Mickelson’s career total. This is an interesting dynamic for sure.
Ideas for the Future
The plan is to do this projection yearly and eventually see how accurate these forecasts are. With time, it would also be enlightening to run this model from some point in the past (say 2000 or 2010) and see how accurate the model was.
Some intriguing bets for most career majors (which include majors already won) are:
Scottie Scheffler (1) vs. Justin Thomas (2). Scheffler is projected to win 2.17 more; Thomas to win 0.72 more. Scheffler leads at the moment, but JT currently has a 1 major lead and there is a famous saying about 1 in the hand being worth more than 2 in the bush.
Matt Fitzpatrick (1) vs. Viktor Hovland (0). Each is projected to finish with 1.55 career majors. Viktor looks to have more potential, but when can he get that first major?
Bryson DeChambeau (1) vs. Sungjae Im (0). Sungjae is only 25, just a year older than Ludvig Aberg. Sungjae has a T2 in a major (2020 Masters). Sungjae has been a consistent performer on the PGA Tour. The model is high on Sungjae Im. Bryson, in contrast, has recently battled injury and is already 30. Right now, the model says Sungjae gets 1.42 majors and Bryson gets 1.41.
Tom Kim (0) vs. Dustin Johnson (2). The model has Kim leading. Tom Kim has many years of prime golf ahead of him; Dustin Johnson has already started to slip. Dustin turns 40 in 2024. He might have one more left in him. But the model thinks Kim has a better chance to win more majors (2.23 vs. 2.10).
Closing Thoughts
Current LIV Golfers are projected to win 0.62 majors in 2024, and this works about to about a 50/50 chance that any current LIV golfer wins at least one major. This may seem small, but the PGA Tour has the larger quantity of top players. I would better the over (i.e., at least 1), in part because I think the model is overlooking Bryson DeChambeau’s recent improvement.
Not all golfers are included on the list above, just the top 100 (or top 98 + Phil & Tiger). There is still a chance a winner comes from outside this list. This model isn’t meant to downplay the chances of anyone left off, it’s just that for purposes of time and space we only included 100 names. If any 2024 major winner does emerge outside this list, we can backward forecast his chances (by looking at his career as of 1/1/2024) and update the table to reflect what his projected chances were coming into 2024.
Starting in 2024, the Big 12 will have 16 teams. Or even more. With Florida St. jostling to leave the ACC, thus making things shaky over there, and commissioner Brett Yormark looking to expand the Big 12’s footprint, this could change. But for now, the plan is 16 teams.
However, there aren’t a ton of historically great football programs in the Big 12. Since 1869, the first year college football emerged, teams have been playing and building up a profile of their program. Once we combine all end of season poll rankings, bowl appearances and victories, and weight the recent BCS and CFP championships, we get a defensible list of programs rated from best to worst. For the new Big 12, here’s the list (and associated ranks).
29. TCU
37. West Virginia
39. Colorado
42. Oklahoma State
44. Arizona State
46. Baylor
51. Brigham Young
52. Kansas State
55. Houston
57. Texas Tech
58. Utah
68. Kansas
71. Cincinnati
72. Arizona
78. Iowa State
82. Central Florida
This collection of programs also has 2.8 National Championship Shares. See here for an explanation of NCS. Of this group, only 2 programs have made the CFP (TCU/Cincinnati), and only one program (TCU) has made a national championship game appearance since the beginning of the BCS/CFP era (1998).
The average ranking is 55.1, and the median ranking is 53.5 So, historically, these teams haven’t dominated. But let’s just look at how these teams fare from the beginning of the BCS/CFP era (1998-on).
20. TCU
24. Oklahoma State
28. Kansas State
29. Utah
30. West Virginia
33. Cincinnati
35. Baylor
43. Central Florida
44. Brigham Young
49. Texas Tech
50. Arizona State
53. Arizona
58. Iowa State
59. Colorado
60. Houston
72. Kansas
The average ranking here is 42.9, with the median ranking at 43.5. And a couple programs creep into the top 25, something that the conference failed to get when looking at all-time rankings. Looking at some of the teams that left the Big 12 semi-recently; Nebraska ranks 23, Texas A&M 32, and Missouri 37.
So, these programs have been better recently than their long-term history suggests. Now let’s rank these teams just from the beginning of the CFP era, which was 2014 (10 seasons).
12. TCU
16. Oklahoma State
20. Baylor
22. Utah
23. Cincinnati
29. Central Florida
31. Kansas State
39. Iowa State
41. West Virginia
43. Arizona
44. Houston
48. Brigham Young
53. Arizona State
65. Colorado
81. Texas Tech
114. Kansas
The average rating is 42.6, with the median at 40. The top teams are better, with 5 programs in the top 25 over the last 10 seasons. Of those who left, Nebraska is 85, Texas A&M is 30, and Missouri is 35 in this span. Just being included as a member of the Big Ten or SEC does nothing to help your program necessarily.
Who knows how things will play out, but the Big 12 will get a guaranteed team to the 12-team CFP next season, and depending on how things work out, might get 2 or even 3 with 6 available at-large berths.
Let’s look at the other new conferences. First, the new SEC:
1. Alabama
3. Oklahoma
8. Texas
11. LSU
12. Georgia
14. Tennessee
15. Florida
17. Auburn
25. Arkansas
26. Texas A&M
28. Mississippi
36. Missouri
60. Mississippi State
66. Kentucky
67. South Carolina
93. Vanderbilt
Average rating is 30.1; median is 21. The total NCS is 37.5, which is considerably more than the Big 12. We won’t list ratings from 1998 or 2014-on, but since 1998-on the new SEC has 6 top 10 teams. It has won 6 of the 9 CFP games with a chance to win 7/10 if ‘Bama can pull it off this season.
The new Big 10 will add four teams from the West Coast, and it will have the following rankings:
2. Ohio State
4. Michigan
5. Nebraska
6. Southern California
9. Penn State
18. Washington
22. Oregon
23. UCLA
24. Wisconsin
27. Michigan State
30. Iowa
32. Minnesota
38. Illinois
48. Maryland
49. Purdue
53. Northwestern
79. Indiana
100. Rutgers
Average rating is 31.6; median is 25.5. Again, this is better than the new Big 12 to be sure. The total NCS is 35.3, just slightly below the SEC’s. Ironically, the oldest of these programs, Rutgers (which played in the first college football game ever), is also the worst at #100. Rutger’s only national championship share (of 0.5) came in this first season, where it is recognized as co-champs alongside Princeton. Rutgers has never won a bowl game above Tier III (bowls are tiered into four categories based on strength), being one of only a few power conference teams with this distinction.
Last, we will look at the current ACC. We will include Florida State and Notre Dame since ND plays around 5 games against ACC opponents each year.
7. Notre Dame
10. Florida State
13. Miami (Fla.)
16. Clemson
19. Georgia Tech
20. Pittsburgh
21. Stanford
33. Virginia Tech
34. California
35. Syracuse
45. North Carolina
54. Southern Methodist
56. North Carolina State
59. Duke
62. Louisville
64. Boston College
74. Virginia
88. Wake Forest
Average rating is 39.4; median is 34.5. NCS is 29.7. Again, the Big 12 is the outlier in terms of national championship shares. Since 1998, these 18 ACC schools have two top-10 teams (Florida State at 5 and Clemson at 6). However, the average ranking is 43.2 and median is 39.5. Those average and median
rankings are comparable to the new Big 12 programs during this time.
The “others” are teams that don’t have a spot in one of the current big four conferences. These include Oregon State and Washington State. Of these “others,” there are a total of 46.8 NCS. Most of these came from Ivy schools early on in the history of the sport. Other schools such as Boise State and Tulane are hoping to improve their conference affiliation and boost their program’s profile should more rounds of realignment see them added somewhere. But there’s not much these teams can do at the moment.
Should I stay or should I go?
Soon after being excluded from the final four-team CFP, Florida State made public its intentions of leaving the ACC. This will be difficult considering that it signed into a GOR agreement with the other ACC schools, but only the future knows what will happen and how long it will take for things to change. The SEC doesn’t seem to want Florida State, and the Big 10 is also hesitant according to reports. The Big 12 would love to add FSU (alongside teams like Clemson and North Carolina) as a way of jockeying itself as a strong third conference to challenge the emerging hegemony of the two others. Where this would leave the handful of other ACC teams remains to be seen.
There are so many issues at play here, but let’s start with the playoff formats as they’ve evolved. Florida State has begun to feel that the ACC was beginning to not be competitive enough for it to compete for national championships, so when the committee essentially agreed by leaving the Seminoles out, this was the straw that broke the proverbial back.
But, is this the case moving forward? With a 12-team playoff, FSU would have been hosting the 12 seed Liberty Flames and then gotten a chance to take on the 4-seed Alabama Crimson Tide. Furthermore, had things gone differently in the SEC (such as Auburn holding on to win the Iron Bowl), FSU would have likely remained in. The 12-team playoff should take care of the problems of the BCS/4-team CFP era, which was the oddities and vagaries of the college football season leading to controversial selections. A large enough playoff at least gets all good teams into the final tournament, although the seeding controversies (i.e. who gets a bye) will likely remain. The point of this segue is to argue that Florida State might be best to remain as the top dogs of the ACC. With Clemson slipping, and Notre Dame not technically playing for a conference bid, FSU is primed to finish with a strong record each year and have a good chance to win the league on a consistent basis. No ACC league champion will get left out moving forward.
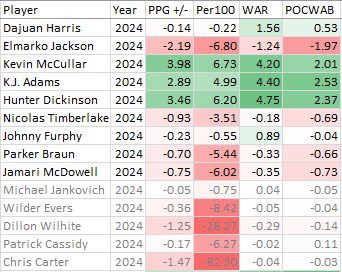
Eleven games into the 2024 season, KU’s been carried by its “Big 3” of Hunter Dickinson, Kevin McCullar, and K.J. Adams. The trio has combined for 64.7% of KU’s points scored this season while playing 48.4% of available minutes. This production works out to points per game averages of 19.2, 19.2 and 13.0. No one else on the team averages even 7.0.
Additionally, these three have been the best defenders on the team according to the charting. Per total per game value; Dickinson (+6.64), McCullar (+5.14), and Adams (+2.31) are playing well beyond that of a bubble-player, while all 6 of the other scholarship guys are below 0.00. KU is heavily reliant on this trio to win games.
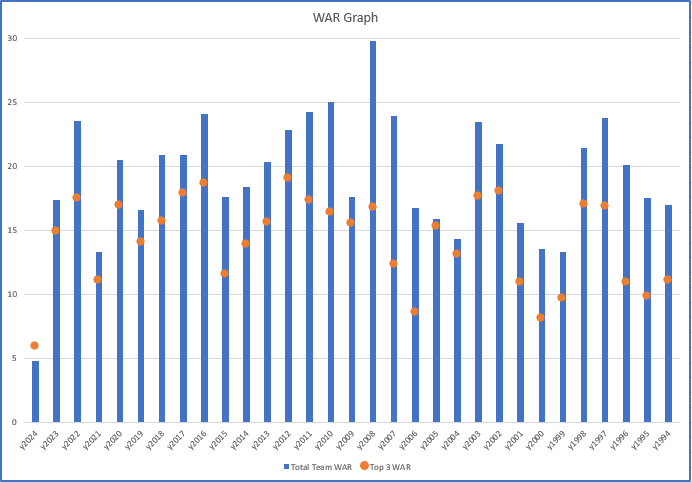
For a Kansas team to be so reliant on just a few players seemed odd, so I explored a way to quantify this and compare it to other KU seasons. The best way was to use WAR, which is additive, and sort each season by that year’s team’s most valuable player to its worst.
Here are the numerous ways the 2024 team stands out:
Of the 2024 team’s total WAR, each of KU’s Big 3 has collected at least 25% of the team’s total WAR (note that a player can be negative if he has negative WAR). Since 1994 (31 seasons), only once has this happened over the course of an entire year (2017 with Frank Mason, Josh Jackson, Devonte’ Graham).
Through 11 games, the trio of HD/KM/KJA has produced 5.94 WAR, which if multiplied out to a 36-game season, would be 19.43. This would be the best out of any KU team’s best three players, with the 2012 team earning 19.07 during a 38-game schedule. (If we compared apples to apples, this year’s Big 3 is on pace to earn 20.51 WAR over 38 games).
It’s not only that this year’s top trio is playing well; it’s also that no one else is doing much. Of the team’s total WAR, the HD/KM/KJA three have earned 124% of the WAR, indicating that the sum of everyone else is below replacement-level. At no point since 1994 have players 4 on down collectively generated negative Wins Above Replacement score for the Kansas Jayhawks. The closest was in 2005, when all players save Wayne Simien, Keith Langford, and Aaron Miles produced a meager 0.53 WAR. The current 2024 non-Big 3 is at -1.15 WAR through 11 games.
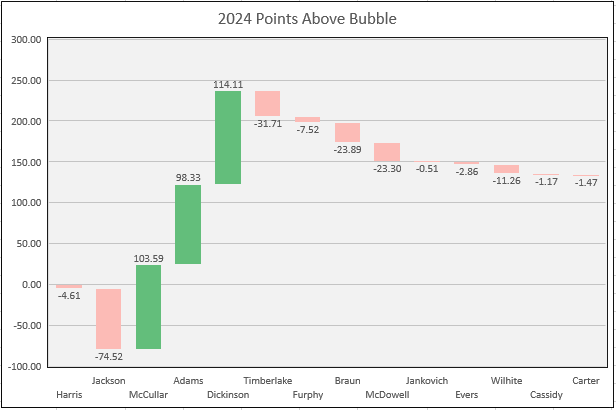
Note how the orange dot (Top 3 combined WAR) is always contained within the blue bar (Total Team WAR) except for the 2024 season. For the 2024 team, KU’s needed everything it has gotten from its Big 3 due to the rest of the roster struggling to play at a high level. Projecting forward, one assumes that Dajuan Harris will pick things up. There might also be some reversion down, particularly with Kevin McCullar. McCullar has vastly over-performed his projected marks coming into the season.
(Long article. Scroll down to bottom for the summary)
During the midst of the 2023 season, KU had a 3-game losing streak and a date at Rupp Arena against a talented Kentucky team. Dajuan Harris was coming off poor showings in his last 2 games, and questions surrounded a team that had no true center in the starting rotation and a pass-first point guard who wasn’t a natural scorer.
Kansas went on to beat Kentucky that game, bolstered by great play from Jalen Wilson, but also a good outing from the rest of its starters, including its point guard Dajuan Harris. From that game forward, KU would play 16 games to close out the season. Harris produced a +3.22 per game value score, indicating that he was worth over 3 points per game to Kansas than a “bubble” level player would be. During this stretch, Harris was playing his best ball, comparable to a junior-year Frank Mason (2016 season) or senior-year Tyshawn Taylor (2012 season). Harris was doing it in different ways than these scoring guards; certainly through defense first, but he was also adding value on offense thanks to both shot-making and assisting.
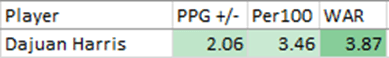
In fact, during the closing stretch of 2023—KU’s final 10 games, Harris produced offensive value of +1.06 per game. This was third on the team behind Wilson and Gradey Dick over that period. While KU getting bounced in the Round of 32 wasn’t fun, no one can blame the play of Dajuan Harris. He was solid against the Razorbacks on both ends, adding about a point-and-a-half both ways and +3.30 points overall. For the season, Harris contributed +2.06 points per game above bubble. Roughly, based on his play, Harris was worth 2 points a night when compared to an average player on a bubble-team.
The elements for Dajuan Harris having a successful 2024 were all in place. He was coming in as a 5th-year-in-the-program player (having redshirted), 2-year starter who saw his game improve each season. Always a defense-first, pass-first player, Harris had improved during the back-half of his junior season and started to be a net contributor to the offensive scheme. This development is common, but not guaranteed, among Bill Self program guys. Harris was making the same strides in his game that others had before him. Some of these strides were unique to him, but he was playing better and making a positive mark on a program that has had numerous talented players come through.
Coming in to the 2024 season, Harris was projected to be a +2.50 player on the season, a conservative improvement on his 2023 value scores. Harris was expected to see a slight bump on both offense and defense. It wasn’t that his expectations were too high. If anything, they were somewhat low. By all appearances, Harris had figured things out. His defense had been consistent throughout his career, and now his offense had finally come around. With Hunter Dickinson coming in, his assist numbers would reach career highs. His shooting and scoring would still be there, but he wouldn’t need to do too much.
But through 10 games, this hasn’t been the case. Not only is Harris not performing to his projections, he isn’t performing anywhere near what he is capable of. He is playing worse than in 2023, by a long shot. He is also playing worse than he did in 2022, when he was a role player on the national championship team. But not only that, Harris is worse than he was in 2021 as a red-shirt freshman who rarely shot and got taken advantage of by stronger players.
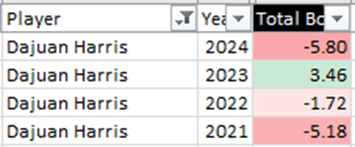
Looking at Per 100 numbers, that is the value a player adds (in points) to his team over the course of 100 possessions, Harris’s development looks like this:
2021: -5.18
2022: -1.72
2023: +3.46
Players tend to improve as they age through their college careers, although again not everyone develops in this straight-forward of a manner. Some players have drops in value or flat-line after they reach certain points. So, if Harris was merely on pace to produce a similar or slightly worse season than last year, this wouldn’t be out of the ordinary. Even if Harris was noticeably worse, say close to 0.00, it would be disappointing but not unprecedented. Unfortunately, this isn’t the case, either. In fact, Harris is playing the worst basketball of his career at Kansas.
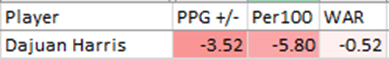
2024: -5.80
Again, this is a per possession number, so it takes into account the fact Harris is playing more than he has in past seasons. On a per possession basis, Harris is worse than a bubble-player by 5.80 points, which is even worse than his value during his freshman season of 2021.
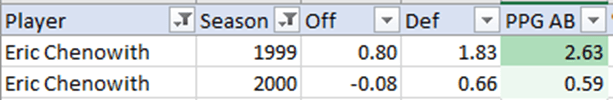
If we look at it from a per-game mark, it looks even worse. At -3.52, Harris is producing the worse per-game mark of any Jayhawk rotation player by over a full point per game (2019 Quentin Grimes -2.40). Harris is also worse than his prior season at over 5.50 points per game. Never has there been such a drop-off, year-over-year. KU has had players unexpectedly decline, Eric Chenowith’s junior year (2000) being one example (he went from a +2.63 player to a +0.59 player), but it has never been this dramatic.
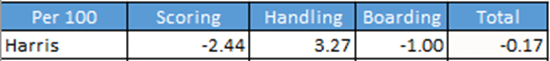
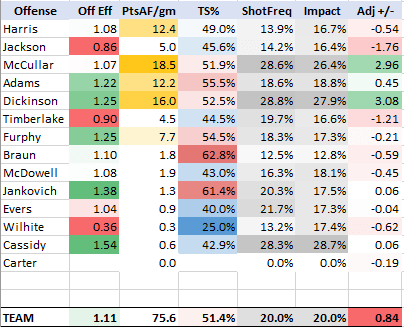
Breaking down Harris’s play so far, we’ll first look at offense, comparing his 2023 and 2024 seasons.
Going through each line, we see that Harris’s efficiency has slipped from 1.11 to 1.03. What makes this worse is that KU hasn’t faced its meaty conference schedule yet. Not only is Harris less efficient, he is less efficient against an easier schedule. Harris is accounting for nearly 2 fewer points per game on offense than he did last year, despite playing more minutes. Harris is shooting worse overall than he did last season (49.5% vs. 45.2%). He is also shooting less, despite the team needing him for more production. In turn, his impact is less this season. Once we adjust for opponent, we see that Harris is 2 points worse (in terms of overall value) on this end that he was last season.
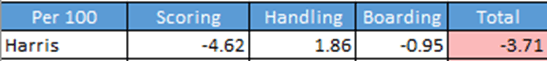
Breaking down into offensive categories on a Per 100 possession basis, we see (2023 vs. 2024):
Not only is Harris’s scoring down, his handling (turnovers/assists) is also down. Only his boarding, or offensive rebounding value, has changed for the better. But in terms of overall value, this increase is negligible.
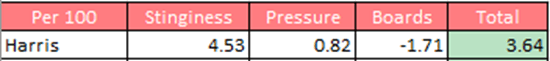
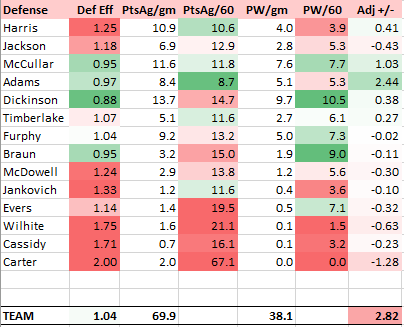
Defensively, Harris has declined even more.
Harris went from a stingy defender, giving up 9.2 points per 60 possessions to allowing 11.8 per 60. The other important category, possession winners (PW), went from 5.3 to 4.2 per 60. A player needs to win possessions to add value. Harris is getting fewer steals, forcing fewer turnovers, and not rebounding any better while giving up more points to his man. All despite playing an easier schedule when compared to 2023 numbers. This leads to a player who is worse on the defensive end by more than 3 points a game.
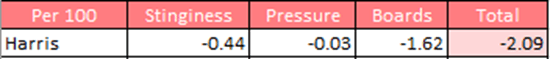
His Per 100 numbers on defense, broken down into categories:
Harris went from KU’s best defender in 2023 to its worse in 2024. How? Well, mostly by giving up too many points to his opponent. A stinginess score in the red means he has to add value from generating turnovers (which he hasn’t done well at in 2024) or rebounding (which is marginally better, but as a point guard, not ever going to be the area where he adds defensive value). This is the biggest disappointment in Dajuan’s decline. He was the Big 12 defensive Player of the Year last season. Now, he’s a liability most games.
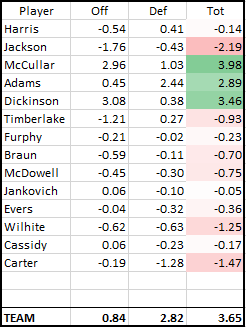
2023 vs. 2024. Harris is over 5.50 points per game worse in 2024. He is over 9.20 points worse Per 100. He has also gone from a season where he added 3.87 Wins Above Replacement to one where he has lost 0.52 WAR.
Should Harris be benched?
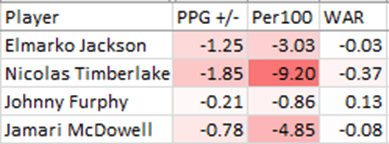
Dajuan is putting up historically-bad numbers in a season which has him playing historically-high minutes. Clearly, something isn’t working with him. But if KU went to the bench, who would replace his minutes? We can’t consider Adams, McCullar, or Dickinson/Braun, players whose minutes are already maximized or aren’t suitable replacements for a guard. Let’s look at KU’s other four guards/wings in terms of player value. Remember, based on the roster, KU needs to have at least 1 of these guys on the court at all times right now. If Juan gets benched, you’ll need 2 of these 4 to play at once.
There’s a bunch of red here. For one, Nicolas Timberlake is playing worse than Harris on a per possession basis. Next, we can look at the play of Jamari McDowell and Elmarko Jackson. Neither has been much better than Harris. McDowell in particular has struggled recently after a hot start. Of these four, only Furphy has produced near bubble-level value and positive WAR.
So, let’s grant that Furphy has been better than Harris. Who else do you go with? Elmarko has had his poor moments. McDowell is very limited on offense, and his defense won’t likely become elite anytime this season. Timberlake is an even worse option. Another consideration is that, when you take Juan out, you need Kevin McCullar to run more point/generate more offense. Sure, you still have Elmarko and maybe part of the solution is giving him the keys from time-to-time. But if he’s been struggling as an off-guard with less pressure, what chance does he have being the guy to get everyone organized and the offense started?
KU’s best chances are still with Harris. He cannot, surely cannot, continue to play as poorly as he has. As a 3-year starter, Harris put up back-to-back seasons that were better than anyone else on the list above. If he could just match the 25% percentile of his play over the past two years, he’ll be much more valuable on the court than more minutes for the other four guards/wings.
Silver Lining
The good news is that Harris will not continue to play as poorly as he has. Yes, it’s been a disappointment. Here are many reasons to consider that his play will tick up.
He will get exploitable matchups as teams game plan around stopping Hunter/Kevin/K.J. He will get open layups, open 3’s, and other opportunities.
He will have a few defensive shut-down games to boost his defensive score.
As schedule gets harder, Harris will play up to his opponent. While he hasn’t done well against KU’s better opponents, he’s still better against KU’s 5 power-conference foes (-2.87 per game) than the 5 lower-tier opponents (-4.17 per game).
Harris’s score can naturally climb faster given how poor he’s been. Just a few positive games can be enough to change the narrative.
The team is currently 9-1 despite him playing poorly. Juan hasn’t been responsible for a loss, as the 14-point Marquette loss was the fault of many poor showings.
Precedence of Tyshawn Taylor in 2011. Taylor was -3.89 per game during 17 conference regular season/tournament play yet still finished the season with a solid NCAA Tournament of +3.35 per game (even his play during the VCU game wasn’t terrible). So other good players have gone through disastrous stretches but still picked things up later on.
Precedence of Remy Martin in 2022. Harris’s former teammate Martin had a disappointing regular season (-0.05 per game). But in his 9 tournament games (Big 12 + NCAA’s), Martin put up +3.66 per game in value, hitting huge shots in key moments during KU’s National Title run. Again, like Taylor, we see improvement when it matters most.
If Harris can get back to the level of play he had in 2023, his tough start to 2024 won’t matter at all.
Conclusion
Here are the key points. Dajuan’s performance through 10 games this season has been his career worst. Compared to other KU starters, Harris has been worse than any other Jayhawk in 30 years. He has seen decline in his game across all categories, but the primary problems have been with his scoring and defensive coverage. He isn’t scoring enough but is letting his man score too easily.
However, despite his poor play, Harris is a necessary component to this team. His would-be replacements are either worse or wholly unequipped to carry the load as a Big 12 point guard. Not only does he need to play, he needs to play substantial minutes for this team.
The expectation should be that Harris improves and is back to being a positive contributor by season’s end. There is precedent for good Kansas guards figuring it out by NCAA Tourney time. As KU is winning despite his poor play, a solid Dajuan Harris can make this team a true national title contender.
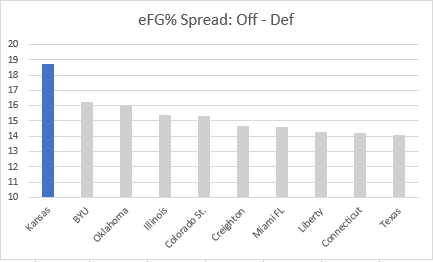
KenPom has Kansas as the 6th best eFG% offense and the 14th best eFG% defense in nation, counting only D-1 matchups. This spread, of 18.7%, is the best in the nation and nearly 2.5% better than the second-best of BYU. To reference, the difference from #2 BYU to the #10 team is smaller than the gap between Kansas and BYU. Which is to say, KU’s shot quality is far superior to its opponents in the brief number of games played so far.
While KU is winning the shot quality battle, it is losing the other battle, that is the battle for net extra possessions. A net extra possession means offensive rebounds minus turnovers. Teams that turn it over too much lose out on chances to shoot. Teams that hit the offensive glass add shooting chances. We want to find the net of these numbers.
Collectively, KU’s opponents have had -1 net extra possessions, meaning KU has forced 1 additional turnover than it has allowed offensive rebounds. This doesn’t sound all that bad on the defense’s behalf, until you see what KU’s offense has done. In its 6 games, KU has turned it over 41 more times than it has got an offensive board, meaning the team is -41 in this metric. If we find the difference between these numbers, we see that KU’s opponents have had 40 more chances to score than KU has this year, solely due to turnover and offensive rebounding differences. This works out to -6.7 per game. KU is effectively getting 7 fewer scoring chances than its opponent on average. If we only consider the top opponents, who to this point are Kentucky, Marquette, and Tennessee; KU is -11.3 per game. Knowing this, its amazing the Jayhawks were able to take 2 of those 3 games.
Opponent
KU NEP
Opp NEP
Diff
North Carolina Central
-6
0
-6
Manhattan
-3
-6
+3
Kentucky
-6
+7
-13
Chaminade
-8
-5
-3
Marquette
-8
0
-8
Tennessee
-10
+3
-13
TOTAL
-41
-1
-40
NEP means Net Extra Possessions
The silver lining is that KU should improve on this possession battle. Much of this can be attributed to effort and newcomers learning how they need to play. Valuing the basketball and hitting the glass is something that will be expected for those looking to earn minutes alongside the “big 4” of Harris, McCullar, Adams, and Dickinson (KU also needs more from Harris and Adams on this front). As long as KU continues to get good looks, and having Hunter is a large reason for that, they should be fine. In tonight’s tune-up against Eastern Illinois, KU needs to dominate the glass and turnover margin in order to prepare for Connecticut and other tough games that will come later in the year.
The 2023 version of the Champions Classic proved to be a classic, with a high-action, fast-paced game between the two winningest programs in college basketball history. In the end, our beloved Jayhawks prevailed, but not before giving up a 9-0 lead and being down as much as 14 in the second half.
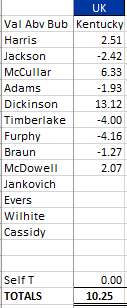
First things, first. Here are the PPGAB +/- scores from last night, and these will be referenced below. This was quite a game, as so much happened.
Game Notes:
Hunter Dickinson (27 points, 21 rebounds) became Kansas’ first 20/20 player since Thomas Robinson (2012 season vs. North Dakota) and the first to record 20 and 20 against a power conference opponent since Nick Collison (2003 season vs. Texas).
This milestone featuring traditional stats is paralleled by a team-best +13.12 value score. This value score is Dickinson’s second +10 game of the season (NCCU) and his second team-best game (Manhattan).
Dickinson’s value score was quite bad to begin the game, as the charting indicated he was responsible for 16 of Kentucky’s first 24 points due to sagging defense and over-helps (i.e. initiating late double-teams that allow for an easy escape pass). Over the rest of the game, he was not responsible for any more points allowed. It’s estimated that Dickinson’s opponent-adjusted value score over the final 26 minutes was better than +20.
As rare as Dickinson’s 20/20 milestone was, an even rarer event occurred with Kevin McCullar recording the program’s third official triple-double in its history. (This excludes the Chamberlain era, when certain stats weren’t officially kept). McCullar was the first Jayhawk to get the triple-double by registering 10+ assists, as the prior two (Cole Aldrich, Jeff Withey) did so with points, rebounds, and blocks.
McCullar’s 12 point, 10 rebound, 10 assist night was also bolstered by a stingy defensive effort. McCullar’s defensive PPGAB +/- of +5.41 is the most valuable defensive performance of any player in any game so far this season.
McCullar’s triple-double came in the last second of the game, literally, as he grabbed his 10th board following a missed 3-point shot from Kentucky.
The Kansas/Kentucky game was a high-paced game, with 81 recorded possessions from Charting the Hawks. KenPom’s box score shows 83, and his line score shows 80. Either way, the fast tempo allowed more possessions which in turn allowed more opportunities for Dickinson and McCullar to record their milestone nights.
KU is currently the fastest-paced team in KenPom, with an adjusted tempo score of 77.2. In the Self-era, KU’s highest rank on the tempo metric is 40th (2004), and the Jayhawks have only been above 70.0 in terms of adjusted tempo 2 times in 20 seasons under Self.
Not to be overlooked, Dajuan Harris scored a career high 23 points on 5/6 shooting from 3 (with his only miss being a desperation heave following a broken play with the shot clock expiring). Harris graded out as KU’s second-best offensive player against Kentucky.
This is in stark contrast to Harris’ point output in the team’s prior 2 games. Against North Carolina Central, Harris didn’t take a shot from the field or line, and against Manhattan he scored only 2 points on 1-4 shooting. Yet when Kentucky went under screens or put help defenders on the likes of Hunter Dickinson, Harris was there to make them pay by his ability to score.
Defensively, Harris’ game was not his sharpest. He went under multiple screens leading to easy Kentucky 3-point opportunities and gave the Wildcats some run-out layups by careless live-ball turnovers. In all, he was responsible for 19 Kentucky points and graded out as the second-worst defender for Kansas in the game, slightly ahead of K.J. Adams.
Speaking of K.J. Adams, the junior continued his explosive scoring with a 16 point outing on 8-11 shooting. While not a shooter, he scores off of cuts, lobs, and put backs better than almost anyone I’ve seen. Adams also added 3 assists.
Adams’ defense was the team’s worst, and he fouled out with under 4 minutes to play from a careless loose-ball foul, gifting Kentucky 2 free throws.
Freshman Jamari McDowell was Adams’ replacement, despite not playing during the first 36:14 of the game. McDowell would play the final 3:46, during which KU would go on a 14-3 run to win.
McDowell didn’t allow a point to an explosive Kentucky offense, continuing his streak this season. In nearly 17 1/2 minutes of play, McDowell has not allowed his opponent to score.
McDowell also put the finishing touches on the win, grabbing a rebound following a 3-point miss that, had it gone in, would have tied the game for Kentucky. After being immediately fouled, McDowell calmly made both free throws to set the final margin of 5.
In the first 3 minutes and final 3 minutes of the game, KU outscored UK 20-1. The Cats were 14 points better during the middle 34.
Kentucky shot 38 3 point shots, equaling the total of FG attempts they had inside the arc. The team from Lexington was 9-18 to begin the game, allowing them to first come back from 9-0 and then take the lead. However, they would cool off considerably, hitting only 3 3-pointers in the second half (none after the 8:00 mark), and finish 12-38 for the game. This works out to 31.6%, which is worse than the 33.3% the Jayhawks shot (6-18).
Freshmen reserve guards Shepperd and Dillingham went 7-9 from 3 for the Wildcats. The rest of the team, including Antonio Reeves, went 5-29 (Reeves 3-17). When Kentucky was making its 3’s, it looked unbeatable. It was running, hustling for loose balls, and scoring in spurts. But this pace, which helped Kentucky build up a 14 point lead, allowed Kansas to come back once the shots stopped falling.
The 2024 Kansas Jayhawks were 23-11 (10-8) and earned a 4-seed in the NCAA Tournament. They made the Round of 32 in the NCAA Tournament before losing. The team’s Sports Reference page is here.
Offense
Defense
Total Adjusted PPGAB +/-
Value Seen 4 Ways
Cumulative Points Above Bubble on the Season Chart
Summary
KU’s big 3 of McCullar, Adams, and Dickinson accounted for 100.1% of the team’s WAR this season, making it the first time since at least 1993 where a Kansas team had its three best players be over 100% of total WAR.
Similarly, KU only has 3 rotation players (10%+ minutes played) with a positive value-score. This was the fewest above-bubble players on any KU team since 1993 (2017 had 4). On average, KU has 6.1 rotation players per season achieve a positive, or above-bubble, value.
The above waterfall chart does a great job showing where KU was getting its value from and where it was losing its value. This chart makes those who blame K.J. Adams or Hunter Dickinson look silly. The team’s struggles stemmed from Elmarko Jackson, Nick Timberlake, Parker Braun, and Jamari McDowell. Harris and Furphy, slightly sub-bubble, were overused due to the team’s lack of depth but still basically KU-level rotation guys.
To Harris’s credit, he did play better in higher-leverage game (positive 0.53 POCWAB).
The following players accounted for team-MVP games: K.J. Adams (11), Hunter Dickinson (9), Kevin McCullar (7), Dajuan Harris (3), Johnny Furphy (2), and Nicolas Timberlake (2).
KU’s average game-score at home (+8.34) was far superior to its average game-score in true road games (-0.59).
The injury to Kevin McCullar hurt the Jayhawks. Kansas was a +5.51 team in games where Kevin McCullar played, and -2.39 team in games where he did not (8 total games missed).
In a similar vein, KU was a +5.35 team through the Iowa State game. Kevin would miss the next game due to injury, while playing off-and-on and through pain some nights the rest of the season. In these final fourteen games, KU was a +1.23 team.
The recent 2024 player projection write-up has KU with an average game score of +8.51. This correlates to a 2-seed on average. This post will look at KU’2 2024 season from a median, worst case, and best case scenario.
Median
The median scenario sees the Jayhawks with a +8.51 average score and 2-seed and was the scenario predicted in the link above. In this scenario, KU uses a strong starting 5 and solid 6th man to find success amidst a difficult schedule. The median projection views KU’s offense being dependent on Hunter Dickinson to score and create. Among the 9 rotation players, only Dickinson and fellow transfer Nicolas Timberlake are expected to be better offensive players than defensive players. So while questions about outside shooting and guard isolation scoring will come up during the season, this will be balanced by excellent guard/wing defense from the likes of Dajuan Harris, Kevin McCullar, and K.J. Adams.
Projecting NCAA Tournament results are difficult due to the single-elimination format, but as a 2-seed KU would have a good shot of getting out of the first weekend. The median scenario would see this team as an Elite 8/Sweet 16 team most often, with still an outside shot of making a Final Four. If this were a betting website, the over/under for tournament wins would likely be 2.5.
Worst Case
The worst case scenario implies a reasonable worst case scenario (KU could lose its starting 5 to season-ending injuries, but this is very unlikely). In this scenario, one of its key players struggles with an injury and this weakens an already depleted roster. KU’s offense could also struggle as teams force McCullar and Adams to make jump-shots while forcing the ball out of Dickinson’s hands. On defense, while it’s difficult to see KU being bad on this end, teams could put Dickinson in high-ball pick-n-rolls and take advantage of Self’s propensity to switch screens.
If KU were to struggle enough, it could lose games it was projected to win preseason and find itself slipping down into the 5-6 seed range. In this range, a First Round upset loss is more likely and a second-weekend in the NCAA’s less likely. For KU’s worst case scenario to be a comfortable NCAA Tournament team is something most teams can’t say a few weeks before the season starts.
Best Case
The best case scenario is the most fun to think about. Again, this is a reasonable projection. We aren’t expecting KU’s three true freshmen to all play as 2024 lottery picks or for Timberlake to average 25 points per game. But we do see a situation in which Hunter Dickinson’s numerous offensive skills lift the games of other around him. We do see a reasonable chance for KU’s defense to work together so well it takes care of potential problems from a few of its weaker links, and becomes the best defense in the country. Shooting improvements from McCullar and Adams can make a difference in key situations. We aren’t projecting all of these things, but there is a chance things can work out well.
In this scenario, KU earns a 1-seed for the third consecutive year. Assuming Coach Self can stay healthy and KU’s draw isn’t as tough as last season’s, a run to the Final Four and beyond is certainly within reach. The average 1-seed wins about 3.4 games per tournament (since 1985), so an over/under of 3.5 wins would be a reasonable line. Winning the National Championship can be a goal for this team.