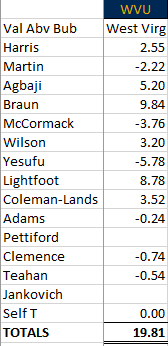
Remy Martin now has 3 team-MVP’s, continuing his hot streak in March
Game Summary:
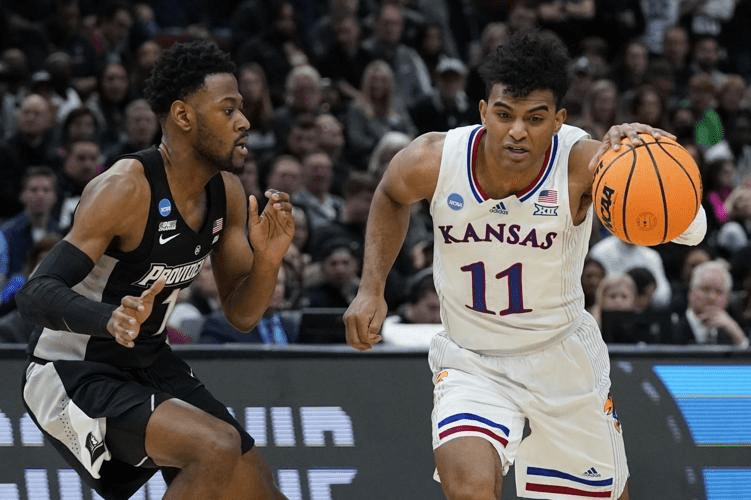
It was KU’s defense, not its offense, which carried it for most of the game. But when Providence made a run to take the lead, the Hawks got huge buckets from Jalen Wilson and Christian Braun.
Remy Martin was the team’s MVP, producing over 23 points while giving up only 9. On an opponent-adjusted basis, his game against Providence has been his best in the season. In his last five games, he is averaging +5.72 points of value above bubble per game. He has been Remy Marchtin for sure.
Dejuan Harris deserves a shout-out here, specifically because he will be overlooked. He finished with 6 points and 2 assists while only giving up a junk bucket late. He started out each half well, only to come out to allow Remy to enter. On defense, he forced 2 turnovers and played pesky defense all night.
Other positives were Jalen Wilson and Christian Braun. Wilson racked up 14 rebounds once you factor in the dead-ball rebounds that he won possession of. He scored 16 points, most of them unassisted, on a night where KU’s two leading scorers didn’t have great offensive outings. CB, KU’s #2 scorer on the year, did add value thanks to solid defense and rebounding. Even when he doesn’t have his best game on offense, Braun plays so consistently on defense that he rarely gets outplayed. After giving up a layup on a back-cut (which gave Providence its only lead 48-47), CB added almost 4 points of value over the final 5 1/2 minutes, with no negative plays. He made his only shot, won 4 defensive rebounds, had an assist on Ochai’s dunk, and didn’t turn it over.
On the negative side, Lightfoot made some nice defensive plays but also found himself giving up size inside. He did make a basket in the second-half after a dime by Remy Martin. Ochai Agbaji struggled to get clean looks. He had a great defensive outing in the first half, but his second period was marred by lapses on jump-shooters. David McCormack struggled on both ends, and his 8 points scored was overshadowed by his 13 points allowed. He also rebounded poorly for the amount of time he played.
Last, Jalen Coleman-Lands played nearly 4 minutes and didn’t record a stat. He played solid defense to not give up a bucket.
The TEAM had a score of +6.14, which is its second game in a row below the +10 mark (KU reached that milestone in 4 consecutive games before Creighton). To get through Miami, KU will need a game score of +2 or better. What this means is that Miami is about 2 points a game better than a bubble-team.
After an inconsistent year on the defensive side of the ball, KU has produced 6 out of 7 solid defensive outings down the stretch. KU will want its offense to be much better on Sunday afternoon, but thankfully the Hawks have not had two below-bubble team offensive games in a row this season.
CB had his 10th team MVP of the season thanks to solid play on both ends
Game Summary:
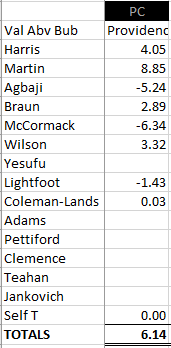
With about 10 seconds to go in KU’s 79-72 win over Creighton, Christian Braun switched onto Blue Jay point guard Trey Alexander. With the game only being decided a few plays earlier, Braun mirrored Alexander’s moves as he attempted to take it toward the basket. After being cut off, Alexander pulled up from about 15′, looking to shoot a jump-shot. Braun mirrored that, too, getting an arm out to bother the would-be shot so much that Alexander decided to pass the ball at the last instance to avoid getting his shot swatted. But that proved unfruitful, as the pass did not connect and would result in a Creighton turnover. From there, all KU had to do was inbound and dribble out the clock.
This play was emblematic of Braun’s defense all game. No matter who he switched onto, he had the ability to defend that opponent. Another crucial play happened at the 3:28 mark of the second half. Creighton’s Arthur Kaluma had a game-high 24 points, but none of them were against CB. He did attempt to hit a mid-range jumper over Braun, but saw it get blocked straight over his head. In Braun’s 38 minutes of play, he only gave up 4 points on defense. Combined with an efficient offensive outing (1.29 PPP_af, 13 points, 4 assists), and he was nearly 10 points better than a bubble-level player.
Ochai Agbaji’s offense has noticeably dipped in recent weeks. But he turned up his defensive efforts on Saturday, only allowing 6 points on defense to go along with 5 rebounds, 2 steals, and 1 blocked shot. KU doesn’t win without either player.
Remy Martin was KU’s best offensive weapon against Creighton, scoring 20 points with a PPP_af of 1.24. And while he gave up 16 points, it wasn’t due to effort but due to Creighton making some deep 3’s over his short frame. This also shouldn’t be overlooked: Remy’s ability to generate offense allows guys like Braun, Agbaji, and Wilson to put more effort into making defensive stands and getting rebounds off misses on either end.
Jalen Coleman-Lands showed why he has been a better option off the bench than Joe Yesufu, first grabbing a miss and putting it back in the first-half and then hitting a second-half 3. His defense, while not great vs. Creighton, has been replacement-level for the year.
Jalen Wilson finished with 14 points and 14 rebounds, and a positive contribution despite some defensive lapses.
On the negative side: Mitch Lightfoot gave up a bad offensive rebound which resulted in a kick-out 3, David McCormack had trouble guarding the 3-point line and struggled to score like he normally does, Dejuan Harris got outplayed, K.J. Adams missed his only shot attempt, and Yesufu fouled a jump-shooter while turning it over twice.
The TEAM score of +6.83 was good enough to get the win. KU played down to Creighton’s level for most of the game, not putting away a scrappy team who was down to a 6-man rotation following key injuries. But in the end it was enough to win.
Remy Martin had his first team-MVP of the season, sparking KU to a Big 12 Tournament Championship
Game Summary:
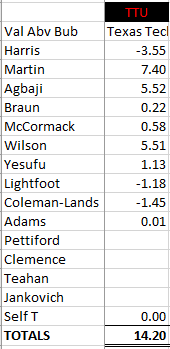
Kansas took home the Big 12 Tournament with three great team outings. On Saturday, it was Remy Martin off the bench (12 points, 3 assists, 4 rebounds) who led the team in value. For the tournament, Ochai Agbaji was the best Jayhawk (+6.16 per game average). Mitch Lightfoot was also very good over the course of the three games (+4.64 per game).
Ochai’s emphatic dunk was part of a team-high 11th MVP game of the season.
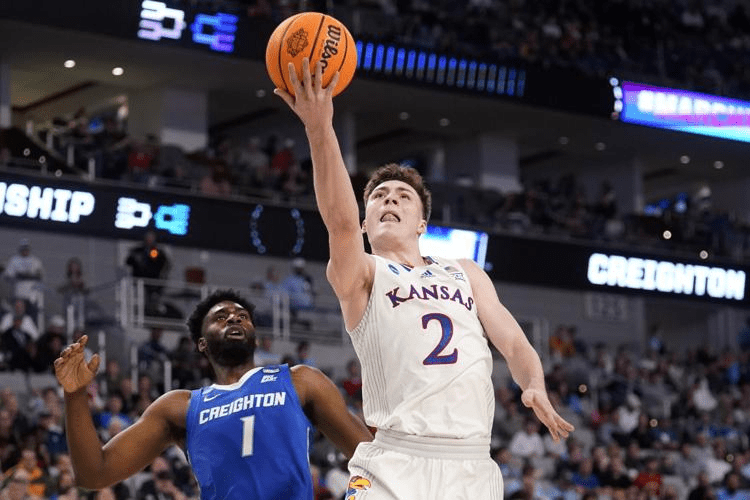
Game Summary:
KU took the rubber match against TCU thanks to outstanding efforts from Ochai Agbaji and Mitch Lightfoot. Remy Martin had his best game in a few months, finishing with 10 points and 3 assists. Joe Yesufu got back on the positive side of the ledger with 3 points and 2 assists (with no misses or turnovers). Christian Braun struggled to finish but had a solid defensive outing to add net value.
KU will play for the Big 12 championship on Saturday.
CB earned his 9th team-MVP of the season, thanks to a balanced performance.
Game Summary:
KU won its quarterfinal match-up with solid performances from Christian Braun, Mitch Lightfoot, Ochai Agbaji, Jalen Coleman-Lands, Jalen Wilson, and Dejuan Harris. The team will play again tomorrow night against TCU.
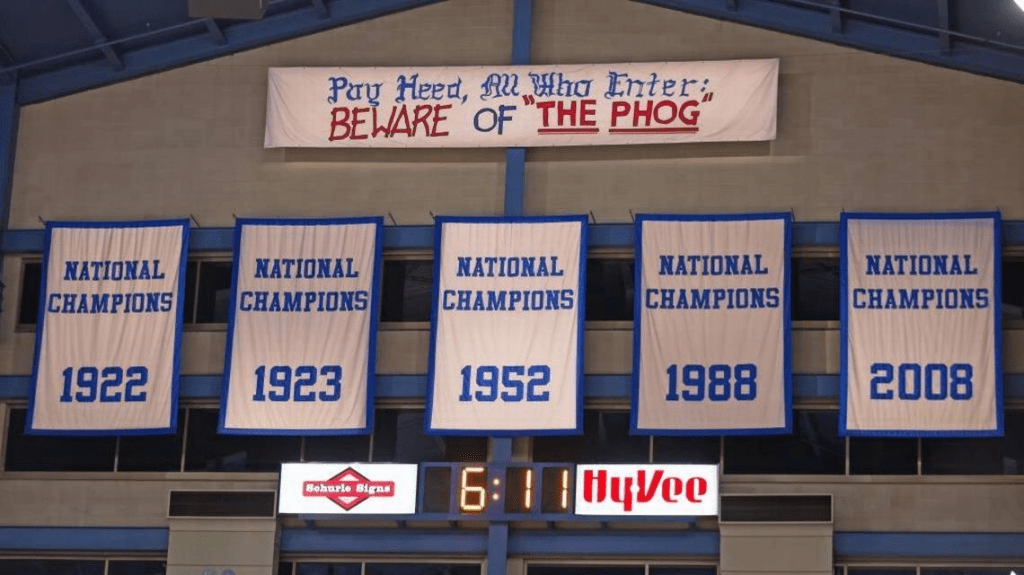
In the Bill Self era, KU famously has as many home losses as conference championships. No team has won more than twice against Self at home, and many fans can recall each loss Self has had in the Fieldhouse from memory.
Just how good is Kansas at home? Since the 2010 season, the Hawks have complied a 197-10 record at Allen Fieldhouse. This is obviously amazing when compared to other programs, but how much of this record is due to the talent and coaching on Kansas, not the building? After all, Kansas is 77-36 (.681) in conference road games since the 2010 season. So perhaps the mystique of Allen Fieldhouse is merely just Kansas’s sustained talent alongside a home court advantage common across college basketball. If you shipped the talent Kansas has had over the years to Bloomington or Storrs or Baton Rouge, would you see similar home court records at Indiana, Connecticut, or LSU? Or if Allen Fieldhouse really is special in its ability to deliver wins, how can this be quantified?
The answer comes from predictive analytics. We’ll use Ken Pomeroy’s predictions, since they are the most famous in college basketball and tend to be the most accurate.
Pomeroy’s website contains a treasure trove of statistical information, but more than this, his system also attempts to most closely predict the final margins and winners of college basketball games. His background in meteorology has helped him forecast college basketball results with accuracy. The point is that his predictions can be used as a serious, accurate, objective standard.
One feature Pomeroy includes is home-court advantage. On his website, he notes that his is calculated by taking the last 60 home and road conference games, and finding the difference. KU’s home-court advantage is well-above average, but not close to the top (37h) at 3.8 points per game. If we were to conclude from this rating alone, we’d have to place Allen Fieldhouse not even in the top half of the Big 12, as Kansas St., Oklahoma, TCU, Iowa St., Texas Tech, and West Virginia all have better home-court advantage scores.
But I don’t see this stat as being indicative of home court advantage alone. In fact, it is just as likely to be a measure of poor road performance. The poorer a team does on the road, the better its home performances look by comparison. As mentioned above, KU has won over 2/3 of its conference road games since 2010. We don’t want to unjustly count KU’s road performances against it when assessing Allen Fieldhouse as a home court advantage.
Not Points, But Wins
Point differential and wins are two separate things. The two are interrelated, but the statement we intuitively know is true and want to show mathematically is not that Allen Fieldhouse produces large point differentials for KU (although it does do that often), but instead that it produces wins for KU.
Up to this point, we’ve established that Pomeroy makes accurate and objective predictions. Pomeroy’s system is a computer algorithm; it’s based on trends and correlations from large data sets. There are no biases; the computer doesn’t care which team name is which to next point total number. Pomeroy is using game data from all 350+ teams to make his predictions, making the model applicable across all of D-1 basketball. He also tests his predictions to ensure accuracy.
For instance, let’s say KenPom has a game where Team A is favored to win over Team B and is given an 80% chance of winning. Team A is expected to win, but if Team B won it would be a mild upset since this result would be expected to occur 1/5 of the time. Over the course of a season, or multiple seasons, we can test all games which featured one team with an estimated winning percentage around 80%. If the actual results of this collection of games turn out to be wins for the favorites about 80% of the time, then we know the prediction system is fairly well-tuned. If the results are off by some factor (perhaps these favorites won 70% or 90%), tweaks need to be made somewhere. This ability to fine-tune the model leads it to be more accurate, which makes it trustworthy. And this is in fact what Pomeroy does.
This is just the system we need to test Allen Fieldhouse. Note that in Pomeroy’s system, KU’s inherent skill level is accounted for. His predictions consider the talent of the players and level of coaching. Also, whatever amount of point value inherent to Allen Fieldhouse is also factored in. What we should be left with is a purely unbiased and accurate gauge of how much Allen Fieldhouse helps KU in terms of wins.
To test this, we will take each Kansas home game and the predicted win percentage at the time, and then compare to the results of what actually happened. Pomeroy’s site began offering probability predictions for the 2010 season, so we will begin here and go through 2022. For instance, KU’s first home game of the 2010 season was against Hofstra, in which the Jayhawks had a 98.7% chance of winning. KU did end up winning, so, it earned 1 – 0.987 = +0.013 Wins above Expectation (WAE).
As we continue this exercise for each game played over that period, we should expect the WAE to be around 0.000. Remember that the skill level of Kansas and home court advantage has already been built into the predictions. Remember also that Pomeroy tests his estimated win percentages, so we should be getting accurate prediction ratings for a team with the skill level of Kansas and a generic home court advantage. Anything substantially more or less than 0.000 needs explanation.
For KU, they have a WAE at Allen Fieldhouse since 2010 of, drum roll, +15.50. With a population of 13 seasons this is at a rate of over 1 more expected win per season. It’s difficult to stress how ridiculous this level of winning is. Instead of being 197-10, a team as good as KU has been against the same quality of opponents KU faced on the parameters of a normal home court would have an expected home record of 181-26. This is the difference between a 95.2% winning percentage and 87.7%, not a slight difference. Using Odds Ratio, Allen Fieldhouse has produced 2.77 times better results than expected.
Looking at each year individually, we see that only in 2018 (14-3 record) did KU have a negative WAE. Every other season was above expectation. 2018 was also the only season that KU lost more than 1 home game over this span.
We can also test how likely it is for KU to have an undefeated home record given its opponents. Since 2010, KU has had undefeated home seasons in the following: 2010, 2012, 2015, 2016, 2019. 5 seasons out of 12 isn’t bad; but how many would we expect KU to have?
Using similar methods, we can calculate the independent probabilities of an undefeated season for each season, and then add the results to see how many we would expect. For instance, for 2010 we’d predict that Kansas has a 38.5% chance of going undefeated. Since it did go undefeated at home that season, the 2010 team earned 1 – 0.385 = +0.615 Undefeated Seasons above Expectation (USAE). After calculating all years 2010-2022, we come up with an expected 1.749 undefeated seasons, or a +3.251 USAE. Note that even 2 undefeated home seasons would be above expectation, since over the course of 15, 16, or 17 games the math says that you should trip up at least once. But KU has managed to avoid defeat at home in five of these seasons.
Testing the Results
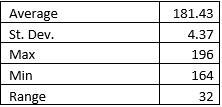
The first way to test these results is to run a simulation to see how frequently KU finishes with a WAE of +15.50. A quick simulator on Excel was built, and 10,000 sims were run. Here are the results, in terms of wins (out of 207 games played):
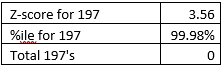
As you can see, assuming a random distribution of performances in terms of win/loss, the maximum number of wins KU achieved was 196 under 10,000 simulations. This is actually fewer than the total of home games KU actually won in this span. Looking at the 197-win mark, we can calculate how statistically rare such a feat is:
The z-score counts standard deviations, so 197 wins is 3.56 standard deviations above average. This works out to a 99.98 percentile. Out of 10,000 simulations, not once did KU reach the 197 wins at home. Given the distribution, we’d expect them to reach this win total once out of 5,453 simulations, which is a bit more common than 0 out of 10,000 but still a rare instance. KU’s success at Allen Fieldhouse has been off-the-charts.
Further Study
If anything, these numbers are undersold. Remember KU went undefeated in 2009 and 2008. If we stretched it back to the 2004 season, the first year of the Self-era, Kansas would be at 255 wins to 16 defeats, a slightly lower winning percentage but an overall larger population of games. The z-score might move even further right.
(Although we don’t have KenPom pregame win probabilities for these seasons, they can be reasonably estimated given opponent quality. It would take more work, and they wouldn’t be as precise as what a predictive model would have estimated. We will keep the (real) results for now, with the option of adding seasons 2004-2009 as an amendment so that the entire Self-era is captured).
A Free Lunch, Taking KU at Allen Fieldhouse on the Money Line
Outperforming an accurate and fine-tuned prediction model is noteworthy enough, but certainly Vegas would be tough to beat. After all, after years and years of KU winning such a high percentage of its home games, shouldn’t the betting market reflect the magic of the Phog?
It turns out the answer has been no. We won’t bury the lead on this section. You were guaranteed to win money if you bet a consistent amount money on KU to win each of its home games over any part of the past 15 seasons. Read that again. You could have started this strategy the first game of the 2008 season, or even for the Kentucky game this season that KU ended up losing. Bet a consistent amount on the Money line for KU to win outright and you will end up in the black.
KU has been 234-10 in AFH since the 2008 season (so games beginning in November 2007). Let’s set a consistent betting amount of $10. So, regardless of opponent or history, the strategy is to bet $10 on Kansas to WIN straight up on a Money Line bet.
Not all KU home games have had a Money Line, at least according to the archives. The first game in this span I could find that had a Money Line was KU’s November 2007 game against Northern Arizona, at -10000. Betting $10 would have netted you $0.10 for the KU win that game. Fast-forwarding to today, if you had kept at this strategy, you’d have $183.07, an increase 18x your initial investment.
To compare the increase of the S&P 500 over that period, if you started with $10 and let it sit in the market, you’d have about $30 today. Betting on KU to win at Allen Fieldhouse has proven to be a better long-term investment than the stock market. Anyone with a background in finance or betting markets knows how absurd this is.
Another way to look at this is to see how much the market would have to move on these games to make it efficient. In order for a better to have exactly $10 after betting $10 on each of these games, the Money Lines would have to collectively move 2.87 times what they were (so if KU was -10000, it’d have to be -28000; if KU was -275 it’d have to be -789, etc.).
Other Questions for Future Analysis
Switching gears some, it would be good to see how well other home courts do at converting wins. Clearly some teams will see better win/loss results than expected at home than other teams, this is the nature of statistics. But how well do other bluebloods, such as Kentucky and Duke perform? What about teams like Purdue; exactly how many wins has Mackey Arena been worth? Or is Hilton Magic real? Remember, since a team’s skill has already been factored into the pregame predictions, we should get apples to apples comparison regarding home arenas only, since team skill differential has been accounted for. The problem is that this data must be scraped, so it makes it time-consuming to try and build up any dataset. Maybe it would be prudent to start with a few big schools (Duke) and go from there? But there’s no way to avoid missing whatever home court has been the biggest advantage in terms of win/loss without running through every team, since that’s the very thing we’re looking for!
Conclusion
Allen Fieldhouse was worth over 15 wins over the course of the 2010-2022 seasons, propelling KU to an absurd 197-10 during this time. The chances this would occur by pure luck alone are at best 1/5000, indicating that something has happened in that building (crowd support for KU players lifting them up, opponents feeling pressure, refs being affected by the crowd, etc.) to get the team wins it otherwise wouldn’t have gotten. Whatever the reason, you can conclude this. Until proven otherwise, Allen Fieldhouse is the biggest homecourt advantage in college basketball and probably in all of sports. A 3.56 Z-score and 99.98 percentile is very unlikely to have been matched by any other arena during the past 13 seasons.
Christian Braun about to finish on an and-one. He earned his 8th team-MVP thanks to excellent defense on Saturday.
Game Summary:
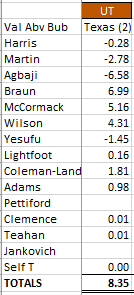
Kansas won a defensive slugfest on Senior Day, and it was Christian Braun who played the best defense of anyone. He only gave up 3 points, while filling up the box score with a steal, a block, and multiple rebounds. The best offensive players for Kansas were David McCormack (1.34 PPP_af) and Jalen Wilson (1.80 PPP_af). They each got big buckets and made clutch free throws when points were limited.
Seniors Jalen Coleman-Lands and Mitch Lightfoot each had positive performances as well. Although there were only 4 points between the two of them, they each defended well. K.J. Adams had an offensive rebound and 1/2 FT to add nearly a point of value after adjustments. Neither Zach Clemence nor Chris Teahan recorded a stat in their few minutes of play.
Dejuan Harris had a neutral game characterized by excellent defensive plays (blocks, steals), some great passing (had 5 of KU’s 10 charted assists with 0 turnovers); on the other hand he only scored 3 points and did give up some easy baskets due to his slight frame. Remy Martin had good activity on offense to start, but lost his man a few times and gave up Texas’ first 5 points. Joe Yesufu didn’t do much in his few minutes of play.
Ochai Agbaji is officially slumping, as he recorded his third consecutive negative-value game. He seems to be pressing, forcing bad shots on offense while reverting to forgetful moments on D. He’s now down to 41.1% from 3 on the year. On the plus side, he is rebounding better than he did to start the year. This shows he is playing hard. Once the shots start to fall again, he will be someone who can carry this team far in the Tournament.
The TEAM score was helped by KU getting to overtime. But its still indicative of the Agbaji slump. Thankfully; Braun, Wilson, and McCormack all had solid outings to help get KU a win for the 39th consecutive Senior Day/Night game.
There are multiple ways a player can add value to his team in a basketball game. Attempting to capture these different ways quantitatively can be difficult. If you look at an advanced season box score, you’ll notice that most of the stats are listed in rates instead of totals or per game.
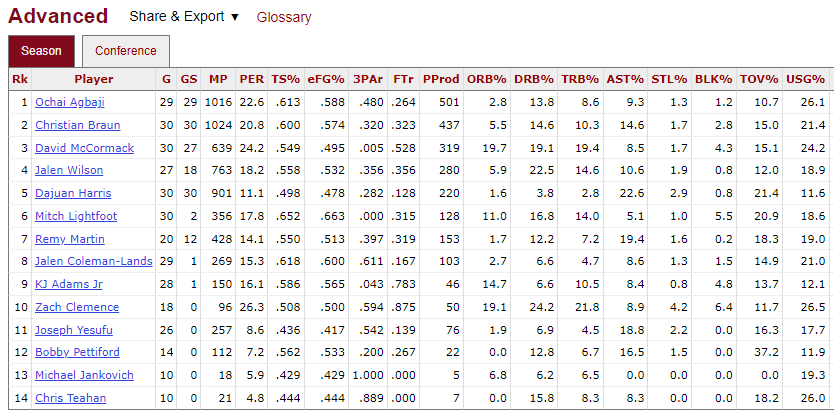
College Basketball Reference, 2022 Kansas Jayhawks through 30 games
So let’s take two players and compare them, Ochai Agbaji and Christian Braun. They have similar minutes played, PER, and TS%. As we continue to move left to right, we see that Och’s 3-pt. attempt rate is much higher, although CB gets to the line more (FT rate). Agbaji is credited with more points produced, CB is a better rebounder on both ends, a better assister, and also gets a higher proportion of steals and blocks. Ochai has a lower turnover percentage, and a higher usage.
These numbers are all wonderful to have, and do tell us quite a bit. They are also a mess to organize and make sense of. For instance, PER (Player Efficiency Rating) rates how efficient players are, with higher been better. It takes into account all offensive stats.
Notice we see that David McCormack is leading in this category. This may be surprising, but remember he shoots FT’s quite well and also grabs a ton of offensive rebounds. His turnover rate is also fairly low. Still, we see he is shooting worse than players like Agbaji and Braun, and has a far lower assist rate than the guards.
What if we wanted to compare D-Mac’s offensive rebounding rate (which is very high) to a guard’s assist rate? In other words, is he adding more or less value through his rebounds than Dejuan Harris is through his assist? You can’t look at the raw numbers, because they are measuring two different skills. But certainly there is a way to see this.
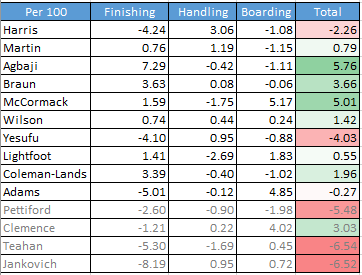
Represented below is the attempt to do just that. Breaking down offense, we’ve organized all offensive plays into one of three categories: Finishing, Handling, and Boarding.
Finishing – This measures how well and frequently a player scores. It takes into account his shooting percentage and volume, as well as if the play was assisted or not. It includes measurements of both production and efficiency.
Handling – This measures how well a player takes care of the ball and distributes it. It uses assists and turnovers to drive the result.
Boarding – This looks primarily at offensive rebounding, the main driver in a team getting second-chance opportunities. It also includes the occasional “save” which rescues a team’s offensive possession following a teammate’s poor pass that should have resulted in a turnover.
This chart is represented in Points Above Bubble, the value currency most frequently used on this website. This chart is showing PAB per 100 possessions, so it ignores any value related to endurance/stamina/etc. and purely rates each player on the same possession basis. There are a few interesting results:
The best offensive skill set for KU this season has been Agbaji’s ability to score (Finishing). He is shooting 42.2% from 3, and also has a 61.3% TS% (using Sports Reference’s calculations). In all, he is adding 7.29 Points above bubble over the course of 100 possessions (PAB/100) due to his ability to score.
The second-best offensive skill set for KU this season is David McCormack’s offensive rebounding. He is adding 5.17 PAB/100 just from his ability to get second and third-chance opportunities. And while some may wish to discount his rebounding ability by claiming it is due to poor shooting (“he just gets his own misses”), this doesn’t look to be too true as he has a Finishing score of +1.59. When D-Mac is out there, he is the team’s second-best offensive weapon.
The best at “Handling,” which is basically maximizing assists and minimizing turnovers, is Dejuan Harris. At +3.06, is far better at the true point guard skills than other guards. But notice even despite his strong Handling score, his lack of Finishing and Boarding makes his offensive value below bubble-player level on offense.
These numbers are not position-adjusted. So we expect to see the guards with positive Handling numbers but negative Boarding numbers, and the posts to have negative Handling numbers but positive Boarding numbers. But take a look at K.J. Adams. A solid offensive rebounder, K.J. has also done a decent job handling the ball for a 4/5 man. It is his scoring (Finishing) which has made his score so low.
In summary, different players will bring different things to the table. For KU’s offense in 2022, they are getting great scoring marks from Agbaji, Braun, and even Coleman-Lands. Harris is the best ball-handler, although the other point guards add some value here. And inside, David McCormack and K.J. Adams are beasts at winning additional opportunities. Jalen Wilson is positive in all features, being balanced at finishing, handling, and boarding.
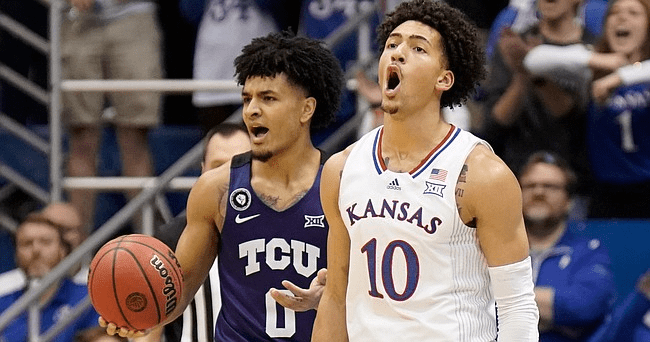
Jalen Wilson played fine defense to earn his 5th team-MVP game of the season
Game Summary:
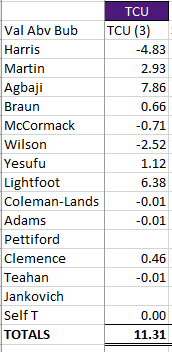
KU struggled to put TCU away, but ultimately prevailed thanks to a late defensive stop (Dejuan Harris block). Jalen Wilson was the team’s best player, only allowing 7 points on defense while grabbing 9 defensive rebounds and forcing 3 TCU turnovers (1 live-ball steal, 2 dead-ball). This defensive effort overshadowed a quiet offensive night, as he only took 12.6% of his team’s shots while in the game. He did produce over 10 points of offense on an efficient 1.94 points per possession used.
Dejuan Harris had his best game in some time, scoring 11 with 4 assists on 1.30 points per possession used. He also played solid defense, giving up 9 points but also coming away with a key block on TCU’s Miles with 4 seconds to play. Had TCU converted it would have been a 1 point game, but the block sealed KU’s win. Christian Braun was efficient on offense (1.95 points per possession) to earn a quiet, but positive, value score. Mitch Lightfoot and Zach Clemence were both basically neutral players.
On the negative side of the ledger, Ochai Agbaji turned a solid first-half into another high-volume shot-output game which harmed his team’s chances. The 22 points were good, but he had 11 misses and 3 turnovers to get those points. His 0.84 points per possession used was well below the team’s 1.07 for the game. Defensively, he allowed 13 points, the most of any Jayhawk last night.
David McCormack didn’t shoot well from the field, but was solid again from the FT line. He did give up some baskets inside, which cost him. Joseph Yesufu had a poor shooting outing, as did Remy Martin in limited playing time. Jalen Coleman-Lands had a few nice hustle rebounds, but gave up one basket while missing his only shot attempt. K.J. Adams’ only impact was fouling a 3-point shooter to allow TCU to cut a 6-point deficit to 3.
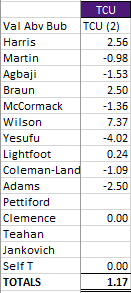
The TEAM score of +1.17 was KU’s third-consecutive game under +3. Based on opponent, location, and pace; KU’s offense did slightly better than its defense did; but both sides of the ball showed a mediocre performance for a team of KU’s caliber.
Since beginning to chart KU games during the 2019 season, it’s become clear that without seeing the full picture that the defensive stats (such as points allowed) provide, it becomes difficult to truly see the impact of particular players.
There are a few axioms for charting basketball stats that this website follows, including:
Offense and defense are equally valuable. Teams will have an equal number of offensive and defensive possessions.
Offensive and defensive rebounds are of equal value, because getting a defensive rebound is merely preventing your opponent from grabbing an offensive rebound themselves.
An offensive rebound neutralizes a missed shot. If someone rebounds his own miss, and puts it back in, it neither adds nor takes away value than if he’d made the initial shot.
Similarly a turnover and forced turnover are equally inverse. If a player has 3 turnovers on offense but forces 3 turnovers on defense, he’s had a neutral game in this regard.
Similarly all misses are equal. Whether or not an offensive rebound occurs is up to the hustle of the players on the court (including the shooter).
There are three aspects to scoring: setting up the score, positioning the score, and finishing the score. To relate this to an assisted basket, the assist man sets up the basket with a nice pass, the man who scores must get himself ready to catch the pass, and in turn that same player must have the ability to score by making the shot. With an unassisted basket, the first part of the score (the set up) is not done through a pass but through some type of agile move by the scorer.
The whole point is that there is a systematic way of assessing player value here that avoids bias and selective memory. Now this system also discounts clutchness, or the ability to play well in high-leverage situations. Unlike many in advanced statistics, Charting the Hawks doesn’t disagree that clutchness exists. It almost certainly does. But there are other reasons to discount it for our purposes that we don’t need to get into.
Having said that, and this isn’t to pick on anyone else, but it’s tough not to notice how bias and selective memory pervades the minds of fans and pundits alike. After each game, this website rates the game performance of each Jayhawk (using Adj. PPG +/-). It doesn’t just rank each player, but actually tells you how well or poorly a Jayhawk did in that game as compared to a hypothetical KU-level replacement player (i.e. “bubble” player).
Of course, there are other sites that do the same, albeit without any system. This ends up getting them into trouble. Matt Tait of the Lawrence Journal World took over the Keegan Ratings after longtime LJW Sports Editor Tom Keegan left the paper. It is now called the Kusports.com ratings, although the rankings are based the same as Keegan’s were before. The rater makes his subjective analysis of who played well and who didn’t, then ranks them from best to worst for each game. These ratings are then accumulated for the total season.
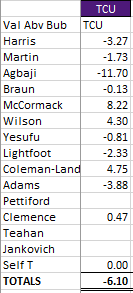
Last night’s loss to TCU was ugly to be sure, but rating Zach Clemence as KU’s most effective Jayhawk was a bit far-fetched. Tait’s rankings are represented below, so that we can compare to what a more objective rating system would show. Here’s how Tait ranks them.
Zach Clemence
Jalen Wilson
Ochai Agbaji
Joe Yesufu
Christian Braun
Dejuan Harris, Jr.
Mitch Lightfoot
Jalen Coleman-Lands
Remy Martin
David McCormack
K.J. Adams
We won’t go through each player’s write-up, but considering that KU lost by 10 points (which isn’t great, but not the worst ever) and not 30+, it’s odd to think that each of the other 10 players who played more than 7 minutes had less of a positive effect than Clemence’s block and defensive rebound did in 26 seconds.
We will go through a few of the outrageous differences, however. Let’s start with CtH’s most valuable player in this game, David McCormack, who Tait ranks at #10!
CtH’s ranking of the 3/1 TCU game
McCormack had a score of +8.22, meaning that after factoring each made shot, missed shot, free throws, rebounds, steals, turnovers, forced turnovers, defensive possessions that did or did not lead to points, as well as minutes played; he was 8.22 points better than the average KU-level replacement 5-man would likely be. This may seem surprising on a night where he was 2-6 from the field; then again by selecting the stat 2-6 on FG’s, we’ve already biased the entirety of McCormack’s performance.
McCormack also went 7-9 on FT’s, to finish with 11 points. Given that he had 6 official offensive rebounds against 1 turnover, his offensive rating was 118.9 on Torvik with 32.2 usage. This is a very solid offensive outing. Note that this also ignores something the video shows, that McCormack hustled to recovery two loose balls on offense that would have been turnovers on bad passes from his teammates (at about the 18:06 mark and 6:52 mark of the 2H). All said, his activity winning possessions and FT shooting outdid the few missed layups he had in close.
Remembering missed layups is the perfect example of selective memory. Here’s Tait’s write-up that tells us more about Tait’s ability to rate players than McCormack’s actual performance on Tuesday:
McCormack never got going in this one, missing so many close-range shots and struggling to gain control of himself throughout. He finished with decent numbers — 13 points and 8 rebounds — but he played just 21 minutes and got so many of those rebounds by badly missing in close.
According to the official stats, McCormack missed 2 lay-ups in the game, one at the 17:57 mark and one at the 16:16 mark of the 2H. It’s tough to agree that D-Mac missed “so many” close-range shots. Now he did miss 2 jumpers inside 8 feet as well, but these were contested. Either way, that is what stuck in Tait’s mind the most, so that is why McCormack was seen as KU’s 10th best player out of 11.
Yet after discounting McCormack’s night, Tait realizes that 13 (actually 11) & 8 aren’t actually terrible. This is the first sign he is starting to come to terms with his own bias. Unfortunately, he doubles down and provides a few more throw away lines that attempt to justify his ranking but only show us his ignorance. Yes, McCormack’s 21 minutes were not as many as he’s had in prior games, but it’s tough to say that limited minutes should discount a player’s performance in your rankings when your top player is someone who played in 1 total possession the entire game.
Another canard is that McCormack’s high offensive rebounding rate is due to him missing close shots. I read/hear this so often, that I might go back through the game logs to see how frequently this actually occurs. For starters, it’s a way to discount the fact that David McCormack is leading the nation in offensive rebounding percentage (OR%), at 20.4%. In other words, he rebounds 1/5 of his team’s misses while he’s on the court.
Tait is appealing to this bit of conventional wisdom, however of his 6 offensive rebounds Tuesday night, only 1 was off his own miss. The other 5 were off a Jalen Wilson missed jumper (5:15 1H), a Dejuan Harris missed 3-pointer (17:58, 2H), a Jalen Wilson missed jumper after a block (15:06 2H), an Ochai Agbaji missed jumper (6:55 2H), and a Christian Braun missed layup that was blocked (5:58, 2H). The only rebound off his own miss came at the 5:06 mark of the 2H, and it was a miss on a post-up jumper. This rebound would lead to Jalen Wilson driving and getting fouled, proving further it added value to the possession.
Tait isn’t close to correct in what he’s saying. But even if he were, remember the axiom that an offensive rebound neutralizes the mal-value of a miss. Even if McCormack were blowing layups out of proportion, in getting back his misses he is not harming his team one bit since KU retains possession. His 112.2 ORtg (and 117.8 Conf ORtg) on KenPom agree here.
Another axiom is that all misses are equal, namely that it doesn’t matter if a possession ends in a missed layup or missed deep 3, the value of the possession is still 0 points. Let’s explain why that is. In basketball, teams are attempting to get the most efficient shot, which occurs closer to the rim than further from it. McCormack is the best on the team at getting close shots, using his size, length, and skill set to get a bulk of shots in close. Yes, him missing these shots is frustrating. But it is quantitatively no different than when some other Jayhawk misses a deep shot late in the possession because he isn’t large or skilled enough to get a close one in 30 seconds of the shot clock. Selective memory only recalls the missed bunnies he has; it discounts his ability to get so many close shots. And he still makes enough of them (while also shooting well from the line) to be a solid offensive contributor.
Tait also had this to say about McCormack:
Give him credit for fighting to get them back, but had it not been for a 7-of-9 night at the free throw line, McCormack’s numbers would’ve matched the way he looked in this one. It’s going to be real interesting to see how he looks against that big, athletic TCU front line in the rematch.
Tait does finally realize the value of winning offensive rebounds back, yet he unfortunately discounts the skill of shooting well from the line. 7/9 is 78%, which isn’t astronomically higher than his season percentage (70.8%) and his below his percentage from last season (79.8%). McCormack’s energy and hustle got him to the line, where he converted.
But it was interesting to see the last bit, the one praising TCU’s front line. TCU certainly dominated the Hawks on the glass, 47-35. McCormack’s countpart, Eddie Lampkin, had 9 rebounds (4 offensive). This would make it seem like McCormack was giving up more than he was scoring. However this was not the case at all.
Lampkin finished with only 2 points. Other interior players, including Xavier Cork (8 points), did have solid games. But this is where charting defensive plays helps. Without seeing how KU’s defensive possessions went, we are only left guessing as to how each player performed on defense. Let’s look back at Lampkin’s only bucket. It was early in the game, when he hit an elbow-jumper with 17:39 in the 1H. It occurred not when D-Mac was in the game, but when Mitch Lightfoot was. Lightfoot was clearly out of position, over-hedging the ball screen and allowing his man to slip and have an uncontested look.
After charting each possession, we see that McCormack’s defensive contributions only led TCU scoring on two different plays, first when he overhelped in the first half and forced Christian Braun to block out his man at the rim (leaving CB’s man uncontested for a put-back) and second when he goaltended a contested layup that didn’t appear to be going in (on a play where CB fouled the driver for an and-1). In 21 minutes, that was it. Needless to conclude, this was a good performance on defense by D-Mac. (As a comparison, Mitch Lightfoot and K.J. Adams combined for 13 points allowed in 19 minutes of play, far more than McCormack gave up in slightly more minutes).
Now for the season, McCormack’s defensive efforts have been rather poor. He is allowing 15.6 points per 60 possessions, which is second-worst on the team behind Mitch Lightfoot (of players playing at least 10% of possible minutes). After accounting for his rebounding, blocks, steals, and forced turnovers; he grades out as a -0.63 per game defender. He’s struggled on this end his whole career, and this season is no different. But he does have solid games from time-to-time.
On the other hand, Ochai Agbaji gave up 23 points in his worst defensive outing of the season. This wouldn’t be known if not for charting the game. While Agbaji will likely bounce back on Thursday, defensive performances tend to fluctuate more than offensive ones, there’s no possible universe in which Ochai was the third-best Jayhawk and McCormack the 10th-best Jayhawk on Tuesday. None.
The last thing I’d like to talk about is the season standings that accumulate each game and appear at the bottom of each Kusports.com Ratings write-up. For one, I’m not sure how the totals are arrived at. It seems, although this could be wrong, that each player receives points in inverse to the number of players that game. So if KU plays 10 players in a game, the #1 player of that game gets 10 points, the #2 player of that game gets 9 points, and so on. But this would only work as a sensible system if every game saw the same number of players play. For instance in games where only 8 players play, the #1 player is only getting 8 points, not 10.
A second problem is that there have been a number of missed games due to injury, illness, suspension, or coaching decision. So while the season standings are an accumulation, it isn’t true that each player has played an equal amount of games.
To his credit, Tait attempts to control for this by putting superscripts to indicate that a certain player his missed one or more games for some reason. But the effect is to make it look clunky. There are six Jayhawk regulars who have missed action because of non-coaching decision reasons, and each has a different symbol or letter to reflect this. For instance Wilson has a bullet-point to indicate he missed three games due to suspension, Agbaji has a + sign (although in the notes it has become a bullet-point as well), and other players have a letter, either x, y, z, or b.
Either way, this leads to the question of how to account for player value (which is what the KUsports.com ratings are trying to do) when players play different numbers of games. As an example, Jalen Wilson didn’t provide any value for the team when he was sitting the bench serving his suspension. So in some sense he should see his value diminished. On the other hand, a per game rating allows us to project his value better (since presumably he won’t be serving any more suspensions).
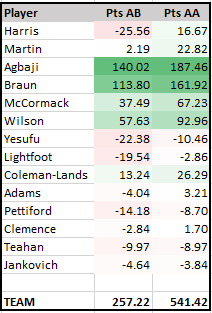
Charting the Hawks does provide both numbers against a hypothetical bubble player…per game and total. See 2022 here. In addition, I’ll add a third category below, or points above average. The average college basketball player is quite a bit worse (remember there are 358 teams) than your typical KU reserve.
Total Pts +/-
This chart shows the difference in rating, depending on how you define a “replacement player.” For instance, Dajuan Harris has been worse than the bubble-player that KU would expect to be able to recruit and develop. But he has been better than the average D-1 rotation player. So a team of Dajuan Harris-level players would likely be above .500 (depending on strength of schedule, of course), but would not likely be a tournament-level team.
This chart also shows that, even despite playing far more minutes, Harris still grades out worse than Remy Martin no matter how you compare the two. Harris has played the third-most minutes on the team, so his Pts AA is a larger increase to Pts AB than Martin’s change is. Yet when we compare Harris and Yesufu in Pts AA, we see that Harris’s additional minutes make him the better performer over Yesufu. So it is probably good to look at both numbers. Per game or per possession ratings can also help clarify value.