
Recently we discussed that the sport of college football and its postseason was a mess of contradictory goals and values, ending with the statement that we don’t have a good fix for it. However, we do want to address what we see as the major issues of the sport and hopefully provide a better system. If it were up to us alone, we’d blow up the playoff completely and go back to smaller, traditional, regional conferences that play in traditional bowl games (i.e. Big 10 vs. Pac 10 [yes Pac 10 not 12] in the Rose Bowl). We’d also mention that a “plus one” system after the traditional bowl season wouldn’t harm things either…in other words keep the traditional bowl games and then re-rank teams in early January, taking the final two teams to play in a CFP championship game on a neutral field.
Of course this idealized version prioritizes tradition and pageantry over an objective playoff system, something the fans tend to want. So here’s our modest proposal. It is three-fold in how it is set up:
- Use the model of the NCAA Tournament in basketball. Expand the field to 32, include all conference champions automatically, and then seed teams in an S-curve format.
- Determine the field through a list of objective criteria, effectively doing away with the committee and (much) human opinion.1
- Maintain the beloved and long-running 6 bowls as the quarterfinal and semifinal rounds of the playoff. The first two rounds (R32 and R16) will be on-campus games hosted by the better seed.
To set this up as a trial run, we did a mock exercise today (12/5/2025), just before the conference championship games kick off this weekend. In order to determine automatic qualifiers, we assumed each betting favorite as the winner of its respective conference championship game.
Using ESPN’s data, we set up a ranking system which included these following 5 categories under various weights:
- Strength of Record (SOR): 40%
- Football Power Index (FPI): 10%
- AP Poll rank: 10%
- Game Control (GC): 20%
- Average Game Win Probability (AVGWP): 20%
The weighted average of each team’s ranking in these categories is then ranked, producing a final S-curve ranking. Of course these weights and metrics are open to change. We would also recommend not using ESPN’s data for these rankings and instead introduce a truly-independent team of statisticians to set up these criteria. But for our purposes, we used ESPN’s numbers to highlight what a bracket might look like.
Now that the S-curve ranking is set, we now go to the bracket. First, we have to include any conference champion otherwise outside the field. This means that presumed champions Boise State (MW), Kennesaw State (CUSA), and Western Michigan (MAC) knock out teams 30-32 on the original S-curve.
Taking #1 on the S-curve, Ohio State, we place the Buckeyes in the top-left corner against the #32 S-curve team, Western Michigan. Then, taking each team’s current FPI ranking and adding 2.5 points for home field advantage, we estimate that Ohio State would be 35.9 point favorites, corresponding to a 97.5% winning rate. We do this for each team to get a bracket that looks like this.
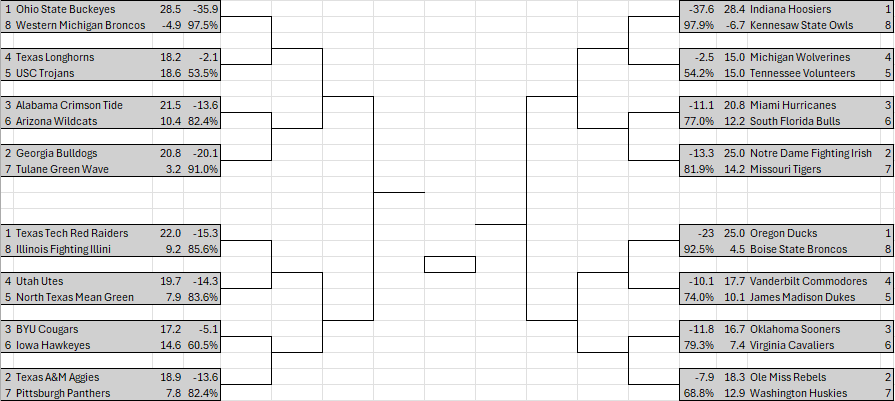
This bracket was set up using a rigid S-curve, which does differ from the basketball tournament where the committee has certain bracketing principles that prevent teams who played each other in the regular season to play in the first round, etc. We could introduce these same principles in football, i.e. switch things around in some of the potential 2-seed vs. 3-seed matchups so that prior matchups during the year (Georgia/Alabama, Notre Dame/Miami, and Ole Miss/Oklahoma) can’t recur in the round of 16. There are arguments to be made for either system (i.e. the NFL doesn’t adjust seeding to avoid inner-divisional matchups in the Wildcard round), and we don’t have strong opinions either way.
One might notice that the 1-seeds have a decided advantage by drawing lower-ranked, AQ teams; this mirrors basketball where the 1-seeds have a 98.8% winning probability since 1985 (158-2). The 4/5 matchups are mostly close games, though a few non-power conference champs with good records did overachieve to earn 5-seeds.2
Each conference gets a fair shot at making the field. Here is how conference bids shake out:
- SEC – 9
- Big Ten – 8
- Big 12 – 4
- ACC – 3
- American – 3
- FBS Indp – 1
- Sun Belt – 1
- Mountain West – 1
- CUSA – 1
- MAC – 1
In a surprise, the American Athletic Conference (AAC) got in three teams to tie with the ACC, a traditional power league. Next up is the Big 12 with 4. The Big Ten has 8 and the SEC has the most with 9 teams in the field. These numbers compare to basketball, where the best conferences tend to get around half of their teams into the Big Dance.
Just missing the field are the following teams, who were technically in the top 32 but got bounced out due to the provision that each conference champ gets in:
- TCU (#30)
- SMU (#31)
- Louisville (#32)
This indicates that the Big 12 and ACC are close to getting more teams in, and that some years they likely would get 5 to 6 instead of 3 to 4. This seems justifiable given the relative strengths of the leagues.
This and That
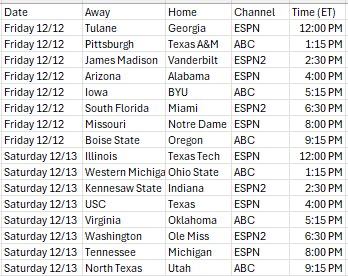
We set up a hypothetical first round schedule, taking place on Friday, December 12 and Saturday, December 13. Starting at noon with Tulane at Georgia on ESPN, 8 games are played on Friday followed by 8 on Saturday. These games are presumed to be broadcast on ESPN’s networks, and like the basketball tournament these games have staggered start times and can be enjoyed all day.
Since we are using the AP poll, the question arises as how to rank teams that aren’t in the top 25 or even receive votes. We thought the best thing to do would be to take all the teams that aren’t in the top 25 (actually ~ 37 with teams receiving votes) and then rank the rest based on SOR. This won’t make a huge difference but will ensure that a team on the margin isn’t unduly punished or rewarded for not being ranked. Another suggestion would be for AP voters to rank a top 50 or 75.
Simulation
The final step would be to play the games. We simulated one instance to see how this might play out. In the first round, the Pitt Panthers knocked off A&M in a surprise 7-seed over 2-seed upset. But the upset of the tournament was Kennesaw State’s win over Indiana despite the Hoosiers being 37.5 point favorites. In the second round, Texas got revenge at Ohio State and the Buckeyes fell. Pitt continued its Cinderella run by beating BYU. Miami won at Notre Dame in a mild upset as well. The quarterfinal games are played at traditional bowl games with home field advantage being erased, and we had the best-remaining team Oregon selecting to play the Rose Bowl against Oklahoma. The Sooners would upset the Ducks in this sim. Next was Michigan playing Miami at the Orange Bowl, a de facto home game for the Hurricanes who would also win. Next was Alabama and Texas in the Peach Bowl (Tide would roll) and lastly Texas Tech over Pittsburgh in the Sugar Bowl, with Tech opting to play in New Orleans as the second-remaining 1-seed in the field.
The semifinal games would be Texas Tech defeating Alabama in the Cotton Bowl and Miami edging Oklahoma in the Fiesta Bowl. The final would showcase Texas Tech (-1) against Miami, with the winner being Miami in a close contest. Quite a wild sim.
Conclusion
Leaning into the March Madness model would expand the playoff (leading to more revenue), ensure each conference gets a bid, avoid the mess of having good teams miss the playoff (teams who miss the field starting around 30 don’t really have much argument), and still keep some tradition by having six prestigious bowls serve as playoff rounds just as with the 12-team format. Additionally, utilizing objective metrics in a sensible way could help avoid much of the bias perceived to be in the sport. Of course a committee could still be used to aid in setting the field should bracketing principles be part of the exercise, or even helping provide a human element to the poll portion of the ranking. We do think it necessary to move away from a pure committee model at this junction, however.
- The AP poll would play a small part of the final ranking ↩︎
- Looking at things closer, this may have been due to ESPN not adjusting to opponent for its AVGWP metric, essentially aiding teams with weaker schedules. Again, don’t take this bracket too seriously, it was merely our first attempt to construct a 32-team field. Presumably these metrics would be sound if implemented. ↩︎
