

Every 2 years when the Olympics come around and events start awarding medals, a debate is sparked on how to represent which country is performing best. You can sort the list by gold medals or total medals, but neither is the best way, as the former way undercounts non-gold medals while the latter way undersells the prestige of the gold medal.
Enter “weighted medal count.” In doing some quick research, I came across a few proposals that have been made. First we will start with the 3/2/1 method, also called the Swedish method. Golds get credit for 3, silvers 2, and bronzes 1. This equation would have one silver and one bronze equating to one gold. A different method that strengthens golds is the 5/3/1 method, also called the English method. 5 for gold, 3 for silver, and 1 for bronze. This would require one silver and two bronze medals to equal one gold. Another method is the 4/2/1 proposal, which requires two silvers for one gold and two bronzes for one silver.
Each of these methods is fine and would be better than what is implemented now (no weighting system). But none are perfect as they have been created ad hoc. The thing is, the correct answer is already out there if you’re willing to use some reasoning and do some math.
Let’s start with the reasoning. What is the difficulty of winning a gold medal compared to a silver or bronze? Let’s assume there is a competition with 100 participants, with medals for first, second, and third. Let’s just assume the winning time is one minute, zero seconds (1:00). Thus, of everyone who raced, only one person got a time of 1:00 or better.
| Total Participants | Time | Participants finishing at this time or better | Multiple who beat time |
| 100 | 1:00 | 1 | 100 |
Now we get to the math. The multiple column is calculated by taking the total participants by the number of participants to finish in 1:00 or better. In our example, let’s assume second came in at 1:01 and third at 1:04. Now, let’s fill out the chart for the top three places.
| Total Participants | Time | Participants finishing at this time or better | Multiple who beat time |
| 100 | 1:00 | 1 | 100 |
| 100 | 1:01 | 2 | 50 |
| 100 | 1:04 | 3 | 33.33 |
If we filled out this chart we’d get each finisher’s time and multiples getting smaller and smaller until it reaches nearly 0. But we are only concerned with the top part of this table. The multiple helps us see what we intuitively know. When an athlete competes we judge his performance by how many of the others he is better than. Getting first is the equivalent of beating 100-fold of the field. Getting second is equivalent of beating 50-fold of the field, and getting third is beating 33.33-fold of the field.
Let’s examine the relationship between the multiples. First place is 100, second place is 50, and third is 33.33. First is two times that of second, and three times that of third. Necessarily, second is 1.5 times that of third. And if we upped the total participants who raced to 1,000 or 10,000 or any other number–doesn’t matter–we’d still get the same relationship between first, second, and third place. This follows a 6/3/2 relationship or a 3/1.5/1 method.
Therefore, since a gold medalist’s winning time was achieved by half as many as the silver medalist’s, we reason that the gold medalist was twice as special. And the relation between every other participant is decided in this way. When it comes to weighting medals, this means 3 for gold, 1.5 for silver, and 1 for bronze.
This can also be intuitively remembered by the formula that two silvers = one gold or three bronzes = one gold.
Analyzing the Other Methods Again
Each method has its pros and cons. The Swedish (3/2/1) is correct with regards to the weight between gold and bronze (3 to 1), but the silver is too high in relation to both. The English method (5/3/1) doesn’t get any relationship perfect, but it does pull down silver closer to where it should be with regards to gold (although it makes bronze far worse than it should be). The 4/2/1 method gets the gold to silver relationship correct but not the bronze which it undervalues. Still, either of these proposals is better than the gold only method (effectively 1/0/0) or the no-weight method (1/1/1).
Using the 3/1.5/1 method, and weighting it so a gold medal = 1 (effectively making it the 1/0.5/0.33 method), here are the top 10 countries in weighted medal count at the close of recent Olympic games.
2026 Winter Olympics (Milan Cortina)
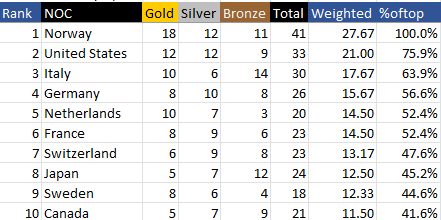
Another nice thing about the weighted system is that we can now use a “Percent of top” multiple allowing us to compare any two countries. In 2026, the US did better than every country except Norway, clearing third place and host Italy by 3.33 weighted medals.
2024 Summer Olympics (Paris)
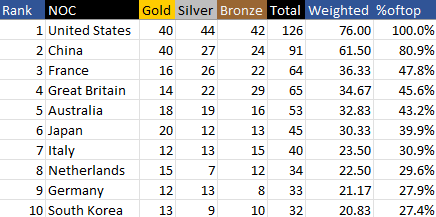
In 2024’s Paris games, the US and China tied in the gold medal count, but this obscures the fact that the US of A won far more silver and bronze medals. In total, this is a whopping difference of 14.50 weighted medals. This is a lot less close than sorting by gold medals would make it appear. Notice also that no other country third and down was within 50% of the United States’ weighted medal count. America easily won the 2024 Olympics.
2022 Winter Olympics (Beijing)
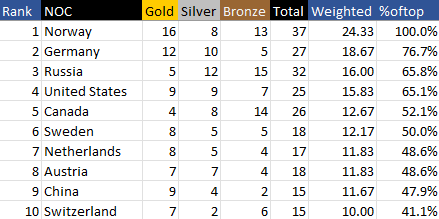
Norway dominated the 2022 Winter games, finishing 5.67 weighted medals in front of Germany. This was the most-recent games that Russia was allowed to compete, and the US finished fourth and at 65.1% of the winner.

One thought on “Weighting Medal Counts”