
All KU fans agree that Hunter Dickinson is a skilled and valuable offensive player. Some argue that Dickinson’s defensive deficiencies (they take for granted he’s a poor defender) severely undercut his offensive value. This post will examine Hunter’s defense by comparing him to other players on this season’s roster as well as KU centers in seasons past.
A player can be a plus defender in one of two broad ways. He can either do so by limiting the amount of points his man scores or he can be a good defender by getting the ball back for his team (such as rebounding). Note that these are related. A defender getting a rebound is also preventing his man from scoring on a putback attempt. The very best defenders are good at both aspects–they limit their opponents’ good looks and they get the ball back for their team.
Applying this to Hunter in particular, we want to examine how often he is most responsible for the other team scoring (compared to others) and how often he wins possession back through a block, rebound, steal, or forced turnover (compared to others).
Using the Charting methods, we calculate that Hunter has allowed 276 points in 23 games this season (12.0 ppg). When we convert this to a 60-possession basis, this comes to 12.9 per 60. This conversion is done to compare Hunter to other players.
Next, we can count the number of stops KU gets because Hunter gets the ball back through either a block, rebound, steal, or forced turnover. As rebounds are most common way a defense gets the ball back after a stop, Hunter’s importance is mostly by being a great rebounder. He averages 10.5 possessions “won” over 60 defensive possessions.
For the 2024 team, we can consider this table.
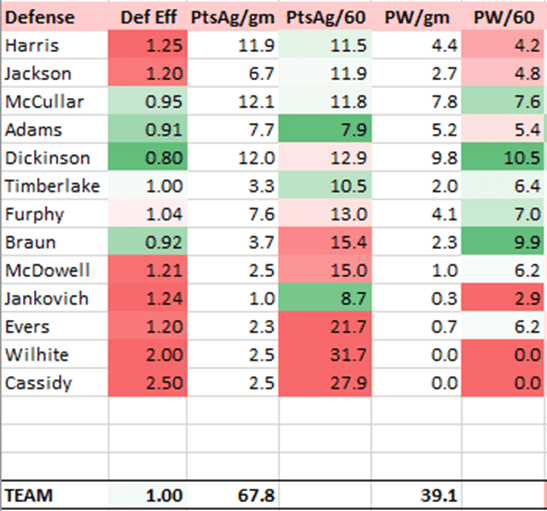
Looking at the Points Against Per 60 column, this shows that Hunter (allowing 12.9 per 60) is worse than the other starters save Furphy (13.0 per 60). However, he is better than his backup Parker Braun (15.4). Additionally, only K.J. Adams (7.9) is significantly better than Hunter at disallowing points. Harris and McCullar have been in the middle-of-the-pack.
If we move to the far-right column, we see possession winners per 60. In this case, Hunter is clear-and-away the best at getting the ball back following a miss or through a forced turnover.
When some think of defense, they mostly consider the first aspect of this, or on-ball defense. And this aspect is very important. Not getting beat, not fouling, closing out on shooters, forcing a player to pick up his dribble and pass, etc. are all ways a defender can make it more difficult for the opponent to score. But the second aspect, or coming away with the ball, is also important. First-shot defense that doesn’t win the ball back will lead to second and third chances that can allow points. A player who might not be a great first-shot defender can still add value if he prevents opponents from getting second-chances. So, we need a way to combine these elements of defense into one number that estimates player value.
Using theory regarding the relationship to points and possession in basketball, we can calculate how valuable these defensive metrics are. We will now include the defensive value metric in the final column of the table.
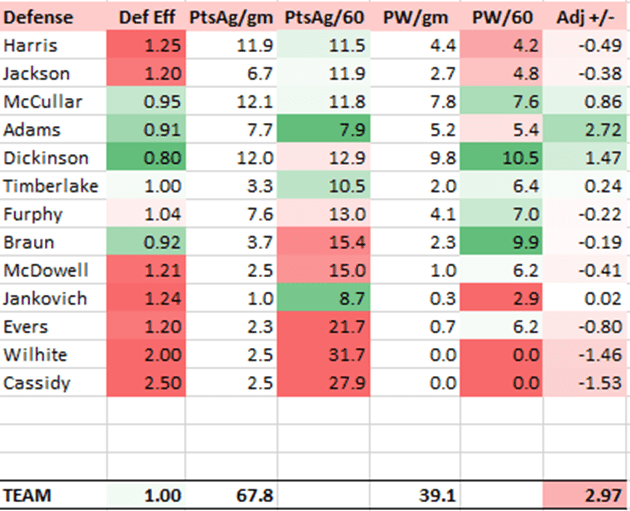
This final column estimates, in points per game, how valuable a certain defender is when compared to a replacement (bubble-level) player. Due to his stingy on ball-defense, K.J. has graded out as KU’s best overall defender. But the second-best defender has been Hunter Dickinson–not because he is always great at disallowing points–but because he limits teams’ second-chances. Imagine KU without Hunter on the floor. Teams would get many more baskets through second-chance opportunities.
This is common among bigs in today’s game. The prevailing offensive strategy involves getting opposing 5-men away from the basket (to clear driving lanes and cutting angles). As Hunter is involved in ball-screen defense and plays on the perimeter at times while on defense, he is often put in situations where he can find himself out of position. This leads to breakdowns, rotations, and open shots for opponents. But this isn’t always what happens. Other times he defends fine, and the possession ends with a missed shot that he has a great chance of rebounding due to his height and good rebounding technique.
We can break down the defensive value provided by 2024’s roster further, using 3 categories and a Per 100 possession basis. These three categories are: Stinginess (or points allowed), Pressure (forced turnovers/steals), and Boards (rebounds).
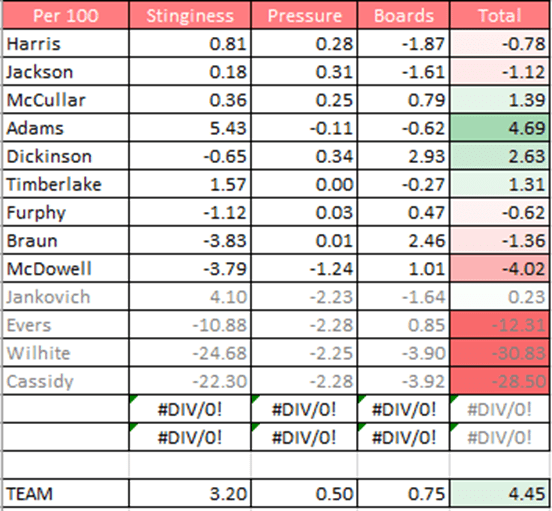
Hunter’s Stinginess score is below-bubble, but at -0.65 points we estimate that it only costs KU less than a point per 100 possessions. His Pressure (+0.34) and Boards (+2.93) make up for it, leading him to be a +2.63 player over 100 possessions. This is nearly 4 points better than his backup, Parker Braun has been. He is also better defensively than all other players save K.J. Far from being a liability, Hunt’s been a valuable asset for the 2024 defense.
We can also compare Hunter to 5-men of past seasons. Below is a table of all players labeled center who’ve played 10% of minutes on the season or more since 2018. This includes 9 player-seasons.
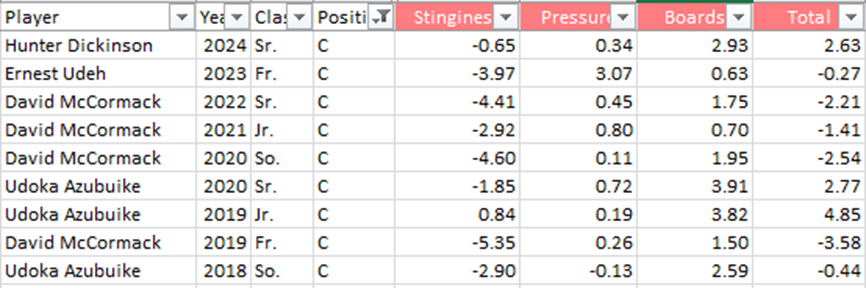
Here we see a pattern. 8 of the 9 centers on this list have negative Stinginess value, showing that they are allowing points more often than the average defender. This makes sense. Teams are attacking the slowness of the big men to find an advantage that leads to points. However, once we move right, we see that the 5-men can Pressure and Board better than average. So while your guards are likely to be better at preventing open shots, they struggle to get the ball back. Hunter’s rebounding better than any recent center not named Udoka. Additionally, his overall defense is 3rd best out of 9 centers since 2018, again only behind 2019 and 2020 Azubuike.
We can expand this more, just with less detail. Since 1993, there have been 192 players who have played at least 40% of the team’s minutes during the season. Of this 192, only 45 have had a per game defensive value as good as Hunter’s having this year. He’s objectively around the 76th percentile of defensive players in recent Kansas history. Ignore people who don’t know how to track defensive value and fail to consider all relevant factors of defense.
In addition to tracking individual defense, we can confirm these general findings by looking at proxy metrics. One such metric would be points in the paint. This season, for reference, KU’s offense is averaging 40.1 points per game from paint scoring. That’s what a good offense does. A large chunk of this is from Hunter (although K.J. and Kevin are also doing well at the rim). So let’s use KU’s offense as a comparison to KU’s defense. The thought would be that if Hunter’s offensive-value is being wiped away by poor defense, then KU will be allowing nearly as many points in the paint as it is scoring.
This isn’t the case at all. KU is only averaging 25.8 points per game in the paint. This is a difference of 14.3 points, which is more than the overall point difference (10.9). KU is winning points in the paint but losing in all other areas (that is FT’s + 3’s + 2’s outside the lane). This is just further confirmation of Hunter’s value.

One thought on “Hunter Dickinson’s Defense”