
In charting, “Coverage” indicates the level of detail which is covered by the media available for a specific game or season. In order to provide estimates of player value, each play or possession is charted and the Kansas player(s) most responsible for that play occurring is allocated that play (with its inherent value, good or bad) to his ledger. After some math, a value score estimate is provided that can be compared to others of different seasons and positions.
Coverage is an important aspect to this exercise, because with better coverage we have a better estimate of a player’s value score. The theory behind charting is that, simply by keeping a record of which players did “good” or “bad,” we can reasonably rate players for comparison. With more information, this rating gets more accurate.
Specifically, coverage relates to something along the following scale:
TV broadcast – Video Highlights – Radio broadcast – Play-By-Play – Box Score – Message Board Game threads – Newspaper Summary Articles
What’s best is the TV broadcast itself, but short of that there are other supplemental media sources that help determine how to best chart the game. Note some of these work well together. Without a full game broadcast, having video highlights along with the official play-by-play summary is a good source of reconciling possessions using accurate info. But as we go back further in time, less and less of this is available. In some instances, all we have is Box Score data. Effectively, this is a “bare minimum” of coverage.
Like the player value stats themselves, coverage is itself recorded and graded. A score of 100.0% is best with 89.0% being set as the middle and 78.0% being worst. Since 2006, the coverage by season is as follows:
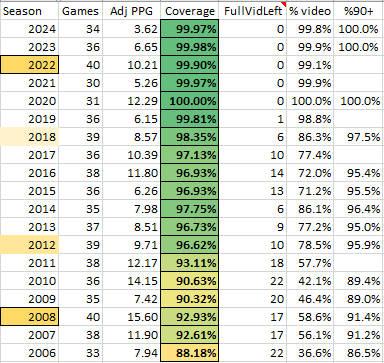
Coverage has been near-perfect since 2019, which was the first season for this project. Every season prior to 2019 was done retroactively, and the Coverage had to be obtained through archival means. As we go back further in time, we see the Coverage score slip lower and lower.
Coverage isn’t exactly at 100% for the recent seasons solely because there are a few plays that the TV coverage didn’t fully capture and/or there are a few games that weren’t caught live and had to be pieced together through an edited highlight video that, while very good, wasn’t exhaustive enough to show each possession for that game. But, effectively this won’t change value scores much.
The Full Video Left column shows the number of games that season that don’t have full video coverage, or a coverage score that is at least 95.7% for that game. Some games have a small segment missing (such as the first 3 minutes), but these are still given the “full video” designation. What this column shows is how many games are still there to be hunted down in order to fully complete this project.
The % Video column indicates the number of plays which are tracked through video. It will tie closely to Coverage. This metric is a good judge of how much more media there is to find for that specific season.
The last column isn’t complete for each season, but it shows which percentage of plays get a Coverage score of 90% or higher. In order to get a coverage score of 90% or higher, the play must be either viewed through video, heard through radio, or be recorded through play-by-play. Certain plays that aren’t available will be all possessions before play-by-play is available (which is most games before 2004), defensive possessions with no video/radio in which there is an opponent make or non-steal turnover, as well as other odd possessions that play-by-play doesn’t give full context to. Before 2006, this number will likely be far lower.

One thought on “Coverage Analysis”