
Golf is mostly an individual sport, but each year one of two biennial competitions pits 24 of the top pros in either the Ryder Cup (odd-numbered years) or Presidents Cup (even-numbered years). With competition most weeks being stroke-play based, the match-play team-format of the Cups has caused confusion regarding how to track player success.
For instance, a player’s official record in the Ryder Cup or Presidents Cup makes no distinction between team events and singles events. For reference, the first days of competition are between 2-man teams who face off in 18-hole matches. Only on Sunday are individuals paired against each other. This distinction should matter. A player whose record is good (poor) in team-competition may be due to his partner’s play more than his own. Further, each match in a Cup is awarded 1 point which goes to the winner. A draw earns each team 1/2 a point. So if a player is part of a 2-man partnership which wins an alternate shot match on Friday, the 1 point he earns for his team (i.e. America, Europe, International) is partially earned by him and partially earned by his partner. Giving full-credit to both partners over-counts the actual number of points in the competition. This is non-sensical.
To rectify this, partner contests (best ball and alternate shot) should allocate 0.5 points to each member of the winning duo. If there is a draw, 0.25 points are awarded to each of the four competitors. This makes a player’s singles record accurately reflect this format’s added importance. The following tables will show players’ Ryder/Presidents Cup records using this adjusted counting system.
Ryder Cup – All Time Points Leaders
There are multiple ways to rank Cup success. The first way accumulates the points won over the course of a career. This list rewards success at the Ryder Cup, but also the success of getting on the team and getting numerous opportunities to earn points.
United States
| Player | Points Won |
| Billy Casper | 15.25 |
| Arnold Palmer | 15 |
| Lee Trevino | 13.5 |
| Phil Mickelson | 13.5 |
| Lanny Wadkins | 13.25 |
| Gene Littler | 12.25 |
| Jack Nicklaus | 11.75 |
| Tom Kite | 11.5 |
| Tiger Woods | 9.75 |
| Hale Irwin | 9 |
Europe
| Player | Points Won |
| Sergio Garcia | 16.5 |
| Nick Faldo | 15.75 |
| Colin Montgomerie | 15 |
| Bernhard Langer | 14.75 |
| Lee Westwood | 14 |
| Rory McIlroy | 13 |
| Seve Ballesteros | 12.75 |
| Jose Maria Olazabal | 11.5 |
| Neil Coles | 11.25 |
| Ian Poulter | 11.25 |
Ryder Cup – Net Points by Team
Another way to look at Ryder Cup performance is to view it as a zero-sum game. This list recognizes that if you lose a match, your opponent earns a point for his team.
United States
| Player | Net Points |
| Arnold Palmer | +8.5 |
| Billy Casper | +7 |
| Lee Trevino | +7 |
| Sam Snead | +6.5 |
| Gene Littler | +6 |
| Lanny Wadkins | +5.5 |
| Tom Kite | +5.5 |
| Hale Irwin | +5 |
| Tony Lema | +5 |
| Jimmy Demaret | +4.5 |
| Gardner Dickinson | +4.5 |
| Jack Nicklaus | +4.5 |
| J.C. Snead | +4.5 |
Europe
| Player | Net Points |
| Colin Montgomerie | +8.5 |
| Ian Poulter | +6.5 |
| Sergio Garcia | +5.5 |
| Luke Donald | +4 |
| Bernhard Langer | +3.5 |
| Jose Maria Olazabal | +3.5 |
| Peter Oosterhuis | +3.5 |
| Seve Ballesteros | +3 |
| Nick Faldo | +3 |
| Paul Way | +3 |
| Tommy Fleetwood | +3 |
| Rory McIlroy | +3 |
The following tables show all players with a Ryder Cup net points total of -4 or worse. These are the worst performers in this competition.
United States
| Player | Net Points |
| Jim Furyk | -5 |
| Bubba Watson | -5 |
| Fuzzy Zoeller | -4.5 |
| Mark O’Meara | -4 |
| Rickie Fowler | -4 |
Europe
| Player | Net Points |
| Christy O’Connor | -9 |
| Harry Weetman | -6.5 |
| George Will | -6 |
| Dave Thomas | -5.5 |
| Neil Coles | -5 |
| Max Faulkner | -5 |
| Eamonn Darcy | -4.5 |
| Bernard Hunt | -4.5 |
| Mark James | -4.5 |
| Alfred Padgham | -4.5 |
| Sam Torrance | -4.5 |
| Peter Townsend | -4 |
| Tom Haliburton | -4 |
| Matt Fitzpatrick | -4 |
Presidents Cup – All Time Points Leaders
United States
| Player | Points Won |
| Phil Mickelson | 19 |
| Tiger Woods | 17.25 |
| Jim Furyk | 13.25 |
| Davis Love III | 11.25 |
| Steve Stricker | 8 |
Presidents Cup – Net Points by Team
United States
| Player | Net Points |
| Tiger Woods | +8.5 |
| Jim Furyk | +6.5 |
| Davis Love III | +5.5 |
| Phil Mickelson | +4.5 |
International player points have not been calculated yet.
The Americans haven’t gotten enough credit for their dominance in the Presidents Cup. While Team USA’s (road) Ryder Cup struggles are well documented, the fact it has gone 13-1-1 in the Presidents Cup gets explained away by the assumption the International Team is too overmatched to seriously compete anyway. This is not only circular, it is also misleading. Since 2000, International players (non-Americans and non-Europeans) have won 19 major championships compared to European players having won 21. American players top this list with 63 majors. Basically, while America’s struggles against Europe are surprising, their dominance against the Internationals is even more surprising (90.0% win rate).
Isolating a player’s contribution
Ryder Cup and Presidents Cup competitions differ from regular tour stroke-play in a number of ways. Players must qualify or be selected to even play. Match play is determined by holes won, not total strokes. The team portion means your partner can help or hurt your chance of winning, and likewise you have an effect on your partner’s record. Additionally, your record of success depends on how well your opponents play.
Further analytics can strip away these incidentals and calculate an estimate of each player’s value in the cup. The one problem is that detailed shot-level info is required. This info has only been tracked over the last 5 cups, the 2021, 2023, and 2025 Ryder Cups as well as the 2022 and 2024 Presidents Cups.
The below tables show a player’s estimated value in terms of net points added or lost in terms of matches played. This is called Value Per Match (VPM). The best performances in the last 5 seasons have come from Collin Morikawa, who earned VPM scores of 0.44 in the 2021 Ryder Cup and 2022 Presidents Cup.
Overall American Performances: 2021-2025
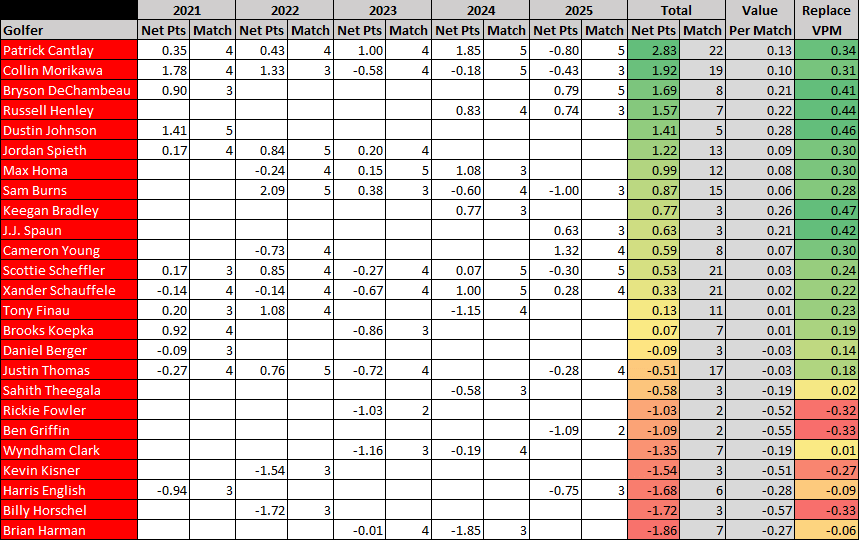
This table looks at the 25 American golfers who have competed in a Presidents or Ryder Cup from 2021-on, and ranks them by the estimated total Net Points won. Patrick Cantlay leads, having played in all 5 cups and playing an American-most 22 matches. Second is 5-cup Collin Morikawa, and third is Bryson DeChambeau (who has only appeared in the 2021 and 2025 Ryder Cups).
The two other 5-cup players, Scottie Scheffler and Xander Schauffele, are closer to the middle of the American list. Other quiet positives include Russell Henley and Sam Burns (though Burns had a tough 2025 Cup). The only player with negative value among those who have played in at least 10 matches is Justin Thomas. We estimate his play has lost Team USA 0.51 points over the four cups he’s played in.
Along with Net Points, we also made a Replacement-level Value Per Match to account for the fact that sometimes being below average still adds value (over that of the 13th best player who would hypothetically fill in). Setting the replacement level to the 20th percentile of all players who played in that particular cup, we estimated what each player added on a per match basis. Not too surprisingly, the best Americans in this regard have low sample sizes: Keegan Bradley (3 matches), Dustin Johnson (5), Russell Henley (7), J.J. Spaun (3), and Bryson DeChambeau (8). But in the case of DeChambeau in particular, this is partly due to him being excluded from Presidents Cups.
This Replace VPM column also shows that most Americans have been value-adding players, with Scheffler and Justin Thomas looking a bit better once we include the context of a replacement player. Being a slightly-negative value-player in a cup is not the worst thing. The four golfers who have objectively been terrible over the past five team competitions are: Billy Horschel, Ben Griffin, Rickie Fowler, and Kevin Kisner. It should be noted that Harris English’s Replace VPM drops to -0.15 once we ignore his envelope-aided tie in the 2025 Ryder Cup.
Next we will look at each Cup from 2021-on in more detail from most-recent to oldest.
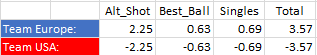
2025 Ryder Cup Performance Table
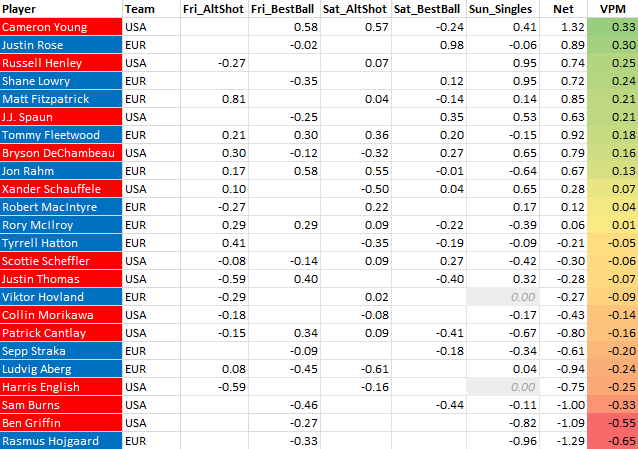
Cameron Young graded out as the 2025 Ryder Cup’s best performer, with Justin Rose (who had an all-time Saturday afternoon Best Ball format performance) in a close second. The top ten ping-pongs between American and European players, so the deciding factor for Europe’s win really came toward the bottom half of things. The US needed more from guys like Scottie Scheffler, Justin Thomas, and Patrick Cantlay.
Viktor Hovland sat out the Sunday singles match with an injury, causing Harris English to also sit out. Each technically received a half-point and is credited for it on this table. If we removed English’s singles half-point which wasn’t earned on the course, he would have earned -0.37 VPM. He was certainly a weak link for Team USA, but he wasn’t America’s worst (Burns and Griffin).
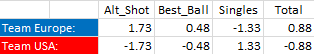
This table shows that Team Europe’s players, in isolation, were +0.88 points (and Team USA’s players -0.88). This was the closest Cup (Ryder or Presidents) in the last five years. As the Cup is not played in isolation (Team Europe teams up with each other against Team USA), it is understandable the European side won the Cup by a score of 15-13.
***NEW for 2025…Pairing Luck***
We ran some other counterfactual analysis for 2025, trying to see how lucky or unlucky Team USA got by the draw. In other words, given that the matchups are somewhat randomly decided in the Ryder Cup (each captain blindly puts out his lineup not knowing what the other is doing), what would the final results have been had these lineups been rearranged in random ways?1
This took even more work and simulations to calculate, but our estimates are the following for Team USA based on how they played and who they were paired with:
- Wins – 23.6%
- Ties – 15.0%
- Losses – 61.4%
This was a bit surprising. Yes, Europe played better and deserved to win. But had a few pairings been rearranged, the US was very much a contender. Running 500 simulations, the maximum points the US received was 17 (would be 17-11 win) and the fewest 10 (would be 10-18 loss). The majority of results were between 12 and 16 points (87.8% of sims) for the US.
Looking at each format, the US underachieved on days 1 and 2 when it found itself in a big hole. Yes, Europe played better those two days. But we’d expect the US to have ~6.1 points through the partner portion of the match (with Europe at ~9.9) instead of the 4.5-11.5 score it was heading into Sunday singles. On the flip side, the US overachieved during the singles portion due to fortunate pairings. The Americans grabbed 8.5 points to nearly come back, with the average scenario being more like 6.8 points for Team USA on Sunday. In all, a mean estimated score of 12.9-15.1 was very close to the actual 13-15 result.
2024 Presidents Cup Performance Table
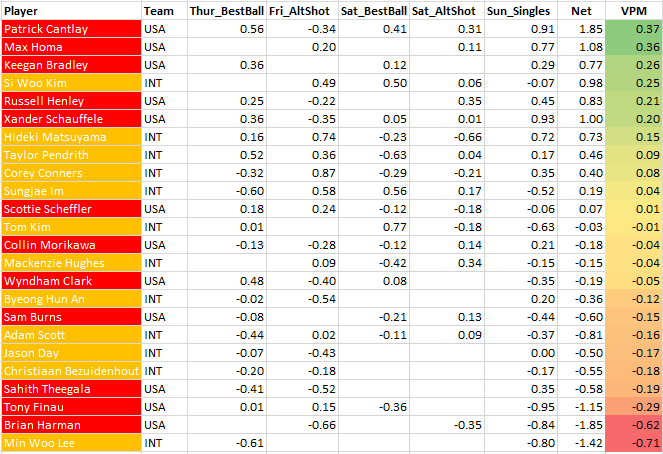
The 2024 Presidents Cup’s top three performers were all Americans–Patrick Cantlay, Max Homa, and Keegan Bradley. Cantlay played all five matches and added above-average value in four of them, while both Homa and Bradley were above-average in all three matches they each played.
At the bottom, both Brian Harman and Min Woo Lee had terrible Cups, with Lee having the worst performance of anyone in a Ryder or Presidents Cup over the past four years. However, he only played in two matches and therefore had less of a chance to work his way back to average.
Team USA once again struggled with alternate shot while succeeding in the best ball format. Interestingly, the Internationals played better over the team formats than the Americans despite Team USA holding an 11-7 lead going into Sunday. In the team formats, the Americans won 5 matches 1 Up compared to the Internationals winning on 2 matches 1 Up.
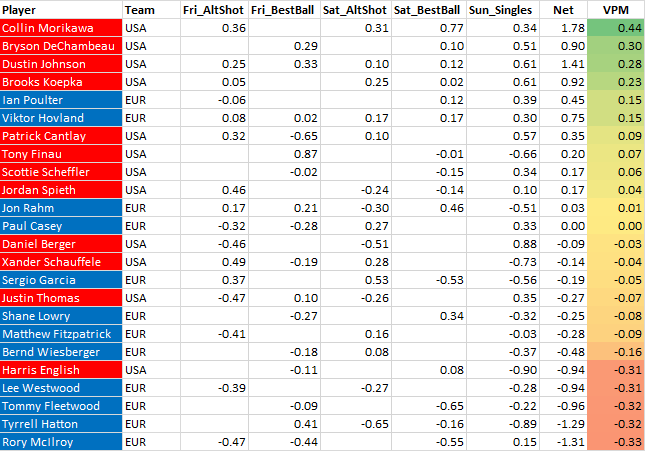
2023 Ryder Cup Performance Table
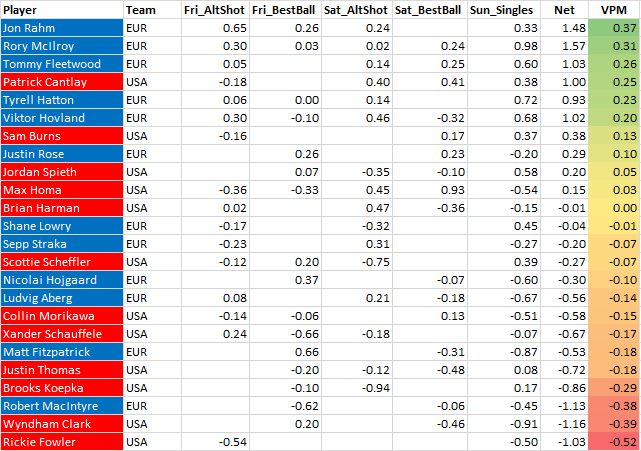
For 2023, Jon Rahm had the highest VPM (Rory McIlroy played in all matches and had the highest total estimated net points, which is seen in the Net column). It’s estimated that Rahm would added +0.37 net points on average per match. Additionally, each format shows the estimated net points that player added. McIlroy’s Sunday singles performance was expected to win +0.98 net points, making it the best performance of anyone in any session that week.
The losing captain normally faces criticism, and Zach Johnson was critiqued on a number of grounds. One area that’s mostly out of the captain’s control is the performance of his team once the competition begins. The teams were evenly matched according to datagolf.com before the Cup began. The home side just played better.
Still, Captain Johnson’s captains picks were under his control. He could have chosen different players than the ones he selected. Here’s how each side’s captain’s picks fared.
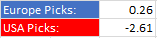
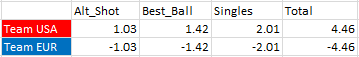
To calculate the difference, you have to subtract these two numbers and divide by 2. This means Europe’s captains picks outplayed America’s picks by 1.43 net points over the course of the Cup. On this measure, Luke Donald > Zach Johnson.
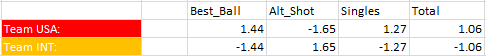
2022 Presidents Cup Performance Table
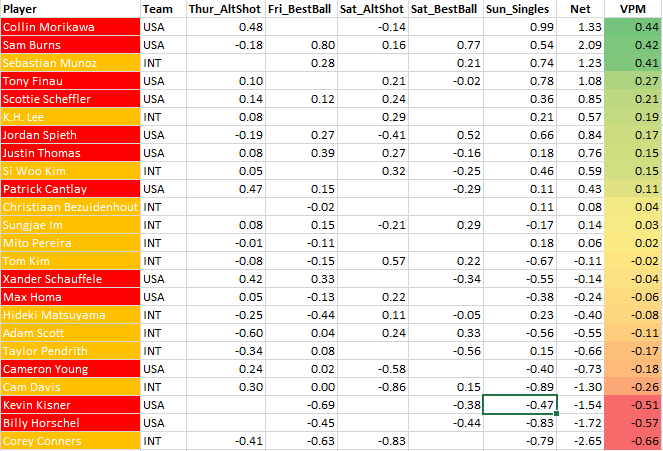
At the 2022 Presidents Cup, the USA had 6 of the top 8 players, with now-LIV player Sebastian Munoz having the best showing for the Internationals. The best performance in any session was Collin Morikawa’s singles round. Sam Burns played all 5 matches and did exceptionally well, particularly in his best-ball matches.
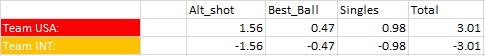
Team USA individuals played an expected 3.01 points better than the Internationals but won by 5 (17-12). There is likely a cumulative effect here. Although the individual players that make up Team USA were only better than the individuals who make up Team INT by 3 net points, when you combine the better players in the team formats it leads to a larger actual margin.
One can look at this a few ways. Namely, the International Team isn’t terribly behind the Americans. Or, once one appreciates the format, realize how difficult it is for a true underdog to win. Any small difference in talent will be amplified when better players are paired against slightly lesser players.
2021 Ryder Cup Performance Table
Team USA dominated the 2021 Ryder Cup, with the top four individual performers and 8 of the top 10. Rory McIlroy had a pathetic showing and graded out as the worse player at Whistling Straits.
The American 10-point victory was much higher than the net points shown above. This provides further confirmation that the team matches help the better side to stretch the margin further than a pure strokes-gained or holes-won perspective would indicate. In addition, Jordan Spieth/Justin Thomas’ 2 Up Alternate Shot win on Saturday morning was in spite of playing poorly from a strokes-gained perspective against both European competitors. They had some dreadful shots, but those occurred on the same hole that would be conceded anyway. If your opponents make a birdie, you lose the same with par or quadruple bogey. The match-play format rewards birdies and eagles while penalizing high scores less than in stroke play.
In the last 3 Cups, there have been four players which have played in all (Patrick Cantlay, Justin Thomas, Collin Morikawa, and Scottie Scheffler). Now only Americans can achieve this feat, and only those who aren’t on LIV (banned from the Presidents Cup). And of these four, only Cantlay has performed above average for each cup.
- No new pairings were made, rather what was done was an analysis to determine what would have happened if Team USA’s first group out in Friday’s morning alternate shot instead played, say, Team Europe’s third group out that morning. We kept the results each team made on a hole and assumed they would do no better or worse if they played against a different pairing. For holes that weren’t finished/conceded, we used strokes gained to estimate the score. The same thing was done for all 28 matches in the Ryder Cup. ↩︎

One thought on “Team Golf – Ryder Cup & Presidents Cup”