
The 2010 Kansas Jayhawks finished 33-3 (15-1), winning the Big 12 Regular Season and Conference Tournament. The team earned a 1-seed in the NCAA Tournament and made the Round of 32 before losing. The team’s Sports Reference link is here.
OFFENSE
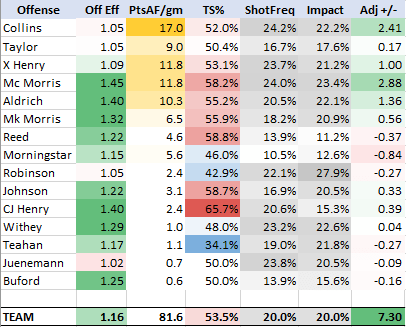
The 2010 offense was led by Sherron Collins, the senior point guard and team’s most-veteran leader. He added a solid value score of +2.41, second on the team behind much-improved sophomore PF Marcus Morris. Collins was not super efficient, but he could take and make the tough shots and get looks for others due to his skill and effort running the show. He led the team in shot frequency percentage, taking 24.2% of shots while in the game (20.0% is average). Marcus Morris’s efficiency led the team, and he did so while still contributing more than his fair share of attempts. Others positives to mention include the efficient big man Cole Aldrich and the versatile wing freshman Xavier Henry.
DEFENSE
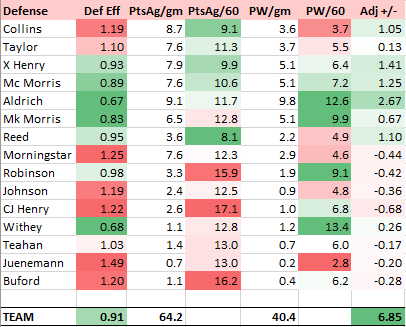
The 2010 defense was anchored by 6’11 center Cole Aldrich, an inside force who won 12.6 possessions per 60 possessions played. He even added value in how many points he allowed, using his length and experience to overcome a lack of quickness as well as teams trying to force him to guard outside the lane. Other defensive standouts include Xavier Henry, Marcus Morris, and Tyrel Reed. Reed may have also been the team’s most underrated defender, as he led the team in points allowed per 60 possessions, with Sherron Collins behind him a bit.
Total Adjusted PPG +/-
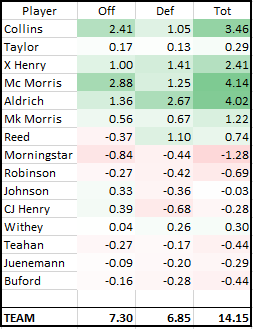
In a bit of a surprise, Marcus Morris graded out as the top Jayhawk, although his per game value was not statistically more significant than Cole Aldrich. The 2010 Kansas Jayhawks had tremendous balance, with its top seven players in minutes played all providing positive value for the team. The depth on this roster is unmatched; freshmen Thomas Robinson, Elijah Johnson, and Jeff Withey would all be starters on the 2012 team that finished national runners-up. Despite being clearly talented prospects, they were 9th, 10th, and 13th in minutes played on this team due to depth.
It’s unfortunate this team didn’t have more tournament success, because it was poised for a deep run. Sometimes, fluke losses happen. That’s certainly what happened here. The 2010 team was versatile, experienced, and deep. It had great college players along with future NBA players. Counting its game margins and strength of schedule, it grades out as the third-best KU team (and Self’s second-best team at KU) since 1997 (behind 2008 and 1997).
/cloudfront-us-east-1.images.arcpublishing.com/gray/MRSU6U6S25MM5FZSIZ6HBWFXRA.jpg)
Coverage Metrics
(Coverage metrics relates to how much video, radio, highlights, play-by-play, newspaper, etc. coverage was available to chart this season, with each medium weighted by its a preset value score. Recorded TV coverage is best, followed by video highlights, radio, and so on).

The 2010 season has a coverage score of 90.61%. This number indicates the average accuracy score for possessions that season. As it is in yellow, this makes the 2010 season slightly above the middle in terms of coverage. In general, the further back in time we go, the less video we have for that season.
Out of 36 games that season, there are still 22 games left that don’t have full video. For many of these games, partial highlights do exist and have been incorporated. Additionally, play-by-play description and analysis from newspaper coverage can help with the charting. But nothing beats video. In total, 41.9% of possessions in 2010 were charted from video, which is the second-lowest from 2006 – present. Most years prior to 2006 will be below 41.9%. The last column looks at how many possessions have a strong degree of confidence (90%+). These are plays that are either seen on video or are described through play-by-play. Nearly 9 out of 10 plays have a strong confidence, with the other 10.6% being more speculative.
The hope is that the plays which don’t have as high a degree of confidence will balance out among the players. These plays are essentially split among players based on certain estimates (i.e. if an opposing big man scores, it is likely due to the faulty defense of a KU big man who is on the floor at that time). What ends up happening is that a coverage error exists. The hope is that the error is small. If we look at the value scores again…
…we should understand that these are estimates of player value, and that there is an coverage error of some factor, perhaps as high as +/- 0.50 points per game for certain players. More work will be done to establish a coverage error number.
Coverage error is the only type of error being discussed here. Other potential errors which haven’t been discussed are systemic errors (how the system is set up), mathematical errors (in making calculations), as well as interpretation errors (i.e. when charting, the charter erroneously gives credit/blame to Player A when it should have gone to Player B).

2 thoughts on “2010 Kansas Jayhawks”