
Since 1985 when field expanded to 64+, there have 35 NCAA tournaments. Below is a large collection of stats and information related to the 64+ team era, along with KU-specific information relevant to this year’s tournament.
The first chart shows the average number of wins per seed-line (excluding play-in games). Only the top 6 seeds are expected to win at least one game in the tournament, and there is a steady decline as you go down the seed list.
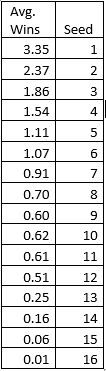
1-seeds have won more tournament games than seeds 9-16 combined. Seeds 9-11 are basically interchangeable in terms of total tournament wins.
Since Kansas is on the 3-line, we’ll zoom in here. 3-seeds average 1.86 wins, sliding them closer to the 4-line than the 2-line. However, they 3-seeds win 2 games 53% of the time. 3-seeds are more likely to get knocked out of the Round of 64 than make the Final 4. A S16 appearance (or 2 tournament wins) would be very close to seed-line expectations. The second weekend seems like a realistic goal for this team, and then enjoy whatever else they can do. Bill Self has had two 3-seeds while at Kansas, losing in the R64 to Bucknell in 2005 and defeating North Dakota St. in 2009 during a S16 run.
Round of 64
Chart below shows each R64 match-up by seed since 1985. There have been 140 of each of these seed match-ups in total. TP means total points per game, so the 1-seed has averaged 84.18 points when playing the 16-seed, which scores an average of 59.94 points.
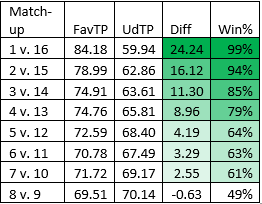
The 3-seed is 11.30 points better than the 14-seed on average. With KU currently favored at -11 against Eastern Washington, this 3/14 match-up is very close to historic expectation.
The next chart shows how much seed differences matter in this first round. The left column compares the win success in the R64 between seeds one seed-line apart. In other words, it compares how often a 1-seed wins in the R64 to how often a 2-seed wins in that round. The right column shows the value as a multiple. In other words, a 1-seed is 8.87 times more likely to win in the first round than the 2-seed is. Of course, it rare that any 1 or 2 lose, but when it does occur it is far more likely that it is the 2. The biggest seed gap, when it comes to R64 success, is between the 1-seed and 2-seed. There is little meaningful difference between seeds 5,6,7 in this round.
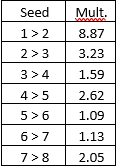
The 2-seed/3-seed jump is the second biggest difference down the board, and it indicates that the 3-seed is closer in expectation to a 4-seed than a 2-seed. Still, KU getting a 3-seed instead of a 4-seed improves its odds of making the Round of 32 by a decent amount.
The biggest margins of victory in this round are as follows:
- 58 – (1. Kansas 110, 16. Prairie View 52 in 1998)
- 56 – (1. Connecticut 103, 16. Chattanooga 47 in 2009)
- 49 – (2. Syracuse 101, 15. Brown 52 in 1986)
- 47 – (1. Duke 84, 16. Winthrop 37 in 2002)
- 47 – (4. Syracuse 81, 13. Montana 34 in 2013)
- 46 – (1. Kentucky 113, 16. Mount St. Mary’s 67 in 1995)
- 46 – (5. VCU 88, 12. Akron 42 in 2013)
Some amazing numbers here. First, we all know what happened to KU the next round during the 1998 tournament. Notably, none of these teams went on to win the national championship, and 2/7 made a Final Four (2013 Syracuse, 2009 UConn). The 2013 tournament saw two of these blow-outs greater than 45 points, and these were the only two games which of seeds worse than a 2-seed. Both games also took place concurrently, during the evening session on the opening Thursday of the tournament. Montana shot 4/31 (13%) from 3 against the Syracuse zone, while Akron turned it over 22 times against VCU’s pressure.
A total of 55 First Round games have ended in a 1-point margin, 73 in a 2-point margin, and 59 in a 3-point margin. These one-possession games have accounted for 17% of all games played in the R64. And this doesn’t include overtime games that end with a margin greater than 4.
Here is a list of teams with at least 15 wins in the R64 since ’85 (all records exclude vacated wins):
- Kansas: 32 – 2
- North Carolina: 31 – 1
- Duke: 30 – 4
- Kentucky: 27 – 2 (1 vacated)
- Michigan St.: 22 – 7
- Arizona: 20 – 12
- Syracuse: 20 – 4 (2 vacated)
- UCLA: 19 – 6
- Purdue: 19 – 6
- Maryland: 18 – 2 (1 vacated)
- Gonzaga: 18 – 4
- UConn: 17 – 2 (1 vacated)
- Georgetown: 17 – 4
- Villanova: 17 – 6
- Cincinnati: 17 – 6
- Texas: 17 – 9
- Illinois: 16 – 6
- Wisconsin: 16 – 6
- Xavier: 16 – 9
- Oklahoma: 16 – 10
- Michigan: 15 – 3 (2 vacated)
- Florida: 15 – 5 (2 vacated)
- Indiana: 15 – 10
Kansas’s success in this round has only been rivaled by a few other blue-bloods. It’s win percentage is 94%, matching the success of the average 2-seed. KU has benefited in getting numerous 1 and 2 seeds, but it has also won in this round as a 3, 4, 5, 6, and 8 seed. In fact, KU has gone 12-2 (86%) as a seed worse than 2 during this stretch. Far from choking, the Jayhawks have been stalwarts at avoiding the early upset. KU has won R64 games in 13 straight NCAA tournaments, easily the longest current streak.
Kansas’s 5 Best Round of 64 Games (by margin of victory):
- 58 – (1. Kansas 110, 16. Prairie View 52 in 1998)
- 40 – (1. Kansas 107, 16. Niagara 67 in 2007)
- 38 – (1. Kansas 100, 16. UC Davis 62 in 2017)
- 38 – (2. Kansas 92, 15. South Carolina State 54 in 1996)
- 34 – (4. Kansas 87, 13. Northeastern 53 in 2019)
Much of Kansas’ success in the R64 was also due to Roy Williams, who has famously never lost in this round at either school he’s coached. He did miss the tournament in 2010 however, so UNC’s streak of R32 berths begins in 2011.
Round of 32
This section discusses how teams do in the R32 to advance to the S16.
Below are the records for each seed-line in the Second Round:
- 1 seed: 120 – 19
- 2 seed: 89 – 43
- 3 seed: 74 – 45
- 4 seed: 66 – 45
- 5 seed: 47 – 43
- 6 seed: 42 – 46
- 7 seed: 27 – 58
- 8 seed: 13 – 55
- 9 seed: 7 – 65
- 10 seed: 23 – 32
- 11 seed: 22 – 30
- 12 seed: 21 – 29
- 13 seed: 6 – 23
- 14 seed: 2 – 19
- 15 seed: 1 – 7
- 16 seed: 0 – 1
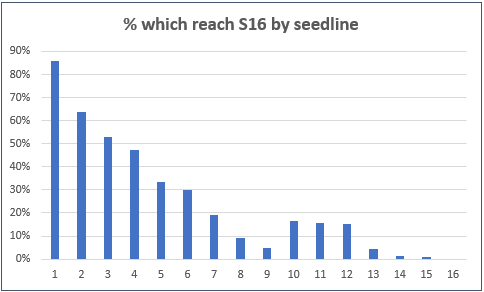
The seed-line success in the R32 (to win berths to the S16), show a sharp decline from 1-seed to 2-seed, followed by a steady decline down to the 9-seed. There is a jump up to seeds 10-12, before dropping back down with very few 13, 14, and 15-seeds making the second weekend. No 16-seed has made the S16. The 8 and 9 seed-lines have the disadvantage of having to play the 1-seed in the R32, making it a tougher slot on the bracket than teams seeded a few lines worse.
As mentioned earlier, 53% of 3-seeds reach the S16. Kansas’s bid to make the second weekend is a legitimate dead-heat.
The biggest margins of victory in the R32 since ‘85:
- 45 – (1. North Carolina 112, 8. Rhode Island 67 in 1993)
- 43 – (1. Oklahoma 124, 9. Louisiana Tech 81 in 1989)
- 41 – (1. Duke 97, 9. Tulsa 56 in 1999)
- 37 – (2. Cincinnati 92, 7. New Mexico State 55 in 1993)
- 35 – (6. UCLA 105, 3. Maryland 70 in 2000)
There hasn’t been a 35+ point blow-out in the Second Round in 19 tournaments.
These are the number of Sweet 16 appearances by program since the 1985 tournament, or in other words the number of Round of 32 wins by program. These totals do not include vacated wins, which have been removed from official win records.
- 25 – Duke
- 23 – North Carolina
- 22 – Kansas
- 21 – Kentucky
- 17 – Arizona
- 16 – Michigan State
- 14 – UCLA
- 14 – Syracuse
- 13 – Connecticut
The top four teams on this list are the only ones which have made at least 50% of Sweet 16’s in the past 35 tournaments. Duke’s percentage of 71.4% leads the way, although this will drop after this season.
Kansas’s 5 Best Round of 32 Games (by margin of victory):
- 32 – (2. Kansas 108, 10. Arizona State 76 in 2003)
- 29 – (4. Kansas 87, 5. Syracuse 58 in 2001)
- 25 – (2. Kansas 76, 10. Santa Clara 51 in 1996)
- 23 – (1. Kansas 86, 8. Stanford 63 in 2002)
- 22 – (1. Kansas 65, 9. Temple 43 in 1986)
Both the Stanford and Arizona State blow-out wins occurred after too-close-for-comfort First Round wins against a 16 and 15 seed. The top 5 results for KU in this round all occurred before Bill Self, although Self has 10 Second Round wins while at Kansas which matches him with Roy Williams.
Sweet 16
Below are the number of wins per seed-line in the S16:
- 1 seed – 97
- 2 seed – 64
- 3 seed – 36
- 4 seed – 21
- 5 seed – 9
- 6 seed – 14
- 7 seed – 10
- 8 seed – 8
- 9 seed – 4
- 10 seed – 8
- 11 seed – 8
- 12 seed – 1
The outsized effect the 1-seed has on the bracket can be seen in the fact that out of the 4/5/12/13 seed pods, only 31 teams have won S16 games whereas out of the 6/7/10/11 pods, 40 teams have won in the S16. Avoiding a 1-seed for as long as possible helps. The 1-seed dominance extends to this round.
Assuming KU could get to the S16, the potential match-up against 2-seed Iowa is on the minds of many. However, 2/3 S16 games are less common than one might think. Since 1985, only 32% of the time have 2 and 3-seeds made the regional semifinals together. But given that 3-seed KU was able to make the S16, it would face a 2-seed 64% of the time.
The biggest margins of victory in the S16 since 1985 are as follows:
- 39 – (1. Kentucky 78, 5. West Virginia 39 in 2015)
- 39 – (1. Louisville 103, 12. Arizona 64 in 2009)
- 34 – (1. Kentucky 103, 5. Wake Forest 69 in 69 in 1993)
- 32 – (1. Kansas 98, 4. Purdue 66 in 2017)
- 31 – (1. Kentucky 101, 4. Utah 70 in 1996)
Since 1985, here are the highest number of Sweet 16 wins (Elite 8 appearances) by program:
- 17 – Kentucky
- 17 – North Carolina
- 16 – Duke
- 15 – Kansas
- 10 – Connecticut
- 10 – Michigan State
- 10 – Arizona
No program has made half of the Elite 8’s since 1985, and North Carolina would have to win three games in this year’s tournament to reach that milestone.
Kansas’s 5 best Sweet 16 games (by margin of victory):
- 32 – (1. Kansas 98, 4. Purdue 66 in 2017)
- 26 – (4. Kansas 100, 9. Alabama-Birmingham 74 in 2004)
- 20 – (1. Kansas 77, 12. Richmond 57 in 2011)
- 18 – (3. Kansas 83, 2. Indiana 65 in 1991)
- 17 – (2. Kansas 93, 6. California 76 in 1993)
Of the top 3 wins, notably none of those Jayhawk teams went on to win their Elite 8 games.
Elite 8
There are 140 teams which have made a Final 4 since ‘85, and their seed-lines are listed below with the percentage of that seed to make the F4:
- 1 seed – 57 (41%)
- 2 seed – 29 (21%)
- 3 seed – 17 (12%)
- 4 seed – 13 (9%)
- 5 seed – 7 (5%)
- 6 seed – 3 (2%)
- 7 seed – 3 (2%)
- 8 seed – 5 (4%)
- 9 seed – 1 (1%)
- 10 seed – 1 (1%)
- 11 seed – 4 (3%)
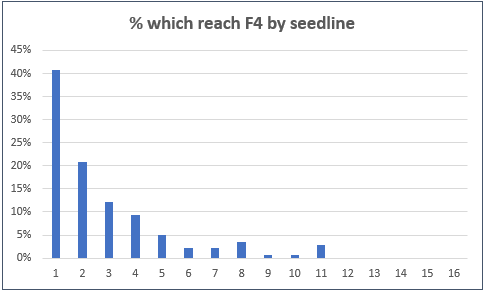
There have nearly been as many 1-seeds to reach the Final 4 (57) as 2,3,4-seeds combined (59).
The biggest Elite 8 margins of victory are below:
- 37 – (3. Michigan 102, 5. Virginia 65 in 1989)
- 31 – (4. Cincinnati 88, 6. Memphis 57 in 1992)
- 30 – (1. UNLV 131, 11. Loyola Marymount 101 in 1990)
- 27 – (2. Indiana 106, 1. UCLA 79 in 1992)
- 25 – (1. Kentucky 106, 3. Florida State 81 in 1993)
- 25 – (3. Utah 76, 1. Arizona 51 in 1998)
Since 1985, here are the highest number of Elite 8 wins (Final 4 appearances) by school:
- 12 – Duke
- 11 – North Carolina
- 9 – Kansas
- 8 – Kentucky
- 8 – Michigan State
Of Kansas’s 9 wins in the E8, the best 3 by margin of victory since ’85:
- 18 – (1. Kansas 104, 2. Oregon 86 in 2002)
- 13 – (2. Kansas 80, 1. North Carolina 67 in 2012)
- 13 – (1. Kansas 71, 4. Kansas State 58 in 1988)
Of the 36 Elite 8’s that a 3-seed has been to, they have faced a 1-seed 25 times (69%). This matches the historic Elite 8 rate for 1-seeds. So were KU to make it to a Regional Final, it would likely face Gonzaga although there is no guarantee.
Final 4 (National Semifinals):
Of the 70 teams which have won a national semifinal game since 1985, 49% of them (34) have been 1-seeds. All seeds 1-8 have made a national title game, but none below 8:
- 1 seed – 34
- 2 seed – 13
- 3 seed – 11
- 4 seed – 3
- 5 seed – 3
- 6 seed – 2
- 7 seed – 1
- 8 seed – 3
The biggest margins of victory in the Final 4 round are as follows:
- 44 – (2. Villanova 95, 2. Oklahoma 51 in 2016)
- 33 – (2. Kansas 94, 3. Marquette 61 in 2003)
- 21 – (1. Duke 78, 2. West Virginia 57 in 2010)
- 20 – (1. Duke 81, 7. Michigan State 61 in 2015)
- 19 – (2. Arizona 80, 1. Michigan State 61 in 2001)
Since 1985, the most Final 4 wins (Championship Game appearances) by school are as follows:
- 9 – Duke
- 5 – Kentucky
- 5 – North Carolina
- 5 – Kansas
Kansas’s 5 wins were as follows:
- 33 – (2. Kansas 94, 3. Marquette 61 in 2003)
- 18 – (1. Kansas 84, 1. North Carolina 66 in 2008)
- 7 – (6. Kansas 66, 2. Duke 59 in 1988)
- 6 – (3. Kansas 79, 1. North Carolina 73 in 1991)
- 2 – (2. Kansas 64, 2. Ohio State 62 in 2012)
3-seeds are 11-6 in Final 4 games. Were KU to make a Final 4, the top 4 seeds of the Midwest Regional and potential opponents are: 1. Michigan, 2. Alabama, 3. Texas, 4. Florida St.
National Championship Game:
The 1-seed has dominated in this round as well. Below are national championships by seed since 1985:
- 1 seed – 22 (63% of tournaments)
- 2 seed – 5 (14%)
- 3 seed – 4 (11%)
- 4 seed – 1 (3%)
- 5 seed – 0 (0%)
- 6 seed – 1 (3%)
- 7 seed – 1 (3%)
- 8 seed – 1 (3%)
Note that these numbers are since ’85, North Carolina State also won as a 6-seed in 1983, when the tournament was 48 teams.
Teams with multiple National Championships since ’85 are:
- 5 – Duke
- 4 – North Carolina
- 4 – Connecticut
- 3 – Villanova
- 3 – Kentucky
- 2 – Kansas
- 2 – Florida
The biggest margins of victory since 1985:
- 30 – (1. UNLV 103, 3. Duke 73 in 1990)
- 20 – (1. Duke 71, 6. Michigan 51 in 1992)
- 17 – (1. Villanova 79, 3. Michigan 62 in 2018)
- 17 – (1. North Carolina 89, 2. Michigan State 72 in 2009)
- 16 – (3. Florida 73, 2. UCLA 57 in 2006)
3-seeds which have won a National Championship since 1985:
- 2011 – Connecticut
- 2006 – Florida
- 2003 – Syracuse
- 1989 – Michigan
Kansas’s 2 National Championships since 1985:
- 1988: 6. Kansas 83, 1. Oklahoma 79
- 2008: 1. Kansas 75, 1. Memphis 68 in OT
