
Doing something a little bit different in lieu of the game recap. For reference, KU just beat TCU 59-51 to go to 11-5 (5-4) on the season. Below are the individual’s PPG +/- numbers as it stands 16 games into the season.
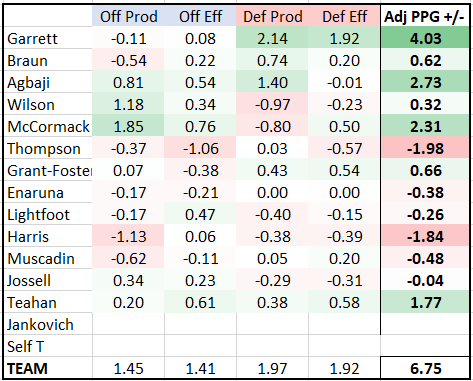
The four categories of value are Offensive Production, Offensive Efficiency; and their corollaries Defensive Production and Defensive Efficiency. The first two numbers sum to the Offensive score, the second two to the Defensive Score, and of course the final number is the PPG +/- which is the sum of offense and defense.
The Offensive Production score is compared to a hypothetical player that is average in production…such a player would produce 1/5 of the (bubble) team’s points, adjusted for his minutes. Missed shots don’t count against players here. Offensive efficiency takes into consideration all other chartable offensive plays alongside point production…namely missed shots, turnovers, and offensive rebounds. It too depends on volume…being efficient with more volume will increase the player’s Offensive efficiency score as well as his defensive efficiency score.
David McCormack is starting to distance himself as the team’s best offensive weapon. He has a high volume–takes a lot of shots–but is also playing more efficiently of late. He is reducing his turnovers and going after offensive rebounds. He hit his first 3-pointer of the season as well. For the season, he is now up to 11.7 ppg and is closing in on Jalen Wilson (12.3 ppg) for second-place on the team. Mitch Lightfoot has also become a positive offensive contributor, largely due to his superb efficiency 1.49 ppp (points per possession used). He doesn’t miss many shots, and grabs his fair share of offensive rebounds. He is lightly used, so his production is less than it should be.
For defensive stats, Defensive Production is the reverse side of Offensive Production. Defensive Production might be poorly named…it has nothing to do with producing traditional defensive stats (like rebounding, steals, blocks) but rather tracks how many points the player gives up to his opponents while on defense. It too is based on minutes played and compared against a hypothetical bubble player. It looks purely at how well the player does in keeping his man from scoring. Defensive efficiency takes into account traditional defensive stats, as well as turnovers forced (drawn charges, forced travels or bad passes, etc.). Notice that while Agbaji does a great job of limiting his man’s scoring production, he doesn’t grab a ton of rebounds or force many turnovers. His overall defensive score is still very good, but nowhere near Marcus Garrett’s.
Notice Grant-Foster’s defensive prowess. He does a good job of keeping his man in front, and uses his length and leaping ability to grab rebounds at a valuable rate. KU is a better defensive team with him on the floor, and him playing more minutes will make the team more competitive.
Let’s take a look at KU’s worst defenders, using KU’s system to understand each’s vulnerabilities and how the team could improve its defensive numbers the rest of the way. Jalen Wilson is -1.20 ppg compared to a bubble player. In KU’s system, he is often switched onto quicker players and isolated in late-clock situations. Dejuan Harris is at the opposite end, at 6’1 and slightly-built he gives up size to bigger wing players he faces. This is partial the reason he gives up -0.77 ppg. One thing you may notice is that guards tend to have a better Def Prod score than Def Eff score. This is common, they typically play better on-ball defense than the bigs but don’t get as many blocks/rebounds and thus don’t “win” as many defensive possessions. Harris is actually equally split between his Def Prod and Def Eff, which indicates that he does actually does alright for a smaller guard in getting steals/rebounds/forcing TO’s. If he can do a better job of preventing his man from scoring on him, expect his defensive numbers to climb.
Mitch Lightfoot is surprisingly -0.55 ppg to the average bubble player, and David McCormack is likewise negative at -0.30. One big reason for this is that both players are isolated in pick-n-roll situations often as teams seek to isolate mismatches. Teams did the same thing last year with Udoka Azubuike, but Doke was a good enough shot-blocker, rebounder, and paint protector to make up for any trouble he had defending the high ball-screens. Lightfoot, and especially McCormack, can make up for defensive woes by winning the mismatch on the offensive end, and Big Dave is starting to really do that of late.
My suggestion would be for this team to hang its hat on defense. This would mean playing Wilson and Harris less, and getting Grant-Foster and Enaruna more minutes alongside the starting three guards (Garrett/Braun/Agbaji), who run the gamut defensively from good to elite. A line-up without Wilson or Harris would not have an athletic disadvantage in positions 1-4, leaving only the 5 man as the relative weak-point. Some caution should be made as the numbers presented here are descriptive and not entirely predictive, but there is some validity in adding up values from five individuals to imagine what that line-up could do. Either way, a lineup consisting primarily of these seven (Garrett, Braun, Agbaji, McCormack, Grant-Foster, Enaruna, Lightfoot) would likely be around 2.0 points better on defense per game. There may be some trade-off offensively with this rotation, and if Jalen Wilson breaks out of his slump there will be good reason to get him back on the court to improve the offense.
In closing, whatever the Hawks are running on offense clearly isn’t working. The weave is pointless, and Marcus Garrett is being asked to do too much creating on offense. Braun needs to produce more (be more aggressive). One benefit of Grant-Foster, when he is not hoisting up bricks, is that he can create a bucket by getting downhill. Still, the man to feed the ball to is David McCormack. His shooting, decision making, and pace of play have gotten much better this season.
