
The 2013 Kansas Jayhawks finished with a record of 31-6 (14-4), winning the Big 12 Regular Season and Conference Tournament. The team earned a 1-seed in the NCAA Tournament, reaching the Sweet 16 before losing. The team’s Sports Reference link is here.
Offense
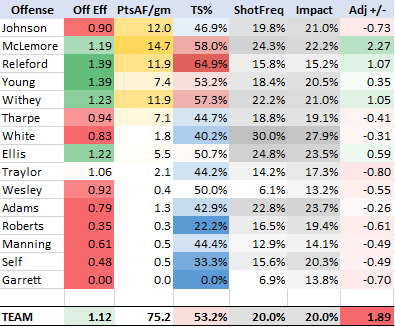
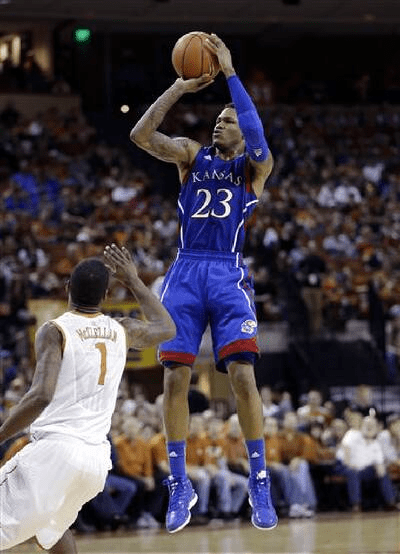
Losing leading scorers Thomas Robinson and Tyshawn Taylor from the prior year, the 2013 offense struggled compared to other Jayhawk teams. Redshirt freshman Ben McLemore was KU’s most talented scorer, contributing 14.7 points of offense per game while shooting a nice percentage on good volume. He was the only Jayhawk who provided over 2 points of value on offense for the season.
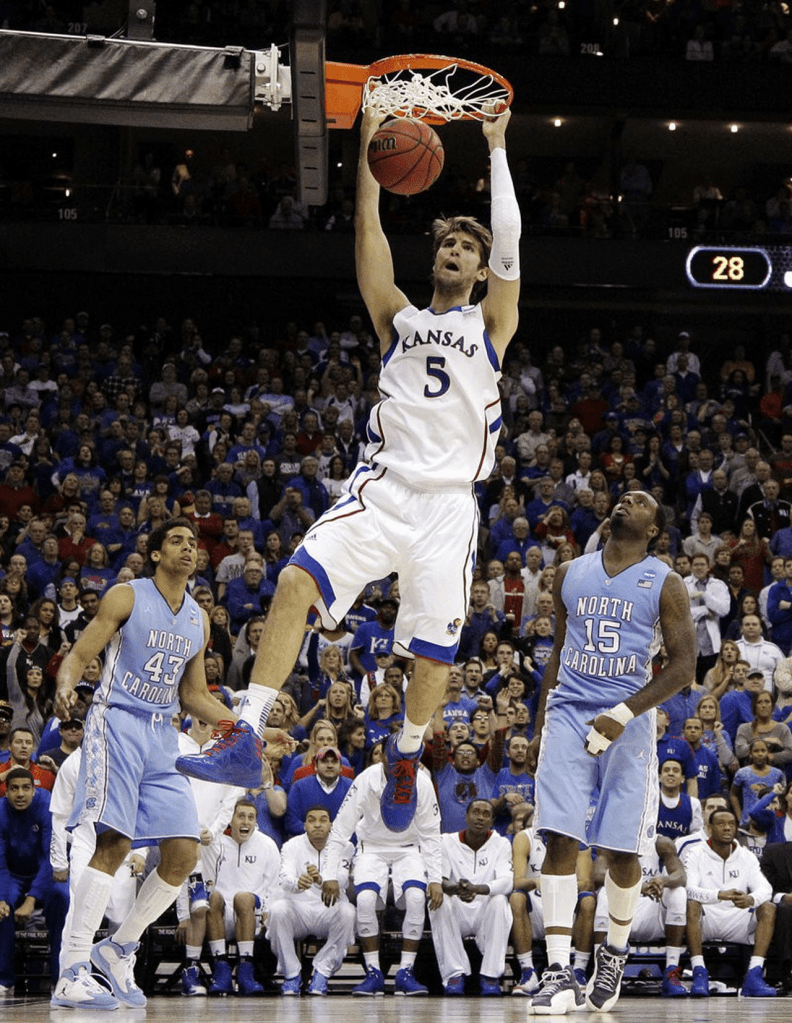
Seniors Travis Releford and Jeff Withey had solid offensive seasons, with Releford contributing an excellent 1.39 Offensive Efficiency at the wing position. Both Perry Ellis and Kevin Young were complimentary offensive players as well. Senior PG Elijah Johnson’s poor offensive season was due primarily to poor shooting.
Defense
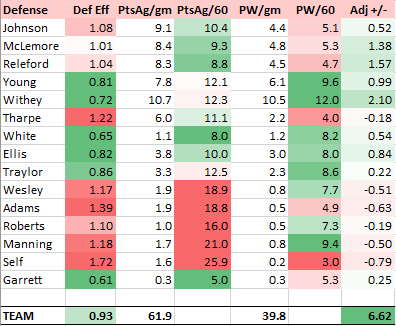
The 2013 team was very defensive-oriented. In fact, of its top-9 players, only Naadir Tharpe failed to provide above-bubble value. The defense was anchored inside by Jeff Withey who finished with a defensive score above +2.00 for the second straight season. Ben McLemore’s defense was underrated, as he graded out as a near-peer defender to senior Travis Releford. The 2013 team was Bill Self’s 8th consecutive team to reach a defensive Adj. +/- score of +5.00 or better, a mark that only 2 KU defenses have reached since (2016, 2020). The 2013 team was a classic, early Bill Self team that hung its hat on defense.
Adj. PPG +/-
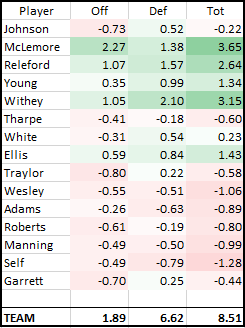
Ben McLemore was KU’s most valuable player in 2013, followed by Jeff Withey and Travis Releford. The team had nice balance with Young and Ellis also providing over +1.00 of value per game. The PG position was the team’s weakness, with Elijah Johnson battling injury all year and Naadir Tharpe struggling in moments. The TEAM score of +8.51 is actually a full point below KU’s average score since 1997. What’s amazing is that this team was still good enough to earn a 1 seed. The veteran play from its four seniors won it many close games.
Season Memories:
The 2013 team had multiple nice wins. Going into Columbus and beating a good Ohio State team for the third-straight time over the past two seasons. Smoking K-State by 21 after going through a rough three-game losing streak. But most memorable for this team are its two regular season wins against Iowa State. The first was in Allen Fieldhouse, when Ben McLemore banked in a 3 with 2 seconds left to send the game to overtime. He would torch the nets in the extra session as well, finishing with 33 points on 6-6 3’s for the game to lead the Jayhawks to victory.
The other Iowa State game will always be remembered as the “Elijah game.” With the Jayhawks needing a miracle to win in Ames, Johnson hit big shot after big shot to get the game to overtime, where he would then win it single-handedly. Johnson finished with 39 points and had a season-high game score of +19.78.
These moments proved to be huge for a Kansas program looking to extend its Big 12 Conference Title streak. KU would go on to share the regular season crown with K-State as each team had 14-4 records, though KU won both regular season meetings. In the conference tournament, KU would establish itself as the best team in the league by beating K-State for a third time in three tries, taking home the tournament trophy.
Information Availability Analysis for 2013 season
Charting the Hawks looks to estimate player value for Kansas Jayhawks teams and players by using as much information as is publicly available. In order to get the most accurate player value data, game video must be available. For seasons past, this isn’t always possible for each game KU has played. When a certain game isn’t available to watch, supplemental information is used (play-by-play data, video replay highlights, scouting videos, radio coverage, box score info, postgame write-ups, game-feed discussions, etc.). This supplemental information allows for a better estimates, which can be amended whenever better information comes available. However, this necessarily means that each season has different amounts of info which can be used. More recent seasons have every play (or 99.9% of plays) on video. These estimates are the best. The further we go back, generally there are fewer games available for rewatch and less supplemental info.
To account for this discrepancy, CtH has a system which can analyze how complete the info is for a given season. This scale is set to 100%, with 100% meaning that each available possession during the season was watched on video. If no games were on video and the only information that was available were box scores, we would have an estimate of around 67%. This means that box score data can get us player value estimates that are about 2/3 as good as having each game. Thus the range of options for a given game, going back from the mid-90’s to today, tends to be around 67% to 100%, again with that number more likely to be closer to the high end the nearer to the present we are.
For the 2013 Kansas Jayhawks season, the info availability scores are:
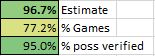
The Estimate number best estimates the average accuracy of each possession over the course of the season. For plays that weren’t able to be recorded (such as defensive points allowed), an educated guess is used, divided among the players in the game. There is a scale which determines how certain we are of player-value for that possession. At 96.7%, we have good confidence that the 2013 player value scores listed above are accurate to within a small range. With more information, the player value scores would change, but probably not by much.
The % Games shows the number of full games that were available to watch for that season during the time CtH was charting these games for player value. At 77.2%, this means that 28 of the 37 KU games for the 2013 were available. Thanks to those who upload archived games, whether on YouTube or elsewhere.
The % Poss verified number looks at all possessions, and counts only the ones that were recorded either through video or through a play-by-play transcript. While play-by-plays aren’t 100% accurate, they are mostly reliable and excellent supplemental information to use. They are missing a few important player value components, most notably defensive points allowed, but for offensive stats and rebounding/steals, they help make things more accurate. At 95.0%, only 1 possession out of 20 is below a 90% confidence level of estimating player-value.
In summary, the take-away is this. For the 2013 player value numbers, resubmitted below, there is a high confidence level that these values are within +/- 0.25 points per game. The info availability for 2013 is quite good, and while the true CtH player value would be somewhat different if we had 100% info availability through all possessions being on video when charted, there wouldn’t be much change in all likelihood. Note this doesn’t say anything about the CtH system itself. So even at 100% info availability, these numbers would still best be considered quantitative estimates of player value.
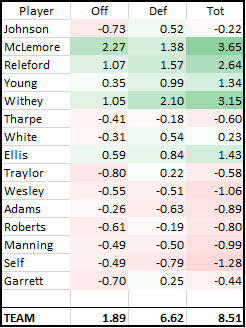
The 2013 Kansas Jayhawks player value table. At Adjusted PPG +/-, Ben McLemore is considered to be +3.65 points better per game than a bubble-level replacement would be at his position and minutes. This value score is an estimate, but one that is backed up by a solid amount of information (96.7%) and a logically-based system that seeks to balance all elements of a basketball game in order to show one value-score.
