The Similarities of Dajuan Harris and Russell Robinson

Dajuan Harris, the only Kansas player to publicly confirm he’s be back for the 2025 season (as of 3/28/2024), is a very polarizing player. Some in and around the program have called him “the best pure PG in the country,” while others see his lack of offensive production as a huge hamstring on the Kansas basketball program. Many fans want Harris gone, or at the very least benched, despite Dajuan being a 3-year starter and having a National Championship ring. What gives?

Like most things, the truth lies somewhere in between. Not unlike another one of Self’s favorites that caught some grief, Russell Robinson. Remarkably, both Harris and Robinson have had similar careers.

Here are the two PG’s career stats side-by-side:

  • Games: 134, PPG: 7.1, APG: 3.7, RPG: 2.7, eFG%: 47.5%
  • Games: 140, PPG: 6.4, APG: 4.8, RPG: 1.8, eFG%: 50.0%

Which is which? Russell is listed first, and you do see a difference with the assist (Harris’s stronger attribute) and rebound (Robinson’s stronger attribute) numbers. Russ Rob was a little better scorer but a worse overall shooter.

Other similarities lie in their career-arcs. Neither were starters or heavy contributors as freshmen, but then earned the starting role as sophomores playing alongside better talent. Both retained the starting PG job despite ups-and-downs, and in fact each had disappointing senior seasons when looking at individual stats. Here are the two players’ Per100AB value-stats by season.

  • Frosh: -3.21 Soph: +2.31 Jr.: +0.62 Sr.: -0.29
  • Frosh: -5.18 Soph: -1.72 Jr.: +3.46 Sr.: -0.23

Robinson is listed first again. His sophomore season was his best from a value-metric perspective. Harris’ peak season was his junior year. But by the time they were seniors, their value was just slightly south of bubble-level.

The other important value-stat, Wins Above Replacement, which accumulates an estimated win total above that of a Division 1 player, has each player at exactly +5.47 WAR (as of 3/28/2024). To be so close in WAR over the same career-length is to essentially be the same player from a value-perspective. Since 1993, this places them at the 48th/49th spots in terms of career WAR (out of 185 players).

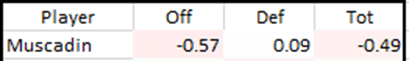
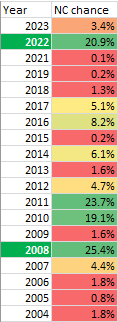
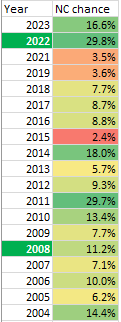
Looking deeper at their value profiles, we see that defense plays a larger role than offense in each PG’s games. Aside from 2006 when he had a solid season scoring the ball, Russ Rob was always a below-bubble offensive player. His defense, on the other hand, was positive during the years he started. Harris has never had an above-bubble offensive season, although in 2023 he was close, but his defense has been solid for the most part over his last 3 years.

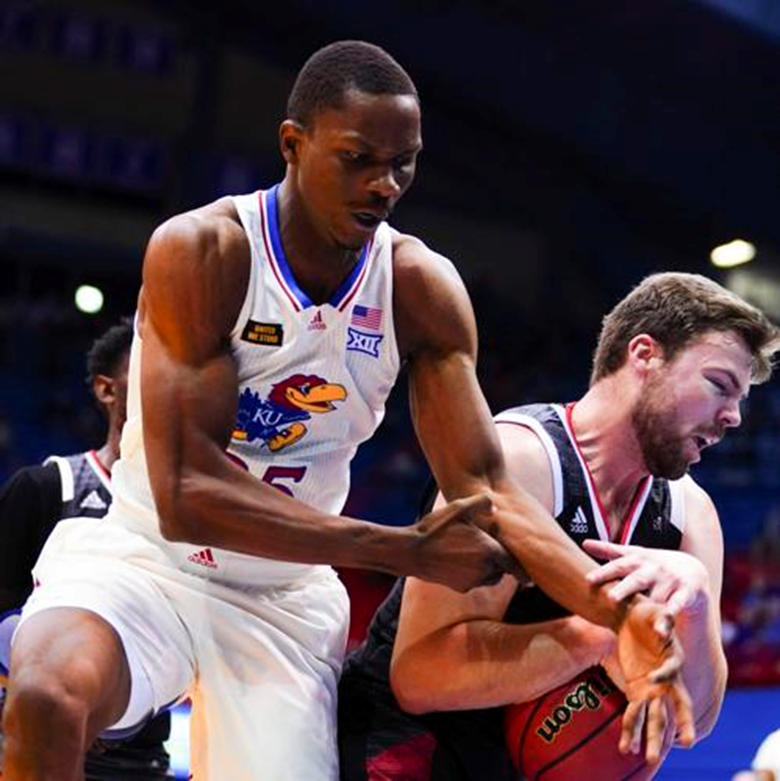
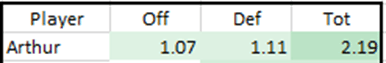
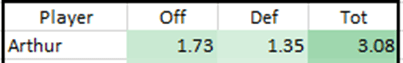
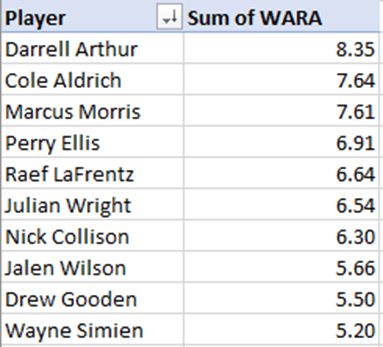
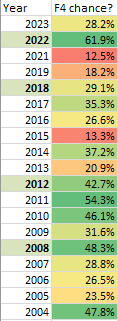
In 2008, Robinson’s senior season, Kansas cut down the nets thanks to great play from a number of talented players. Robinson helped KU win the title that season, but he didn’t carry the team. Kansas did so thanks to the contributions of future NBA-players, especially Mario Chalmers, Brandon Rush, Darrell Arthur, Darnell Jackson, Sherron Collins, and Sasha Kaun.

Similarly, in 2022, Harris’s sophomore season, Kansas cut down the nets thanks to a bevy of talent. Harris did his part, but he didn’t carry the team. Kansas had 3 future NBA-wings in Ochai Agbaji, Christian Braun, and Jalen Wilson. It also had an all-Pac 12 conference transfer in Remy Martin and a solid scoring center in David McCormack who was a senior.

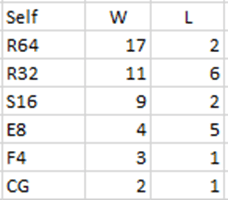
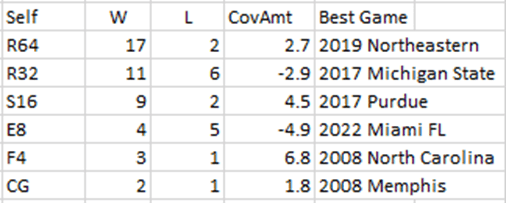
For Robinson, his last game in college ended in glory. For Harris, his last two teams have been bounced in the Round of 32. But Robinson was able to play on the best KU team during his last season, while Harris’s best team (so far) was during his sophomore year. This may be clouding what we think of Harris at the moment.

Finally, the one key difference between these two players’ career arcs is the fifth season that Harris will get to play. Dajuan has an extra chance to add to his legacy. By the end of next year, Harris will have a different WAR and different post-season legacy, for good or bad. Thinking back to the freshman-heavy 2009 team, one would have to think that having Russell Robinson as a fifth-year player would have made that team better. Similarly, keeping Harris means KU has a PG it knows can contribute at a certain baseline. They should and will certainly try to add to the backcourt for the 2025 season, but don’t write-off Dajuan just because he isn’t a star. He has a role, and he can help KU if the team has enough offensive and defensive talent around him.

Random Jayhawk Players – Statistical Breakdowns

As part of off-season content, Kansas players of seasons past are randomly selected to be featured in a breakdown of their careers. The players who were selected are listed below. Click on the link to discover who they are and how their careers look based upon the numbers.

Random Jayhawk Player 1

Random Jayhawk Player 2

Random Jayhawk Player Breakdown 2

Random Jayhawk Player Breakdown

For the off-season, periodically a random Kansas basketball player will be selected for a deeper statistical look. Since 1994, there have been 172 players who have played in at least one regular season game. The first random player selected was Darrell Arthur. This, the second installation, will feature the following randomly selected player…

Gethro Muscadin

This feature will be melancholy. Gethro passed away in 2022 following a 2021 car accident. He was taken to a hospital after the accident where he spent months being kept alive while apparently being unresponsive. Muscadin played in only 1 season as a Kansas Jayhawk.

2021 season

Gethro Muscadin was a 3/4 star recruit originally from Haiti who had spent time at Aspire Academy in Kentucky. He was 6’10 with a good athletic build and length. He came to the program for the 2020-21 season, expecting to be a longer-term project who could help the team with interior scoring, rebounding, and rim protection.

On the depth chart, Muscadin was behind David McCormack, Silvio De Sousa, and Mitch Lightfoot. Shortly before the beginning of the season, De Sousa left the team due to his off-court criminal charges. With only 2 true interior players remaining, there was some thought that Muscadin could get some playing time. This didn’t happen, as Kansas would end up playing a four guard/wing lineup around a single interior player (McCormack or Lightfoot).

Muscadin only scored 2 points during his 12 brief appearances wearing the Kansas Jayhawk jersey, which totaled 33 minutes. This lone basket was a dunk, and came late in the second half against Nebraska Omaha. It can be seen around the 15:25 mark of the following video:

In fact, the only shots, either on the floor or at the free throw line, that he took at Kansas were in this game. He played in 8 minutes and also had 4 rebounds. Muscadin did appear in both NCAA Tournament games, subbing in briefly during KU’s Round of 64 win against Eastern Washington and also grabbing a rebound in the late stages of KU’s Round of 32 blowout loss to USC.

Gethro’s advanced stats don’t add much given his limited playing time. Rebounding appeared to be his best attribute, particularly given his size and athleticism.

The next detail to consider is Muscadin’s value stats, which again are limited due to his scant court time.

Muscadin gave up value due to a limited offensive skill set, but his defense was quite acceptable. In total, a -0.49 points per game value score doesn’t look too bad. However, this is skewed due to limited minutes. If we take a per possession look, he was last among scholarship players that season at -9.68 points per 100 possessions. His WAR was -0.11, again constrained due to his limited number of minutes.

Post-Kansas career

Following the season, Muscadin transferred to New Mexico to play for the Lobos for 2021-22. He would play in 12 games, starting in 9, and score a career high of 18 against both Florida Atlantic and Montana St. His official and advanced stats from College Basketball Reference show improvements as he was able to find his way off the bench and onto the floor for a Mountain West Conference team in non-conference play against the 115th best non-con schedule. It was here where he best showed his basketball potential.

Gethro transferred from Kansas during an era where this has become far more prevalent. It wasn’t out of spite or bitterness. In fact, he never lost his love of the Jayhawks or affiliation with the program. Hours before his fateful car crash on I335 south of Topeka, he was watching his former teammates defeat Nevada at Allen Fieldhouse.

This tragic loss of life can best be addressed by the sentiments of Bill Self, which this blog shares. We will leave with coach’s words from a November 1, 2022 tweet.

Gethro Muscadin passed away late last night. He had been unresponsive since the car accident last December. Our thoughts and prayers go out to Gethro’s loved ones. So young. So sad. He will always be a teammate of ours. RIP.

Random Jayhawk Player Breakdown 1

This is a new segment for the off-season in which a Kansas player will be randomly selected to have an in-depth statistical breakdown of his career as a Jayhawk. Since 1994, that is the last 30 seasons, there have been 172 players to appear in a regular season game wearing the crimson and blue. In our initial installment, the random player selected is…

Darrell Arthur

Not a bad first random selection! Darrell Arthur played for the Kansas Jayhawks in the 2006-07 and 2007-08 seasons. For simplicity, we will refer to the former season as ’07 and latter as ’08. Arthur came in as a highly-touted true freshman and left after his sophomore year to enter the NBA draft. He was selected 27th overall in the 2008 NBA draft and played in 9 seasons for the Memphis Grizzlies and Denver Nuggets. He played in 503 NBA games and averaged 6.5 PPG over his NBA career. But this write-up is about his college career, and this is where we will now focus.

2007 season

According to College Basketball Reference’s RSCI Top 100 rankings, Darrell Arthur came in as the #11 prospect in his class. He was in the same incoming class as Sherron Collins and Brady Morningstar. Arthur played in all 38 games and produced the following traditional stats:

Arthur came in and performed right away. In his first collegiate game he scored 12 points with 6 rebounds and 3 blocks. The next game, the upset loss to Oral Roberts, Arthur scored 22 on 10/16 FG’s. He would put up his season high in points the next game, a bounce-back win against Towson, with 26 and 8. He had 19 and 9 in the team’s big win in Vegas against that great defending (and eventual) champion Florida Gators team. And while he struggled some during conference play, he was still a very positive player. His best conference game was against Iowa State where he had 15 and 11.

For a freshman to come in and produce, particularly during a time when KU had Julian Wright, Darnell Jackson, and Sasha Kaun; shows the level of play Arthur brought to the floor. He forced Self to play him by how good he was.

Arthur’s advanced stats, calculated by Basketball Reference, are as follows:

Arthur’s shooting was excellent, scoring efficiently by getting close baskets while having a solid mid-range game. His usage shows that he was a scorer, not someone who shot well only due to shot selection. Frosh Darrell Arthur could score. His rebounding percentage was fine for a freshman. His win share of 4.8 was fourth on the team that season, however his WS/40 was the team’s best. There’s an argument to be made here that he deserved more minutes. All of KU’s four bigs were good enough to start elsewhere, which made it tough to find more playing time.

Arthur’s value stats, which incorporate the most information and are thus the most accurate, show this:

This indicates that Arthur added 2.19 points of value per game above that of a bubble-player, with value added nearly equally between offense and defense. Arthur didn’t get routinely torched on defense (as some underclassmen do), and had active hands to not only grab rebounds but also get steals and force turnovers.

On a per-possession basis, Arthur’s value was the team’s best in ’07 at +6.61 points above bubble per 100 possessions. This is more evidence arguing in favor of Arthur’s playing time. Arthur’s best game of the season, and in fact the best outing of anyone that season, is estimated to be his performance against Towson. He had a +13.52 score, opponent-adjusted.

2008 season

Julian Wright, the team’s starting power forward the year prior, left for the NBA draft, which provided an opportunity for Arthur to start at that position his sophomore year. He would do just that, playing in all 40 games and starting in all but one (senior night). Along with his freshman year, his sophomore campaign’s stats are represented below:

Arthur’s stats increased across the board, aside from small drops on blocks/steals. He was the second-leading scorer behind Brandon Rush and second-leading rebounder behind Darnell Jackson. His shooting and scoring abilities increased as his minutes grew, leading to a more-efficient season that was also much more productive.

Arthur’s season high was 23 against Baylor, the team he almost went to. While he never touched the 26 he scored the season prior, he was a more reliable double-figure scorer, putting up 10+ points in 28 of 40 games. His most important game as a leading-scorer was his 20-point performance against Memphis in the 2008 National Championship game.

“Shady”’s advanced stats show a bump across the board, with a slight decline in usage. His win share increased by a full win, with a slight downtick on the per-40 metric. More minutes mean more concern with foul trouble, fatigue, etc. so this downtick isn’t anything alarming. The manipulation of the numbers indicate that he was heavily relied upon to be a leading player and that he performed.

Next graphic will show Arthur’s value stats.

In playing more minutes yet staying offensively productive and defensively agile, Arthur increased his per game value score to over +3.00. On a per-possession basis, he was second on the team at +7.26 per 100 possessions (Mario Chalmers). He was the team’s MVP for 8 games, including the National Championship game. On an opponent-adjusted score, Arthur’s best game in the 2008 season was against Texas in the Big 12 Tournament championship game, when he was +13.42 against the Longhorns.

As many KU fans know, Arthur was going to commit to Baylor before changing his mind and going with Kansas, due to a dream he had of Kansas winning the national championship. Arthur’s career is highlighted by this game. While Chalmers had the highlight shot to tie it in regulation, Darrell’s play throughout kept Kansas in it and helped lead the comeback charge. He hit an 18’ jump-shot to cut the 9-point lead to 7 with 1:57 left. He had a clutch basket with 1:00 left to cut the deficit to 2. And he added a dunk off a Chalmers feed early in OT to put KU up 4.

Summary

Let’s get to the ultimate question, which is how do we judge Arthur’s career at Kansas when compared to other Jayhawks? This can get tricky as there’s different ways to think about it. College basketball is different than other levels, in that those who are very good will move on sooner and play fewer than 4 seasons. If we take Arthur’s sophomore season: 12.8 PPG, 6.8 RPG, and a +3.08 Adj. PPG +/-; we see a good season that is nevertheless bested by numerous bigs in the Self-era: Perry Ellis, Wayne Simien, Thomas Robinson, Marcus Morris, Markieff Morris, Cole Aldrich, etc. Each of these players, in terms of Wins Above Replacement, had better Kansas careers than Darrell Arthur. For reference, Arthur’s career WAR is calculated to be 8.35. The worst of the above list is Markieff Morris at 9.75. Simien is up at 19.27 WAR.

But most of these names had their breakout seasons as upperclassmen and added their most value later in their careers. Since Arthur wasn’t around for potential junior or senior seasons, we don’t really have an apples-to-apples comparison regarding careers.  

If we look only at a player’s freshman and sophomore years, we get a comparison of how good Arthur was while at Kansas compared to other underclass PF’s and C’s.

Here we see Arthur better than the others over their first two seasons. He was better than Williams-era stalwarts as well; namely LaFrentz, Collison, and Gooden.

If we look at all positions, only Devon Dotson (11.51 WAR) tops Arthur when looking at all KU players’ freshman/sophomore years over the past 30 seasons. Arthur’s production as an underclassman is 2nd best of any Jayhawk over the past 30 seasons. This seems noteworthy for someone who can get overlooked when fans are devising their dream lineups. Incidentally, Devon Dotson is in the same boat when it comes to great KU guards.

Regarding all time seasons and Adj. PPG +/-, Arthur’s 2008 sophomore campaign is 49th and his 2007 freshman campaign is 80th (out of 426 player-seasons). These two years were very good but not great seasons when looking at all-time performances. When we look only at sophomore years, Arthur’s season is either 6th or 7th best (depending if Simien’s 2003 injury-plagued season is counted) out of 98. His frosh season was 9th best out of 119.

If one thinks of Darrell Arthur as one of KU’s great power forwards, he isn’t in the wrong. However, if we are just counting what a player did at KU, and recognize that players who stay for 4 years can have more of an impact than those that only play 1 or 2, we’d place Arthur as 33rd in career WAR out of 172 (81st percentile). Sandwiched in between Tyshawn Taylor and Travis Releford.

Wins Against Expectation in the 64+ Team Tournament Era

Since 1985, when it expanded to 64 teams, the NCAA Tournament has been held 38 times. In this period, there have been four programs separate themselves from everyone else. Duke (102), North Carolina (96), Kansas (93), and Kentucky (84) lead the others in terms of tournament wins during this period. Michigan State (62) and Connecticut (61) are next in line.

In this period, a 1-seed has won 3.29 games per tournament. A 2-seed is 2.33 games, a 3-seed 1.85 games, and a 4-seed 1.55 games. If we take each program’s collective expected wins each year on Selection Sunday after the brackets have been set, we have these programs as having the most expected wins in the period from 1985-present:

Kansas: 89.9

Duke: 88.9

North Carolina: 77.8

Kentucky: 67.3

Arizona: 63.1

This list can be thought of as showing which programs have had the best (collective) regular seasons since 1985. Kansas and Duke are essentially tied, with North Carolina third but comfortably ahead of the rest before Kentucky and then Arizona round out the top 5. Notice how Arizona is on this list but not the one above. Despite being seeded quite well throughout the years, Arizona has underperformed expectation in the Big Dance. Next, we will examine the top and bottom teams, relative to performance.

There are 10 teams which have won 10 more NCAA Tournament games than they were expected to (given their earned seeds). The list is as follows:

North Carolina: +18.2

Connecticut: +17.9

Kentucky: +16.7

Florida: +14.1

Michigan State: +13.5

Duke: +13.1

Michigan: +12.3

UCLA: +11.2

Louisville: +10.6

Butler: +10.5

It should be mentioned that these results do not take into account vacated wins. Louisville in particular lost numerous tournament wins during the 2014-2017 period because of its NCAA penalties. Other programs on this list have also had vacated win that would affect the totals had this been considered.

Kansas, despite its reputation of underachieving in March, is +3.1 on this list and number 22 (of 303 teams). It is also tops in the Big 12 in this metric.

On the flip side, there are a number of programs that haven’t performed to expectation. Before the list is revealed, can you think who these might be? Which programs seem to have good regular seasons, only to “choke” success away in March? Here is the bottom 10 list, starting with the worst program:

Purdue: -10.8

Pittsburgh: -9.3

Illinois: -8.7

Virginia: -8.4

BYU: -7.8

Missouri: -7.5

Cincinnati: -7.3

Oklahoma: -7.2

Arizona: -7.1

New Mexico: -7.1

One point in defense of these schools. In order to be on this list, a program has to be good enough to make numerous tournaments. Purdue is a perennial NCAA Tournament team, having made the Big Dance 14 of the last 17 years (Matt Painter’s tenure) there was a Tourney. The Boilermakers have had a top-4 seed in 8 of these seasons, showing they’ve played quality basketball in the regular season. But for some reason, March Madness has been more sadness than gladness.

Of the 303 programs which have made an NCAA Tournament since 1985 (i.e. the Round of 64, play-in “First Four” games are excluded in terms of results here), 112 (or 37%) have not won a single game. Many of these programs are low-major types which have only been to the Big Dance at most few times as a 14-seed or worse. By far the most notable program to never win an NCAA Tournament game is Nebraska, which was expected to win 6.1 games during this span. The biggest upset loss for the Cornhuskers was in 1991, when they were upset in the First Round as a 3-seed.

Gonzaga is an interesting case. The Bulldogs’ first NCAA appearance was in 1995, but since 1999 the Zags have been as consistent as anyone. First, they were America’s darlings and the Cinderella which made the Elite 8. Since that time, they’ve developed into a good program, then a great one, and now borderline elite. They’ve earned 5 1-seeds since 2013 (second-most in that span behind Kansas) and finished national runner-up twice. The only thing missing is a National Championship. Because of this, some think Gonzaga has underachieved, but the Zags are actually +6.5 wins better than expected given their seeds. With 45 Tournament victories, they’ve won only 1 fewer game than Villanova (3 titles) has in that time. If we restrict the period to start with 1999, the year Gonzaga made its first Cinderella run, the Zags are tied 6th (with UConn) in terms of Tourney wins.

We’ll finish with Kansas. Bill Self’s teams have won 45 Tournament games in his tenure (including 2023, when Norm Roberts was the bench coach for the Tournament games due to Self’s health issue). However, his teams have been expected to win 50.1 games, for an underachievement of 5.1 games. Roy Williams’ tenure was marked by 35 wins against 32.5 expected wins, for an overachievement of 2.5 games. It was Larry Brown who did the best, winning 13 games against an expected 7.3 games. This is an overachievement of 5.7 games. In total, this adds up to +3.1 against expectation.

Tournament Runs by Champion since 2010

The 2023 Connecticut Huskies won the NCAA Tournament in dominant fashion. Each win was by 10+ points, and they never seemed to be in any real peril throughout their run. I wanted to examine each champion’s path to the title over the years to see which were the most dominant and which ones were the most stressful.

To quantify this, I settled on three different metrics. Margin of Victory, average score throughout each game, and average lowest winning percentage during each of the 6 games (per KenPom). Because these final two metrics rely on info that has only recently been provided, this list will only go back to 2010. Thus, only the previous 13 champions are included.

Let’s look a bit closer at each metric and see why each was chosen as a way to measure Champion run domination.

Margin of Victory – Simply put, the higher the MOV, the more dominant you were that game. This one is the easiest to calculate and can be applied going back much further than 2010. Since 2010, all but two champions have an average winning margin of +10.0 in their six game spurts.

Average +/- Throughout Game – While MOV tells us quite a bit, it cannot relay another level of dominance/stress, which is the margin during the game. A team which wins by 10 by making a bunch of FT’s at the end of a once-close game was less dominant than a team that coasted to a double-digit lead and held it throughout the second-half, only to give up some late baskets to its opponent once the game was out of reach. Dominant teams control the game throughout, and this is reflected in average margin throughout the game.

Lowest Winning Percentage per Game (averaged) – This metric is made possible by KenPom’s 2010 and later game data. He calculates at which point in the game the winning team’s lowest chances were (per his model). For instance, in the 2022 National Championship game, his model calculated that KU had a 16.7% chance of winning at halftime, the lowest point of the game. By averaging these numbers, we can compare how “comfortable” each champion’s run was relative to one another. The lowest point for any champion during that time was 2019 Virginia’s Final 4 game against Auburn. Down 61-57 with 17 seconds left, Virginia had a 5.5% chance of winning at that point.

Combining the metrics – Lastly, we will combine these metrics and compare them using percentiles. The range of possible values are 0.0000 to 1.0000. The greener the number, the closer to 1. The redder the number, the closer to 0.

2018 Villanova had the most dominant run according to this system, with 2022 UConn coming in second. The least dominant was 2014 UConn, which won as a 7-seed but was projected to lose at some point in each of its 6 games. In fact, it had to comeback just to force overtime to even get out of its R64 game. 2022 Kansas is in the middle, placing 9th out of 13 but still very close to 0.5000 from a percentile look. That team had some stressful moments, including halftime deficits and close wins, but also some dominant moments as well.

There’s no real formula to success when it comes to being a champion. Sure, you would like to win each game by double-figures and with ease. But there are some teams that aren’t on this list despite having done just that for 4 or 5 games.

Self* Teams and the Round of 32

In the Bill Self era, a common critique is that KU teams struggle in the Round of 32. A similar complaint is that KU teams struggle in the second game of the weekend series in the Tourney, i.e. not just the Round of 32 but also the Elite 8.

Let’s look at Self’s W-L record in the NCAA Tournament by round while at Kansas. *These games include the 2023 Tourney, in which Norm Roberts was the acting coach on the bench as Coach Self was recovering from his health issue.

There is a steady drop-off from the R64 to R32, but this should be expected given that the second round games will be against good teams, not sub-100 KenPom teams as it is most years in the first round. But when KU teams make it to the S16, they do quite well, only to see another steep drop in the E8. The next table compares the records of KU in the first games of the Tourney pods (R64, S16, F4) against the second games of these pods (R32, E8, CG).

This shows quite a contrast. Again, opponent quality is likely at play here. But there does seem to be some indication that KU plays better in its first games (when it has time to rest/prepare) than its second games (which occur with only one day of rest/prep). To test this, we will see how KU did against its projected margin using Vegas odds.

This table recreates the earlier one, with the average Cover Amount column added. This column shows how much better (or worse) KU does in points against its cover amount. For the R64, KU’s average margin is 2.7 points better than what the lines showed. But when we get to the R32, KU is 2.9 points worse than their lines. The last time KU covered a R32 was in 2017 vs. Michigan State. They are 0-5 ATS in this round since. The second weekend games are even more pronounced. KU is +4.5 in the S16 and a shocking -4.9 in the E8. And this was with KU going 2-0 in its last two E8 appearances (2018 vs. Duke, 2022 vs. Miami FL). Before 2018, Self’s teams were 10.28 points worse than expected on average in the E8 round.

For whatever reason, KU teams under Self do better in the NCAA Tourney when they have more time to prepare. Last, we’ll expand the table again to show KU’s best performance (against Vegas expectation) during the Self era.

KU Tournament Paths in the Self-era

The NCAA Tournament also goes by the moniker “March Madness,” reflecting the unpredictability of outcomes. Kansas has been no stranger to this madness, as it has been bounced early on multiple occasions as a highly-favored team but also won the 1988 NCAA Tourney as a 6-seed.

Each path to a possible title is unique. Some years, the bracket can open up for a team as upsets clear the way for a better chance at success. Other years, the bracket goes chalk and difficult opponents are faced. We will explore how varied KU’s possible paths have been down below.

Also at play is the idea of the possible opponent. Had KU defeated Arkansas this year in the R32, its next game would have been against Connecticut in the S16. For fans of any team, viewing potential matchups down the line is commonplace after the brackets are released on Selection Sunday. But after the team loses, the would-be matchups become less intriguing. For this exercise, we will be examining KU’s would-be matchups had they advanced.

We will restrict our study to the Bill Self era. This gives us 19 seasons worth of Tournament data (Self has been the coach at KU for 20 seasons, but 2020 is excluded obviously). For data, we will use KenPom’s final results of that season to serve as a team’s relative strength. We will then match up Kansas against its actual or hypothetical opponents for any given round. For years where KU makes the championship game, these opponents will all be actual opponents. For other years, some opponents will be those KU would have faced had it kept winning. Then, using KenPom’s numbers, KU will be compared to said opponent to get an estimated points spread. Next, these point spreads will be converted to winning percentage estimates using historic data from Team Rankings and a smoothing process. For instance, if a team is 7.7-point favorites (per KenPom), then that team wins the games an estimated 78.0% of the time (using the smoothed historic numbers). It is this 78.0% number that gets used to estimate Final 4 and National Championship odds.

We’ll start with Final 4 odds. Below is a table which calculates KU’s odds of making the Final 4 given the path that occurred.

The seasons with actual F4 appearances are highlighted in green. The average F4 chance for KU in the Self-era is 23.1%, with conditional formatting being set as Red for 1/10 chance, Yellow for 1/4 chance, and Green for a 1/2 chance. There are two factors at play. First is the draw, how the bracket turns out. More upsets in your region means an easier path. The second factor is the strength of the team, and this also turns out to be important. For 2008, KU’s biggest break was in the S16, when it faced 12-seed Villanova. For a S16 game, it was a much weaker opponent than normal. The E8 game, against 10-seed Davidson, was not really a break. Despite the double-digit seed, Davidson was about as strong as the average E8 opponent or potential opponent KU faces/could face.

KU took advantage of 2 of its better chances to make the Final Four in 2008 and 2022. The biggest chances wasted were in 2010 and 2011. KU’s toughest opponent to make it to the F4 (and in fact the NC game) in 2011 was actually its R32 opponent Illinois. For 2010, KU would have been favored by 8.2 and 9.3 points for its would-be S16 and E8 games.

The 2012 path was Self’s fifth-best chance, which he converted by getting to New Orleans. 2018, which was a year in which KU didn’t get any seeding breaks or upsets, was the most-unlikely F4 for Self. Next we look at National Championship chances.

This table will look similar to the Final Four table. Note that the conditional formatting is set at Red for a 1/50 chance, Yellow for a 1/20 chance, and Green for a 1/5 chance. KU’s 2008 and 2022 titles are highlighted.

Self has had four really good chances, given the strength of his team and the draw he received (2008, 2010, 2011, 2022). But “really good” regarding odds of a title in the NCAA Tournament is still far less than even a 30% chance. He cashed in on two of those chances when just one title would have been above expectation. Aside from those four seasons, KU’s best title chance was below 10%. It’s really hard to win 6 games in the Big Dance, especially if you don’t get some breaks.

Removing KU’s team strength from the equation

Above there were 2 variables, the path that played out in that specific bracket and the relative strength of each KU team. As the 2008 squad was KU’s strongest, it isn’t unsurprising that it had better odds than other KU teams. What we will now do is remove the KU-specific component and look at each tournament path assuming a team with a 30.00 KenPom AdjEM is facing it. 30.00 is a very good AdjEM, and most teams that achieve that mark will earn a 1-seed. As good as KU has been in the past 20 seasons, its average AdjEM is 25.82, well below this 30.00 mark. It has only reached an AdjEM of 30.00 in 3 seasons under Self; 2008, 2010 and 2020.

This exercise will serve a dual-purpose. It is this 2020 team that didn’t get a chance to make a run for a title. With an AdjEM of 30.23, it is very close to the 30.00 number. We can plug the 2020 team for other KU teams in other brackets to analyze how successful it would have expected to be. For the first table, we see which paths were the easiest and which were the hardest to get to a Final 4. Later we will look at the National Championship table.

The 2022 path was the easiest, as that KU team faced weak S16 and E8 opponents. Unsurprisingly, 2011 was also a good break. However, none of these paths can remotely be described as a “cake-walk.” Even the 2011 path is expected to miss a F4 nearly half the time. On average, a KenPom team at 30.00 AdjEM (abbreviated from now on as KP30) is only expected to make 33.3% of Final Fours. Looking at the 10 years KU got a 1-seed, this KP30 team makes the F4 37.9% of the time. In the other 9 seasons (either as a 2,3, or 4 seed), this KP30 team makes the F4 only 28.1% of the time. Even the Final Four is flat-out hard to get to.

With National Championship chances, what first stands out is how much 2008 drops once you account for KU’s strength that season. The Final Four was loaded, with all four one-seeds. Having to beat North Carolina and Memphis was not easy. All told, a KP30 team getting KU’s path in 2008 was expected to win only 11.2% of the time. Incidentally, 11.2% was also the average chance of winning a national championship for a KP30 team.

KU’s easiest paths occurred in 2022 and 2011, with KU cashing in 2022. 2014, with teams like 11-seed Dayton, 7-seed UConn, and 8-seed Kentucky in the path; was an underrated good chance at a trophy. KU’s toughest paths have come relatively recently in the Self-tenure. The 2015 path would have been the only time KU had to face a chalk-bracket, as it would have had to have beaten three #1 seeds (including number-1 overall Kentucky) to earn a trophy.

The run of 2016-2018 also feels better in retrospect. While KU got three 1-seeds in this span, they only reached one Final Four and never played for a title in a championship game. But the cumulative expected titles a KP30 team would achieve in total for these three years is only 0.252. They turned out to be tough draws.

To tie this to the 2020 team, that group would have been expected to reach a Final Four, at best, 40% of the time. A National Championship would be 15% at best. Even as a 1-seed with a typical path, KP30 teams are likely to still get beat somewhere along the way. Winning 6 is tough.

Last, to highlight how difficult the tournament is, we’ll look at what AdjEM would be needed to reach certain thresholds. For instance, it would take an AdjEM of 34.72 for a team to reach the Final 4 50% of the time given the draws KU got over the past 19 tournaments. Even if we limit the draws to 1-seed paths only, the AdjEM would have to be 33.36. This is a level of play that only one KU team has reached in the 20-year Self-era. For National Championships, this level is more remarkable. To win a title 20% of the time, you’d need a 32.37 AdjEM. To win it 25% of the time, 34.00. To win it 33.3% of the time, the level of play would have to reach 36.30. To have even odds of winning, the estimated AdjEM would have to be 40.53. This type of performance has only achieved by the 1999 Duke team which was National Runners-up.

Off-Season Filler: Returning Minutes by Season

For 2024, KU’s roster will likely lose the following four players: Jalen Wilson, Kevin McCullar, Cam Martin, Gradey Dick. Of these four, three were starters in 2023 and logged serious minutes. Gradey is the most likely name to return despite having the highest draft potential, but as it sits today, we will project him going to the NBA after one season and leave him off the 2024 roster.

In the past 29 seasons, KU has returned 59% of its minutes played from the prior year. This is calculated by looking at a particular roster (say 2023), and calculating what percentage of possible minutes were logged by this roster in the season prior (which would be 2022 in the example). For 2023, KU returned 2022 starters in Jalen Wilson and Dejuan Harris. It also returned 2022 bench players such as K.J. Adams and Joseph Yesufu among a few others. Adding up these players’ 2022 minutes over total 2022 minutes, we calculate the 2023 roster had 37% of its minutes returning.

There is a small correlation between minutes returning and level of success. The R^2 is 0.2324. Judging success as the average game-score a certain roster produces, the best 5 Jayhawk teams in the past 29 seasons have been above the average returning minutes: 2008 (85% returning), 1997 (91%), 2010 (89%), 2002 (68%), and 2003 (62%). Of all the really-good Kansas teams, only the 2020 team (43% returning minutes) was noticeably below average. But even this is misleading. That 2020 team featured Udoka Azubuike, a senior by class who was injured for most of 2019. If you took Doke’s 2018 minutes played (the season in which he was mostly healthy), the returning minutes goes above 50%.

If we look at the correlation between returning minutes and NCAA success, there is a lower correlation (but still some with an R^2 of 0.0512). Looking at only the six Final 4 teams from this period, the teams had returning minutes of: 2022 (71%), 2018 (47%), 2012 (32%), 2008 (85%), 2003 (68%), 2002 (62%). In average, the Final 4 teams have 61% of returning minutes, slightly higher than non-F4 teams (58%). Again, low correlation here.

The 2024 outlook, as it sits today (3/22/23), would be that KU returns 52% of its minutes. If we project out this number to team success using historic rates over the past three decades, this would produce an average game-score of +9.14 (about a low-1/high-2 seed most years) and an estimated number of NCAA Tournament wins at 2.2. The following table has the data discussed in visual form. For the Factor column, this is the number of possible minutes played by returnees, with the highest possible number being 5.000. This column is divided by 5 to get the % column which gets color-formatted.

It should be mentioned that returning minutes aren’t the only thing used to project team success when CtH publishes preseason expectation numbers in October. Not all returning players are great, and sometimes newcomers add higher value than expected. With the transfer portal changes, a large share of a roster’s newcomers have proven themselves to be valuable college players, something that doesn’t get captured by this exercise. KU having Kevin McCullar in ’23 and Remy Martin in ’22 was valuable.