
The 2023 Connecticut Huskies won the NCAA Tournament in dominant fashion. Each win was by 10+ points, and they never seemed to be in any real peril throughout their run. I wanted to examine each champion’s path to the title over the years to see which were the most dominant and which ones were the most stressful.
To quantify this, I settled on three different metrics. Margin of Victory, average score throughout each game, and average lowest winning percentage during each of the 6 games (per KenPom). Because these final two metrics rely on info that has only recently been provided, this list will only go back to 2010. Thus, only the previous 13 champions are included.
Let’s look a bit closer at each metric and see why each was chosen as a way to measure Champion run domination.
Margin of Victory – Simply put, the higher the MOV, the more dominant you were that game. This one is the easiest to calculate and can be applied going back much further than 2010. Since 2010, all but two champions have an average winning margin of +10.0 in their six game spurts.
Average +/- Throughout Game – While MOV tells us quite a bit, it cannot relay another level of dominance/stress, which is the margin during the game. A team which wins by 10 by making a bunch of FT’s at the end of a once-close game was less dominant than a team that coasted to a double-digit lead and held it throughout the second-half, only to give up some late baskets to its opponent once the game was out of reach. Dominant teams control the game throughout, and this is reflected in average margin throughout the game.
Lowest Winning Percentage per Game (averaged) – This metric is made possible by KenPom’s 2010 and later game data. He calculates at which point in the game the winning team’s lowest chances were (per his model). For instance, in the 2022 National Championship game, his model calculated that KU had a 16.7% chance of winning at halftime, the lowest point of the game. By averaging these numbers, we can compare how “comfortable” each champion’s run was relative to one another. The lowest point for any champion during that time was 2019 Virginia’s Final 4 game against Auburn. Down 61-57 with 17 seconds left, Virginia had a 5.5% chance of winning at that point.
Combining the metrics – Lastly, we will combine these metrics and compare them using percentiles. The range of possible values are 0.0000 to 1.0000. The greener the number, the closer to 1. The redder the number, the closer to 0.
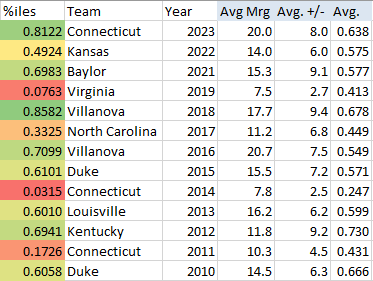
2018 Villanova had the most dominant run according to this system, with 2022 UConn coming in second. The least dominant was 2014 UConn, which won as a 7-seed but was projected to lose at some point in each of its 6 games. In fact, it had to comeback just to force overtime to even get out of its R64 game. 2022 Kansas is in the middle, placing 9th out of 13 but still very close to 0.5000 from a percentile look. That team had some stressful moments, including halftime deficits and close wins, but also some dominant moments as well.
There’s no real formula to success when it comes to being a champion. Sure, you would like to win each game by double-figures and with ease. But there are some teams that aren’t on this list despite having done just that for 4 or 5 games.
