
Since 1985, the NCAA Tournament has had 64+ teams, with four regionals of teams seeded 1 – 16. In this format, each team has to win 6 games to win the Tournament with each seed having a different path (for instance, a 1 seed has to beat a 16, 8/9, 4/5/12/13, 2/3/6/7/10/11/14/15 to make the Final 4…this differs from a 2 seed’s path). What this means, is that given this many instances, we have some interesting data by seed-line.
For today, we will focus on the prevalence of each seed in the Final 4. With four regionals, the Final 4 is made up of the four regional winners. It isn’t until this round that teams of the same seed can meet. We will first look at which percent of each seed makes the Final 4.
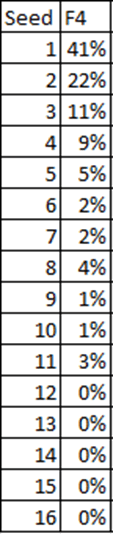
Above is the table, and below is the bar chart of the same data.
The 1-seed is the most prevalent (unsurprising), with a declining frequency by seed down to the 7 seed. However, we see a jump when we get to the 8-seed, and the 11-seed has also won its regional more times (5x) than the 6-seed (3x) since 1985. This is definitely a surprise in the data. Some might hypothesize that the reason for this is that the 11-seeds often contain undervalued mid-majors, whereas the 6-seeds are often weaker power conference teams, and that the best mid-majors are therefore under-seeded. In other words, it would be a claim that the bracket-makers get things wrong along these middle seed-lines.
However, this doesn’t really work. After all, the 6 v. 11 game is played 4 times in the First Round. If 11-seeds were systematically under-seeded, it would show up here. Instead, in 148 games, we see that 6-seeds win 61% of these matchups and have an average scoring margin of +2.96 (nestled in between the 5v12 and 7v10 margins). For whatever reason, the 11 seeds have had more success than the 6’s at winning a regional. However, a 6-seed has won the NCAA Tournament (1988 Kansas). Of course the 1983 N.C. State championship team was also a 6-seed. It falls outside the range of 1985-present, but their run was no less impressive than it would be today.
But now let’s look a little deeper at the 1-seed’s frequency at a Final 4. In the 37 tournaments since 1985, 41% (60/148) of the top seeds made the Final 4. This works out to an expected number of 1-seeds per in the Final 4 per tournament of 1.62. Because each regional is decided independently, this is just the average expectation. Some years it might be 1, some it might be 2. And other years, less frequently, it might be 3 or all 4. Or, it could be 0.
Historically, there has been 1 tournament (from 1985-2022) where all four 1-seeds made it to the Final 4. This was in 2008. There have also been 2 tournaments in this span where no 1-seed has made it to the Final 4. This happened fairly close to 2008, with 2006 and 2011 seeing no 1-seeds win their regionals.
We are left with 148 independent events, which are the historic regional results by seed. Using this data set, we have had all four 1-seeds win their regionals in exactly 1 tournament of 37 (2.7%). How often should we expect this to happen? If we take (0.4054)^4, we get the answer, which is also 2.7%. While one would expect the 1-seed to have the best chance of winning its regional, having all four 1-seeds go 16-0 before the Final 4 is a rare event, as shown by the historic results.
The flip side is the question of how frequently we should see NO 1-seeds make the Final 4. It has happened twice in 37 tournaments, but is that about what we’d expect? The formula here will calculate how likely it is that at least one 1-seed makes the Final 4. It is similar to the earlier example, and it is calculated thusly: 1 – ((1-0.4054)^4). The result is 87.5%, meaning that we’d expect to see no 1-seeds about 12.5% of the time (roughly 1 year out of 8). In reality, this has only occurred 2 years out of 37.
Using the 1-seed success rate at making a Final 4, the last question is, what will happen next? All 1-seeds, or no 1-seeds? Clearly, the answer is the latter is more likely. This does depend on the strength of the 1-seeds relative to the field. In 2008, the 1-seeds were all excellent (although 2011 had a good crop of 1-seeds by computer metrics as well). But assuming the relative 1-seed skill-level will remain what it has been over the past 37 seasons, the math says it is 5.15 more likely that all the 1-seeds miss the Final 4 in any given year than it is that all four 1-seeds make the Final 4.
We will next look at other seed-lines. While 2-seeds are all excellent teams, their performance when compared to the 1-seeds is a significant drop-off. We’d expect all four 2-seeds to make a Final 4 only once in 458 tournaments. For the 3-seeds, this would occur once in 5,744 tournaments. This gets exponentially rarer as we move down the seed-line.
Last, let’s look at how often we’d expect to not see any top seed. This table has the estimates:
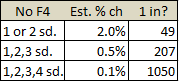
2011 is the only tourney to fail to have a 1 or 2 seed in the Final 4. The other two scenarios haven’t occurred and likely won’t in your lifetime.
